

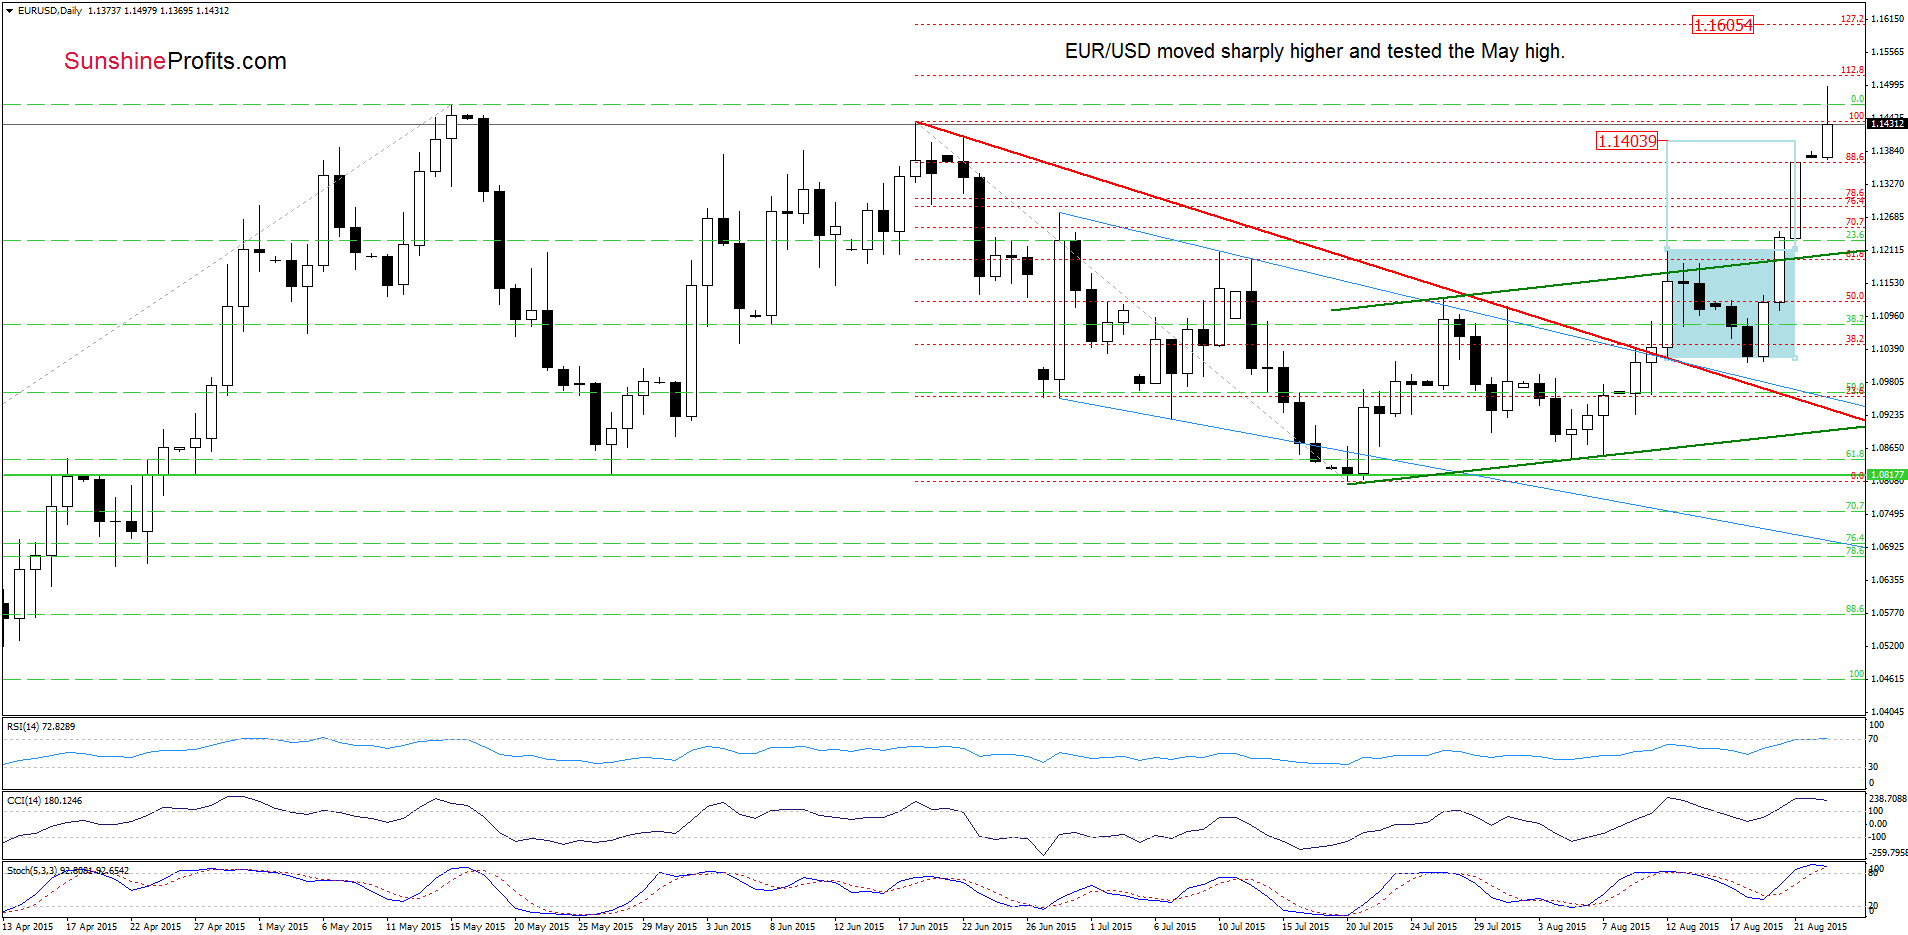
Earlier today, the euro extended gains against the greenback as growing concerns that the Federal Reserve may keep interest rates on hold for longer pushed the USD Index lower. As a result, EUR/USD broke above the May high, hitting a fresh multi-month high. Are there any technical factors that could stop further rally?
In our opinion the following forex trading positions are justified - summary:
EUR/USD
Quoting our previous Forex Trading Alert:
(…) What’s next? Taking into account the fact that buy signals generated by the indicators remain in place, we think that the pair will climb to the 88.6% Fibonacci retracement in the coming day(s). Nevertheless, yesterday’s upswing took EUR/USD above the upper border of the consolidation, which suggests that we may see an upward move even to around 1.1403, where the size of the move will correspond to the height of the formation.
From today’s point of view we see that currency bulls pushed the pair higher as we had expected. With this upward move, EUR/USD not only reached our upside target, but also climbed above the May high. Despite this improvement, the exchange rate pulled back, invalidating earlier small breakout. Nevertheless, the pair remains quite close to the May and June highs, which means that another attempt to move higher can’t be ruled out. However, the current position of the indicators (the RSI climbed above the level of 70, the CCI and Stochastic Oscillator are overbought) suggests that reversal is just around the corner.
Are there any there technical factors that could encourage currency bears to act? Let’s examine the weekly chart and find out.
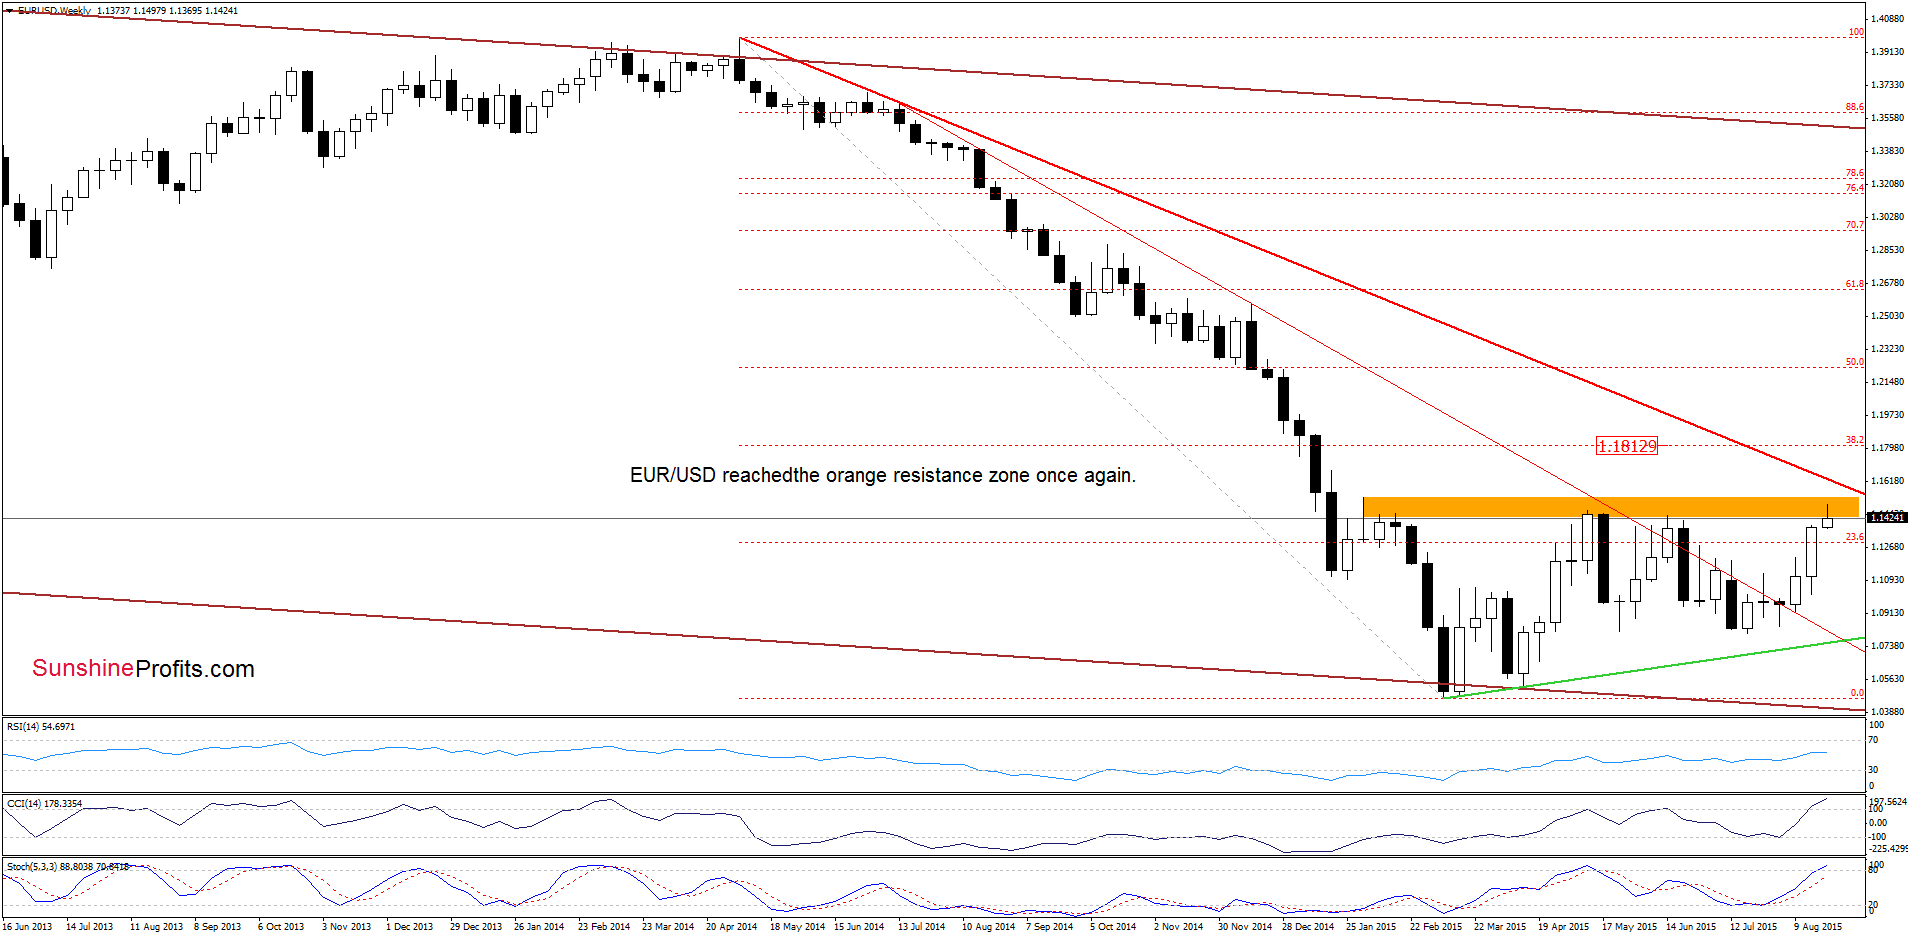
From this perspective we see that EUR/USD extended gains above the previously-broken long-term red declining line and reached the orange resistance zone. In previous months, this area was strong enough to stop further improvement and trigger a correction. Taking this fact into account, it seems to us that history will repeat itself and we’ll see lower values of the exchange rate in the coming week.
Very short-term outlook: mixed with bearish bias
Short-term outlook: mixed
MT outlook: mixed
LT outlook: mixed
Trading position (short-term; our opinion): No positions are justified from the risk/reward perspective at the moment. We will keep you informed should anything change, or should we see a confirmation/invalidation of the above.
GBP/USD
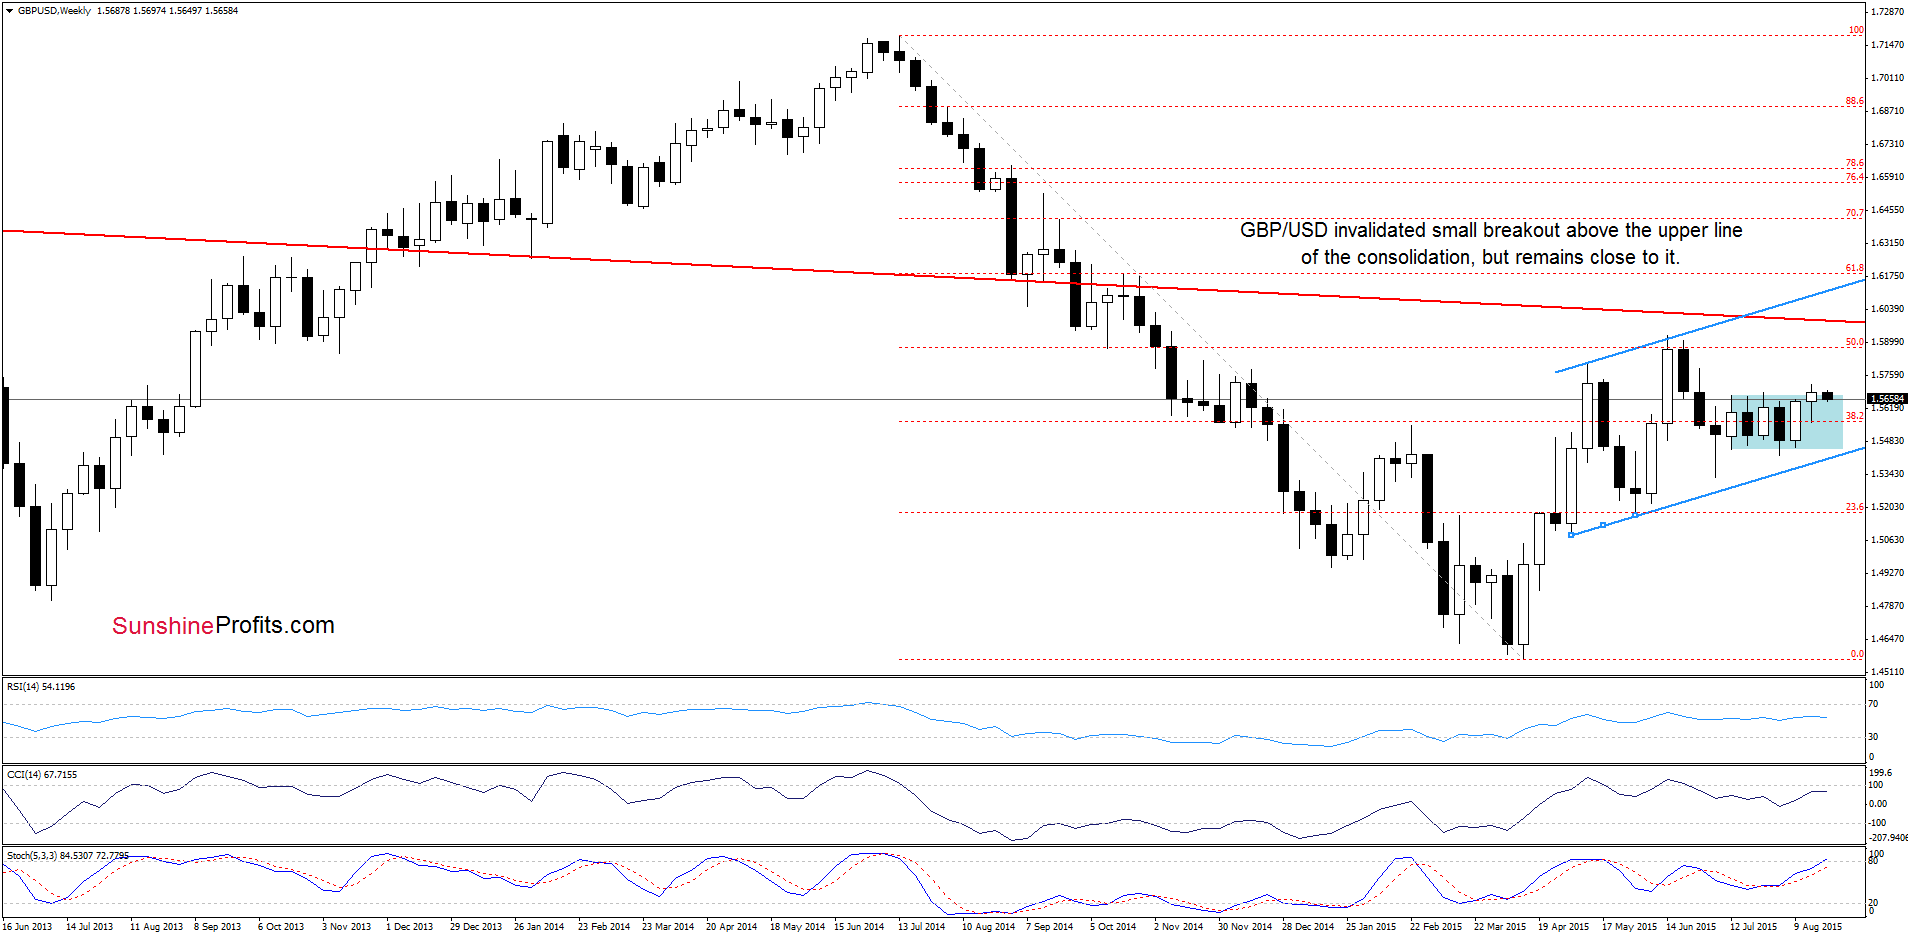
Looking at the weekly chart we see that although GBP/USD closed previous week above the upper border of the consolidation, currency bulls didn’t manage to hold gained levels, which resulted in a pullback. With this move, the exchange rate invalidated earlier small breakout, which suggests that further declines should not surprise us.
Will the very short-term picture confirm the above? Let’s check.
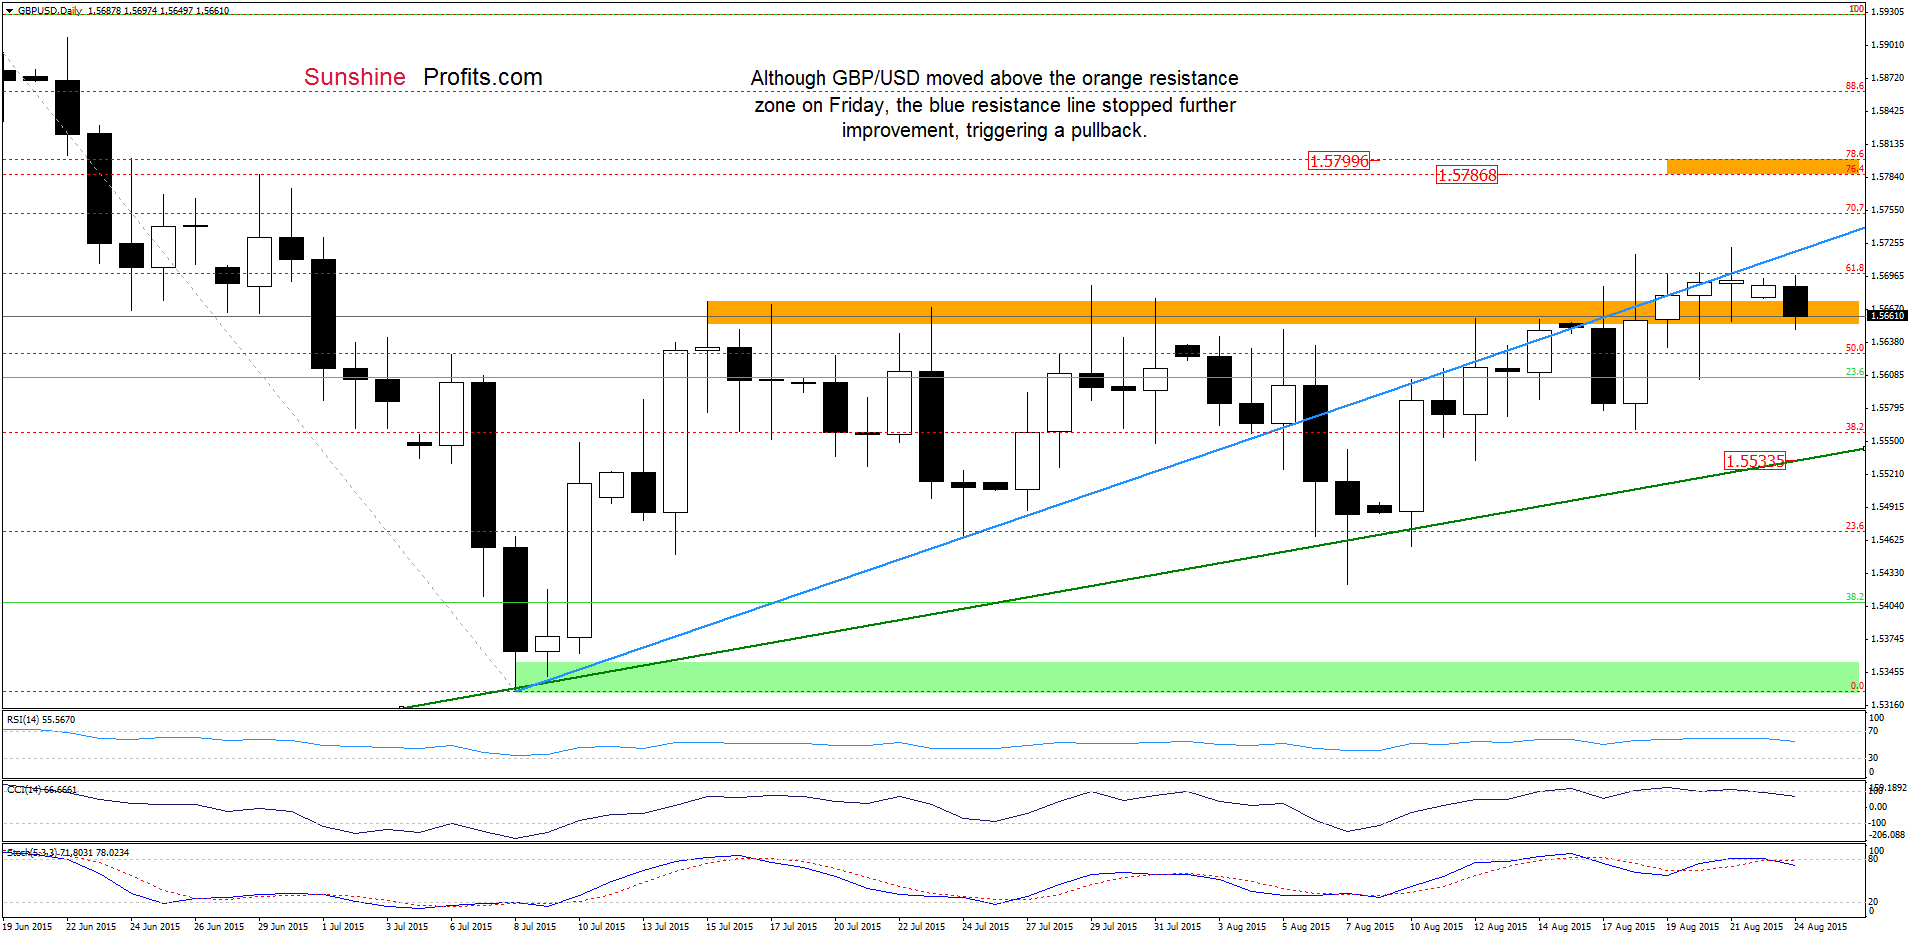
On the daily chart we see that although GBP/USD broke above the orange resistance zone on Friday, the previously-broken blue resistance line stopped further improvement once again, triggering a pullback. This means that our last commentary on this currency pair is up-to-date also today:
(…) it seems that the next move will be to the downside. In this case, the initial target for currency bears would be the green support line (…).
Very short-term outlook: mixed with bearish bias
Short-term outlook: mixed
MT outlook: mixed
LT outlook: mixed
Trading position (short-term; our opinion): No positions are justified from the risk/reward perspective at the moment. We will keep you informed should anything change, or should we see a confirmation/invalidation of the above.
USD/CHF
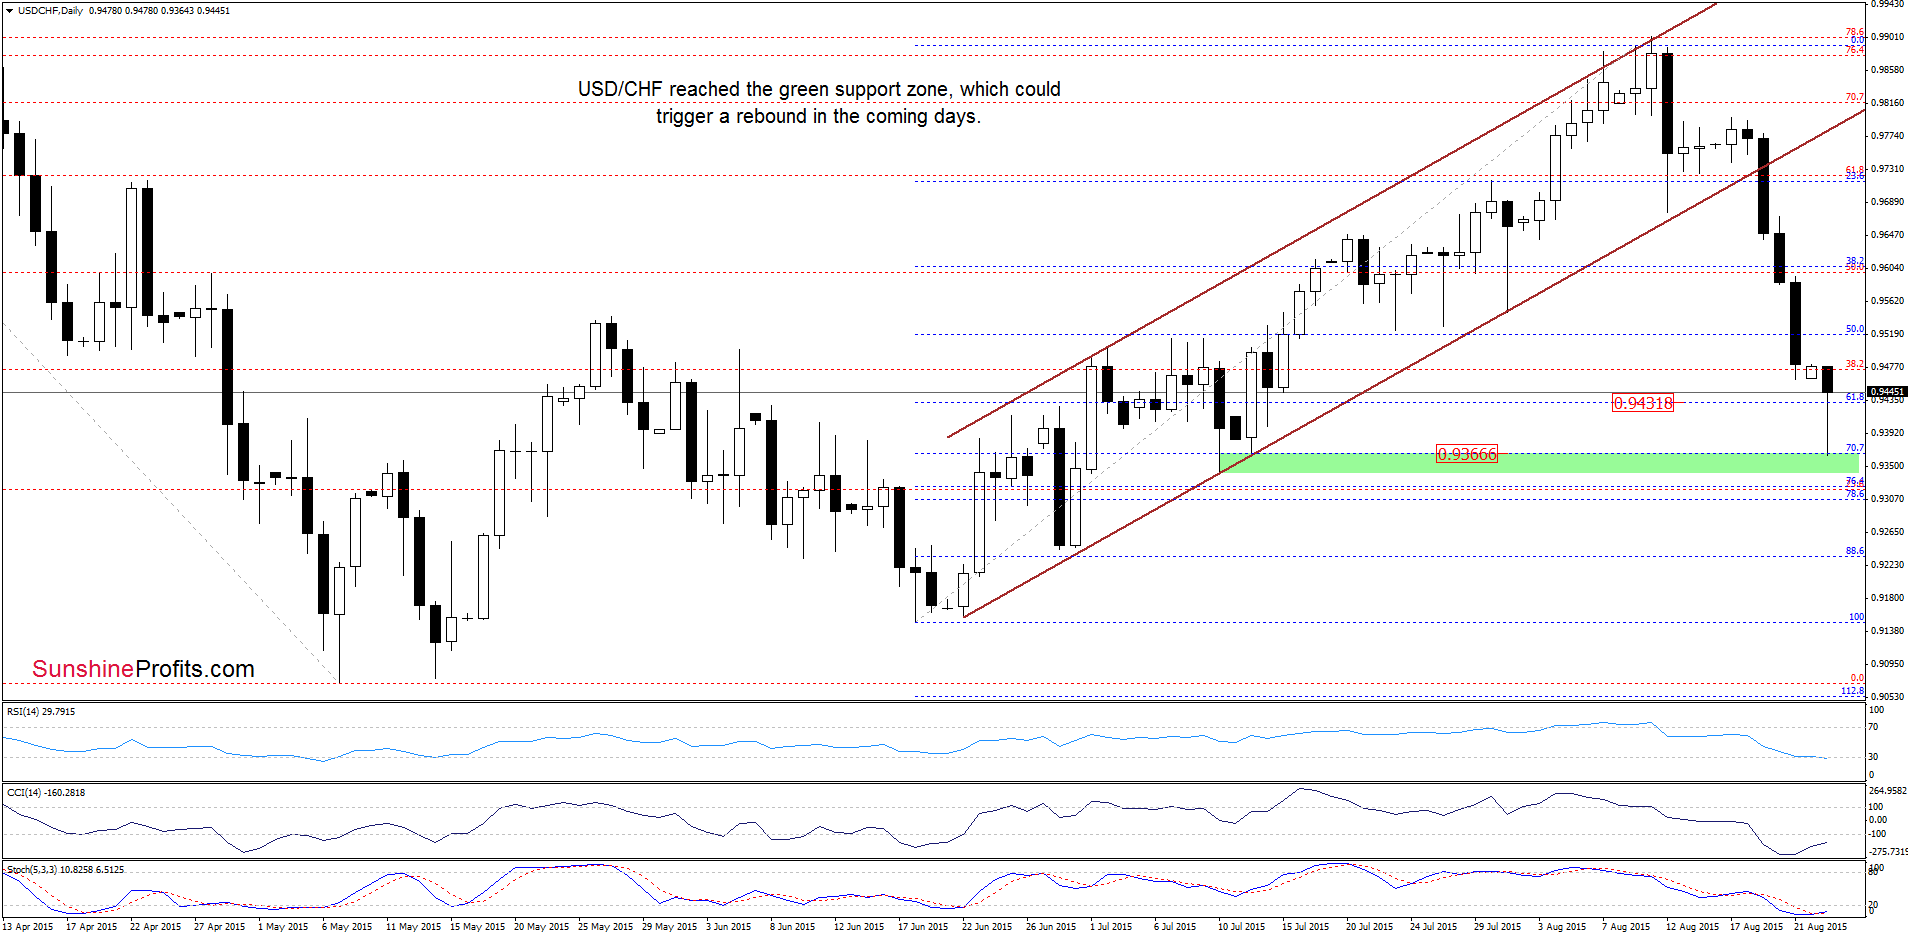
Quoting our last commentary on this currency pair:
(…) What’s next? The medium-term picture and the current position of the indicators still support currency bears, suggesting further deterioration. Therefore, it seems to us that the next downside target would be around 0.9431, where the 61.8% Fibonacci retracement is. If this support is broken, we may see a decline even to 0.9366, where the 70.7% retracement and the Jul 13 low are.
As you see on the daily chart the situation developed in line with the above scenario and USD/CHF reached our downside targets earlier today. With this downswing, the pair reached the green support zone (created by the 70.7% retracement and the Jul 13 low), which suggests that we may see a rebound from here in the coming days – especially when we factor in the current position of the indicators (the RSI declined below the level of 30, while the CCI and Stochastic Oscillator are overbought).
What could happen if this support area is broken? Let’s take a closer look on the weekly chart and find out.
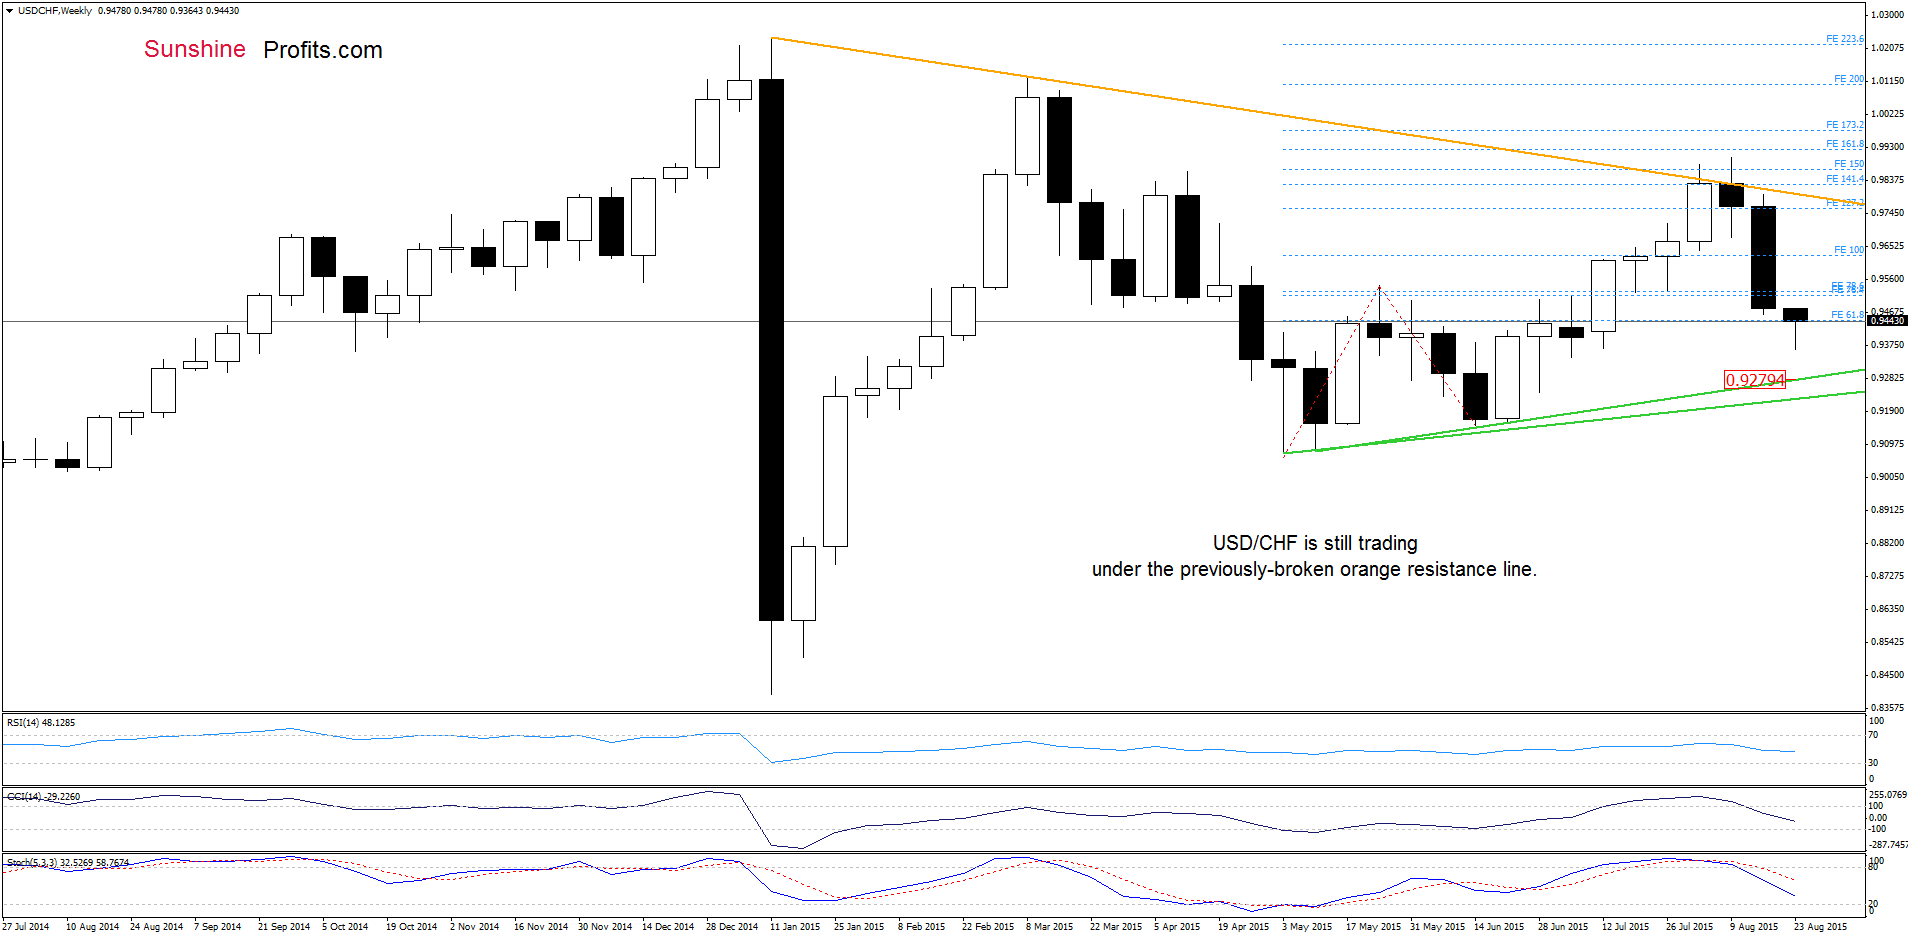
On the weekly chart, we see that USD/CHF is still trading under the previously-broken orange resistance line, which suggests that another attempt to move lower (especially when we factor in the current position of the indicators) is likely. Therefore, if the pair moves lower from here, the next downside target would be around 0.9279, where the upper green support line is.
Very short-term outlook: mixed
Short-term outlook: mixed
MT outlook: mixed
LT outlook: mixed
Trading position (short-term; our opinion): No positions are justified from the risk/reward perspective at the moment. We will keep you informed should anything change, or should we see a confirmation/invalidation of the above.
Thank you.
Nadia Simmons
Forex & Oil Trading Strategist
Przemyslaw Radomski, CFA
Founder, Editor-in-chief
Gold & Silver Trading Alerts
Forex Trading Alerts
Oil Investment Updates
Oil Trading Alerts

