

Yesterday, the USD Index dropped under the level of 96 as Wednesday’s minutes of the Federal Reserve’s latest meeting continued to weigh on investors’ sentiment. Additionally, the U.S. Department of Labor reported that the number of initial jobless claims in the week ending August 15 increased by 4,000, missing analysts’ expectations for a 1,000 drop. Thanks to these circumstances, the greenback extended losses earlier today, approaching the level of 95. What impact did this decline have on our six currency pairs?
In our opinion the following forex trading positions are justified - summary:
EUR/USD
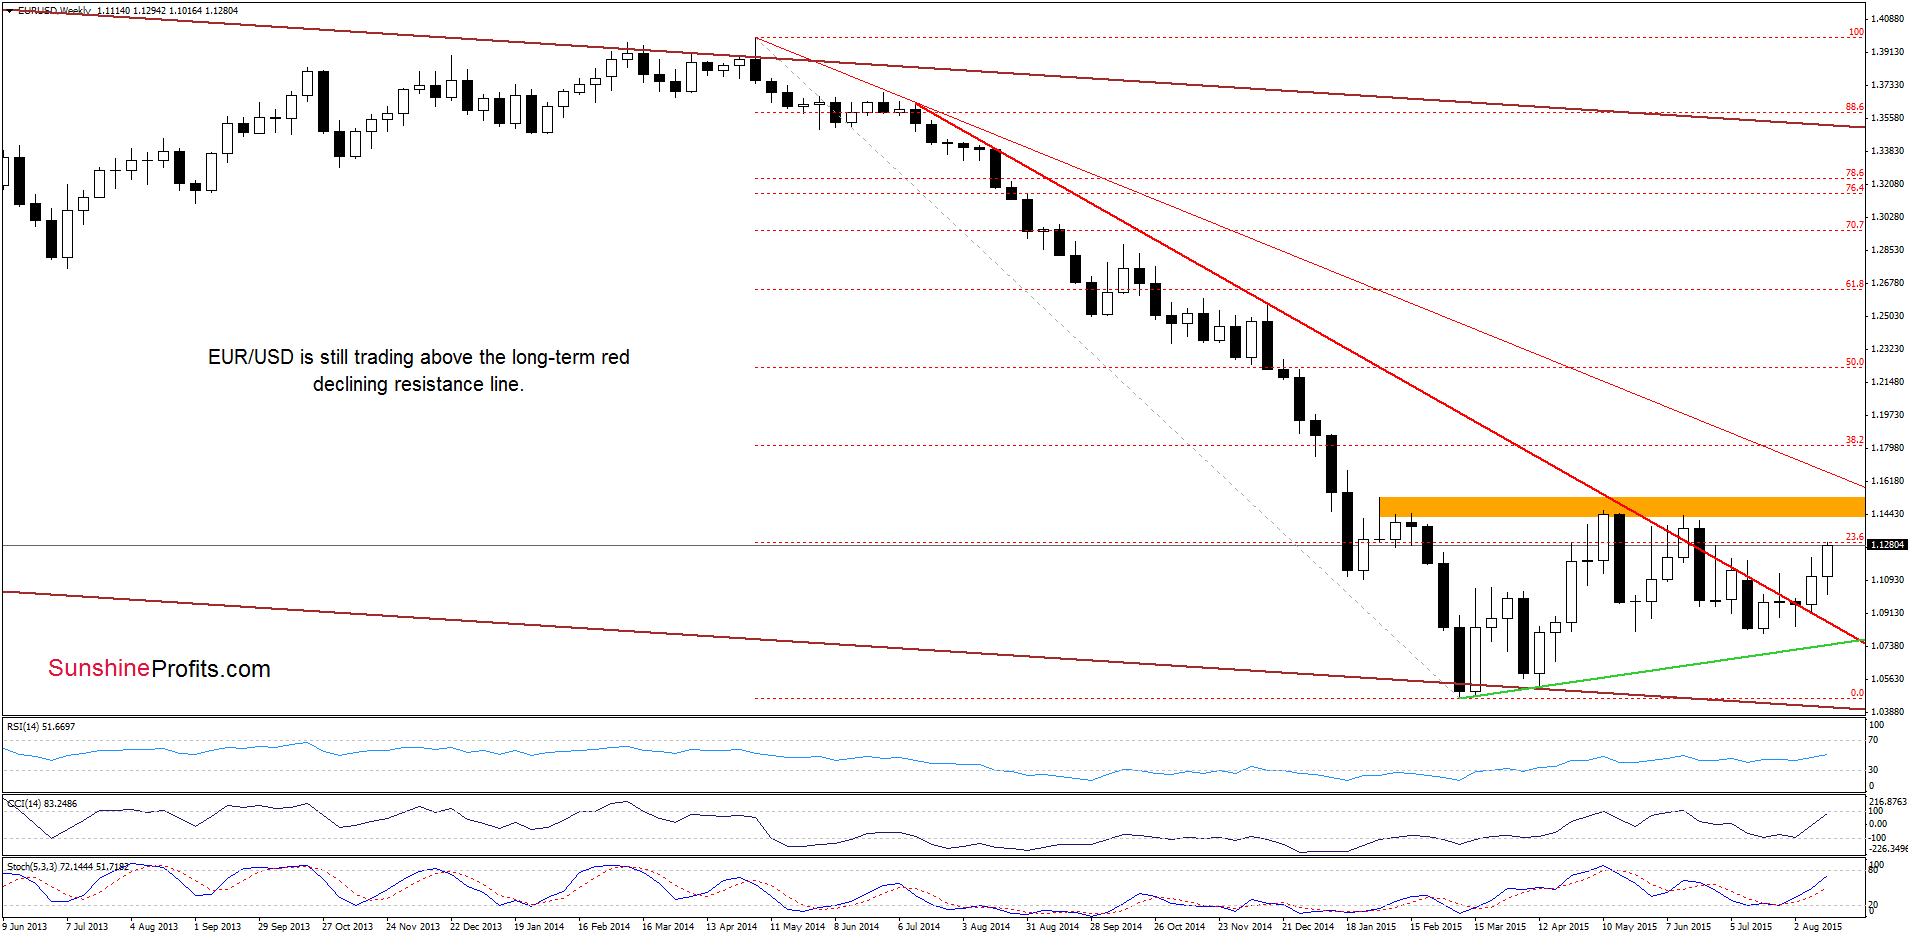
The situation in the medium term has improves as EUR/USD broke above the last week’s high and extended gains above the previously-broken long-term red declining resistance line. Additionally buy signals generated by the indicators remain in place, suggesting further improvement.
How high could the exchange rate go in the coming days?
Quoting our previous Forex Trading Alert:
(…) taking into account the medium-term picture and a buy signal generated b the Stochastic Oscillator it seems that they will try to push the pair higher. If they succeed, the next upside target would be around 1.1250, where the 70.7% Fibonacci retracement is.
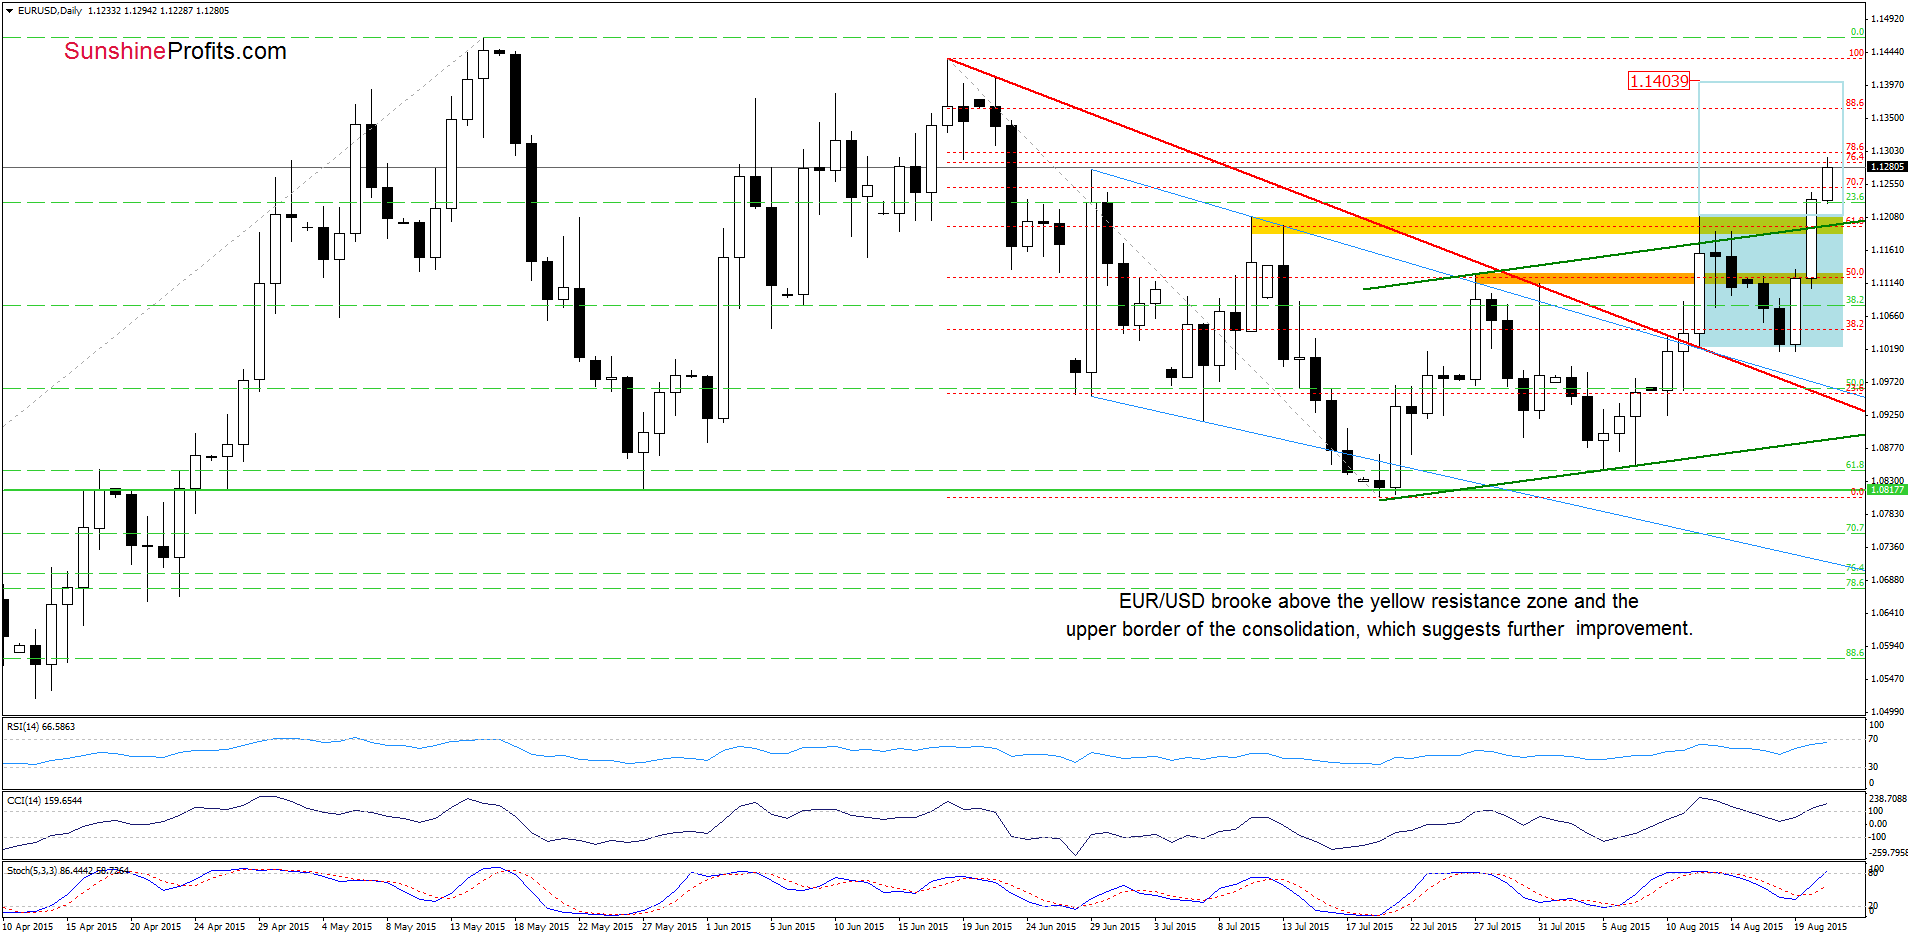
Looking at the daily chart, we see that currency bulls pushed the exchange rate higher as we had expected. Yesterday, EUR/USD closed the day above the yellow resistance zone, the upper border of the green rising trend channel and the upper line of the blue consolidation. This bullish signal triggered further improvement earlier today and the pair broke above our upside target, reaching the resistance area created by the 76.4% and 78.6% Fibonacci retracement levels. What’s next? Taking into account the fact that buy signals generated by the indicators remain in place, we think that the pair will climb to the 88.6% Fibonacci retracement in the coming day(s). Nevertheless, yesterday’s upswing took EUR/USD above the upper border of the consolidation, which suggests that we may see an upward move even to around 1.1403, where the size of the move will correspond to the height of the formation.
Very short-term outlook: bullish
Short-term outlook: mixed
MT outlook: mixed
LT outlook: mixed
Trading position (short-term; our opinion): No positions are justified from the risk/reward perspective at the moment. We will keep you informed should anything change, or should we see a confirmation/invalidation of the above.
GBP/USD
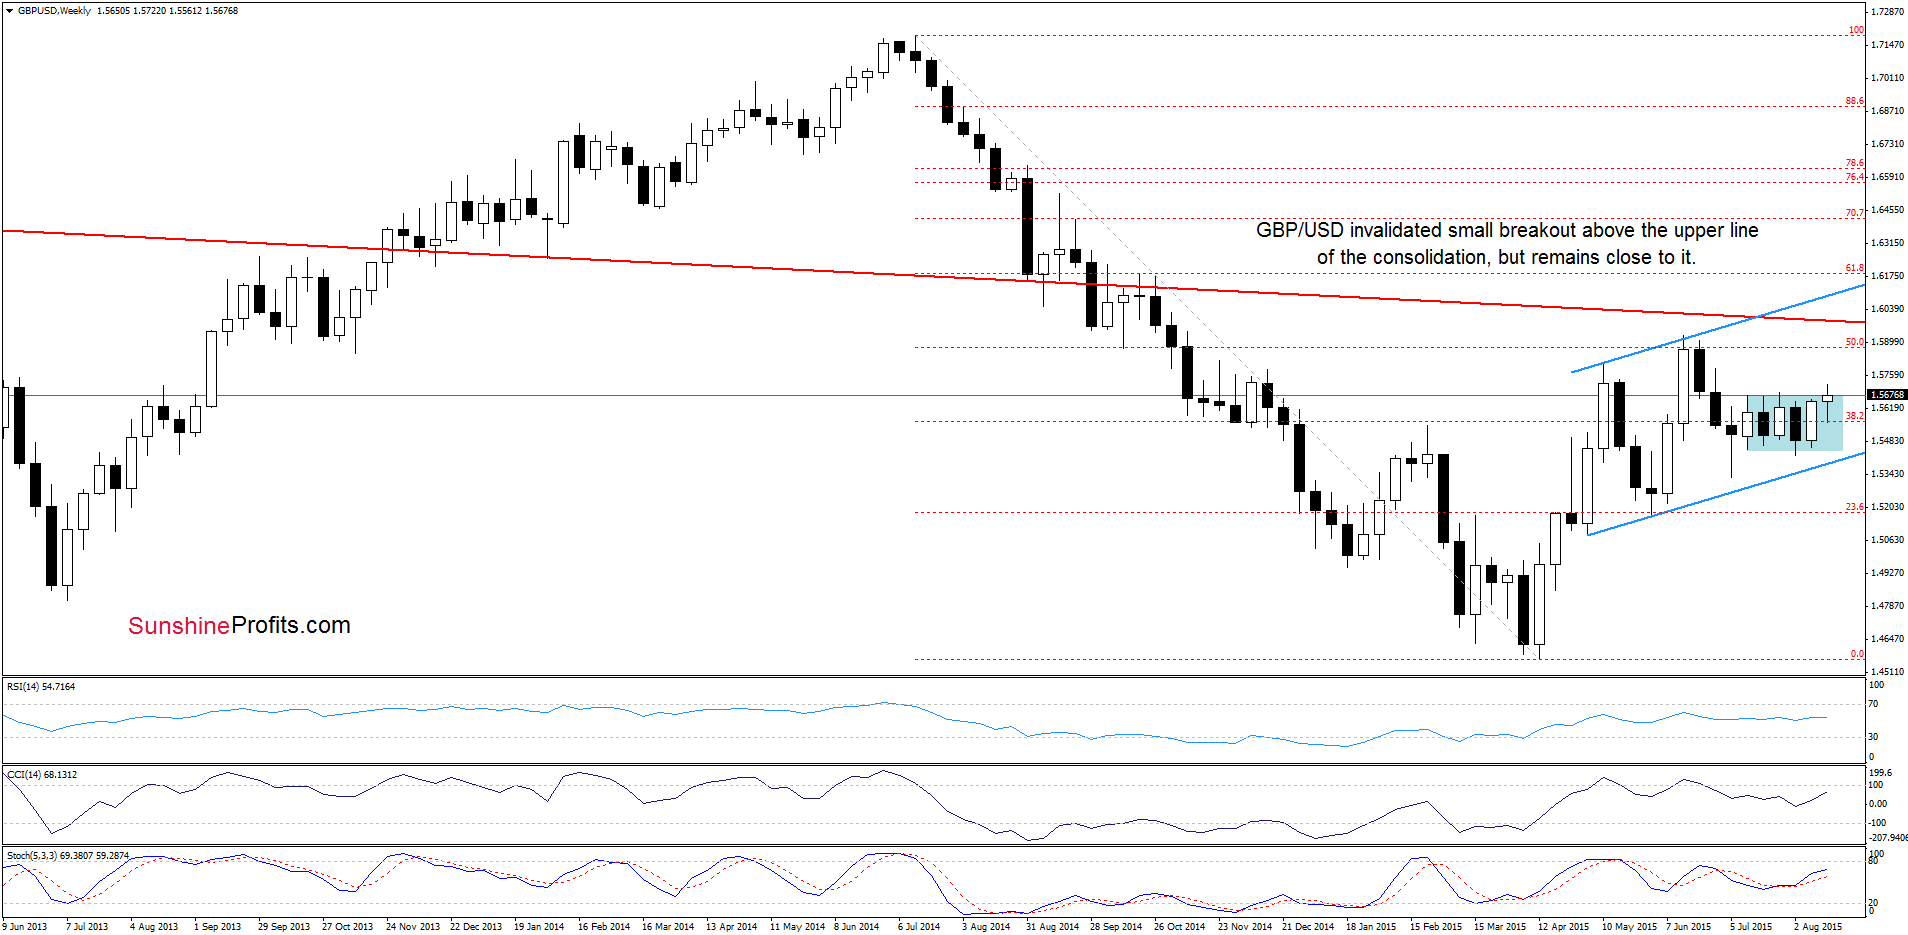
The first thing that catches the eye on the weekly chart is an invalidation of earlier small breakout above the upper border of the consolidation. Despite this negative signal the exchange rate is still trading very close to the above-mentioned line.
Will we see another attempt to move higher? Let’s examine the daily chart and find out.
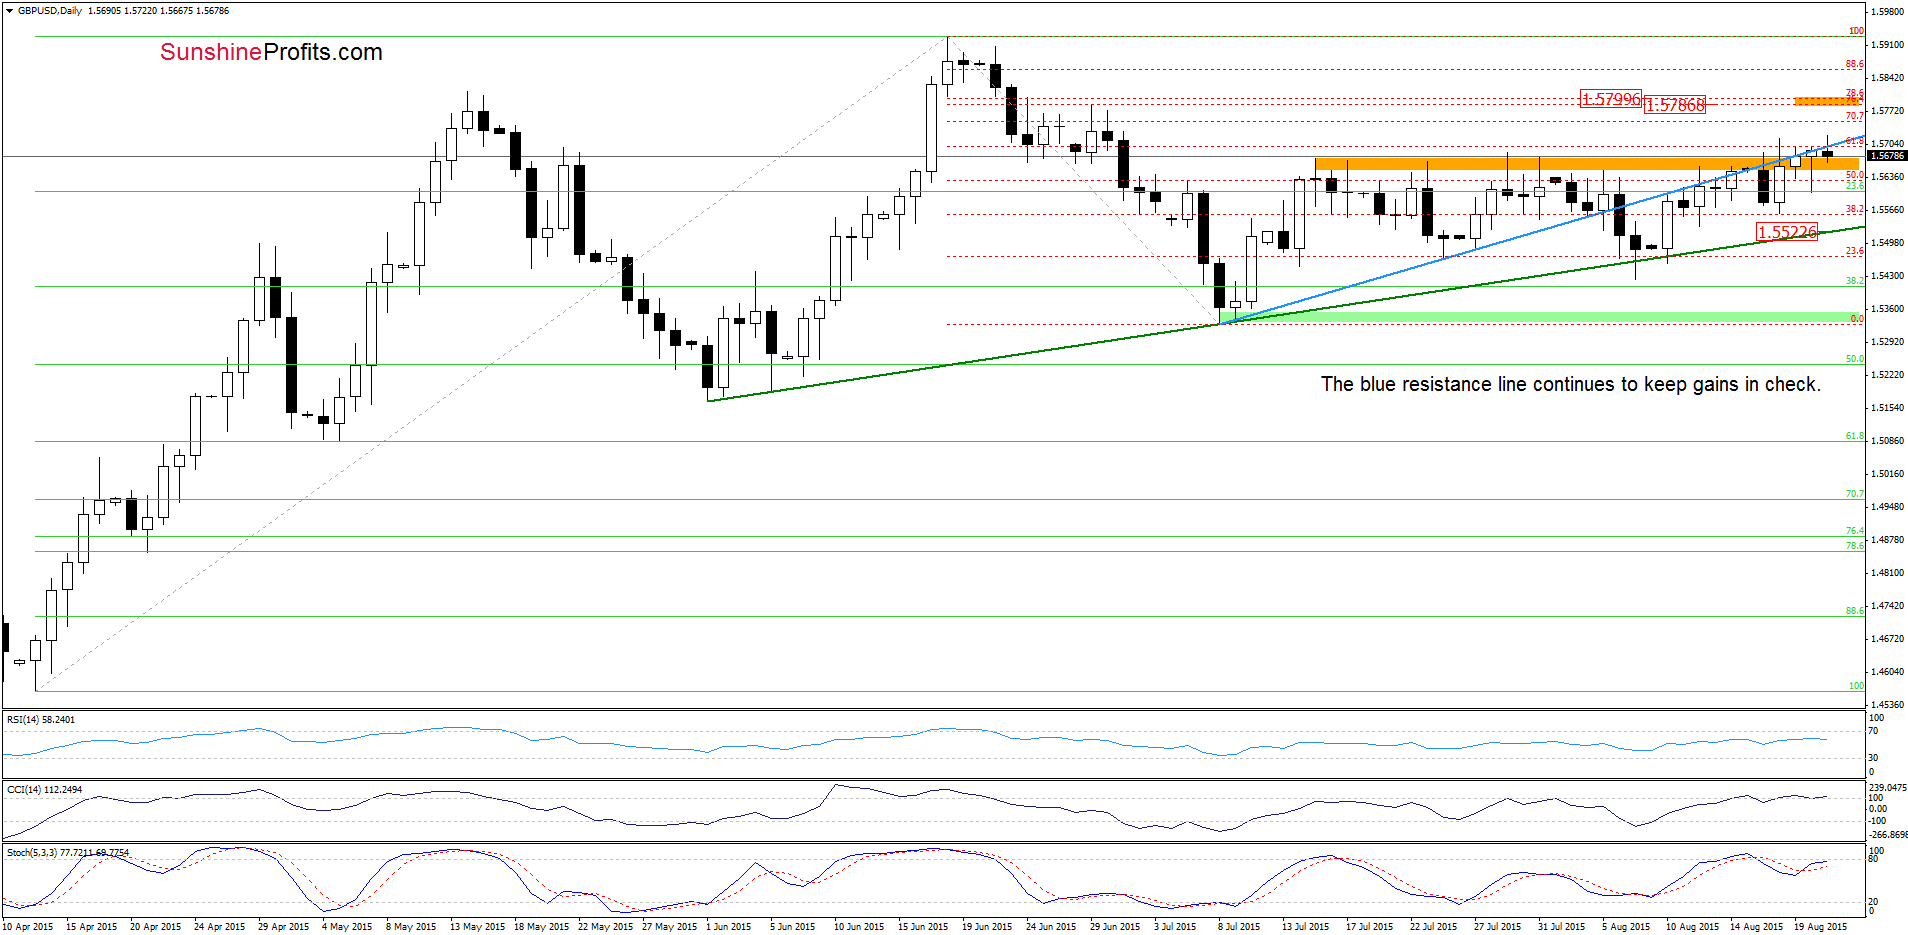
On the daily chart we see that GBP/USD is still trading slightly below the previously-broken blue resistance line, which continues to keep gains in check. Therefore, our last commentary on this currency pair is up-to-date also today:
(…) it seems that the next move will be to the downside. In this case, the initial target for currency bears would be the green support line (…). Nevertheless, if the pair manages to close the day above these resistance levels, it would be a bullish signal, which could trigger a rally to the next orange resistance zone around 1.5786-1.5800 (the 76.4% and 78.6% Fibonacci retracement levels based on the Jun-Jul decline).
Very short-term outlook: mixed with bearish bias
Short-term outlook: mixed
MT outlook: mixed
LT outlook: mixed
Trading position (short-term; our opinion): No positions are justified from the risk/reward perspective at the moment. We will keep you informed should anything change, or should we see a confirmation/invalidation of the above.
USD/JPY
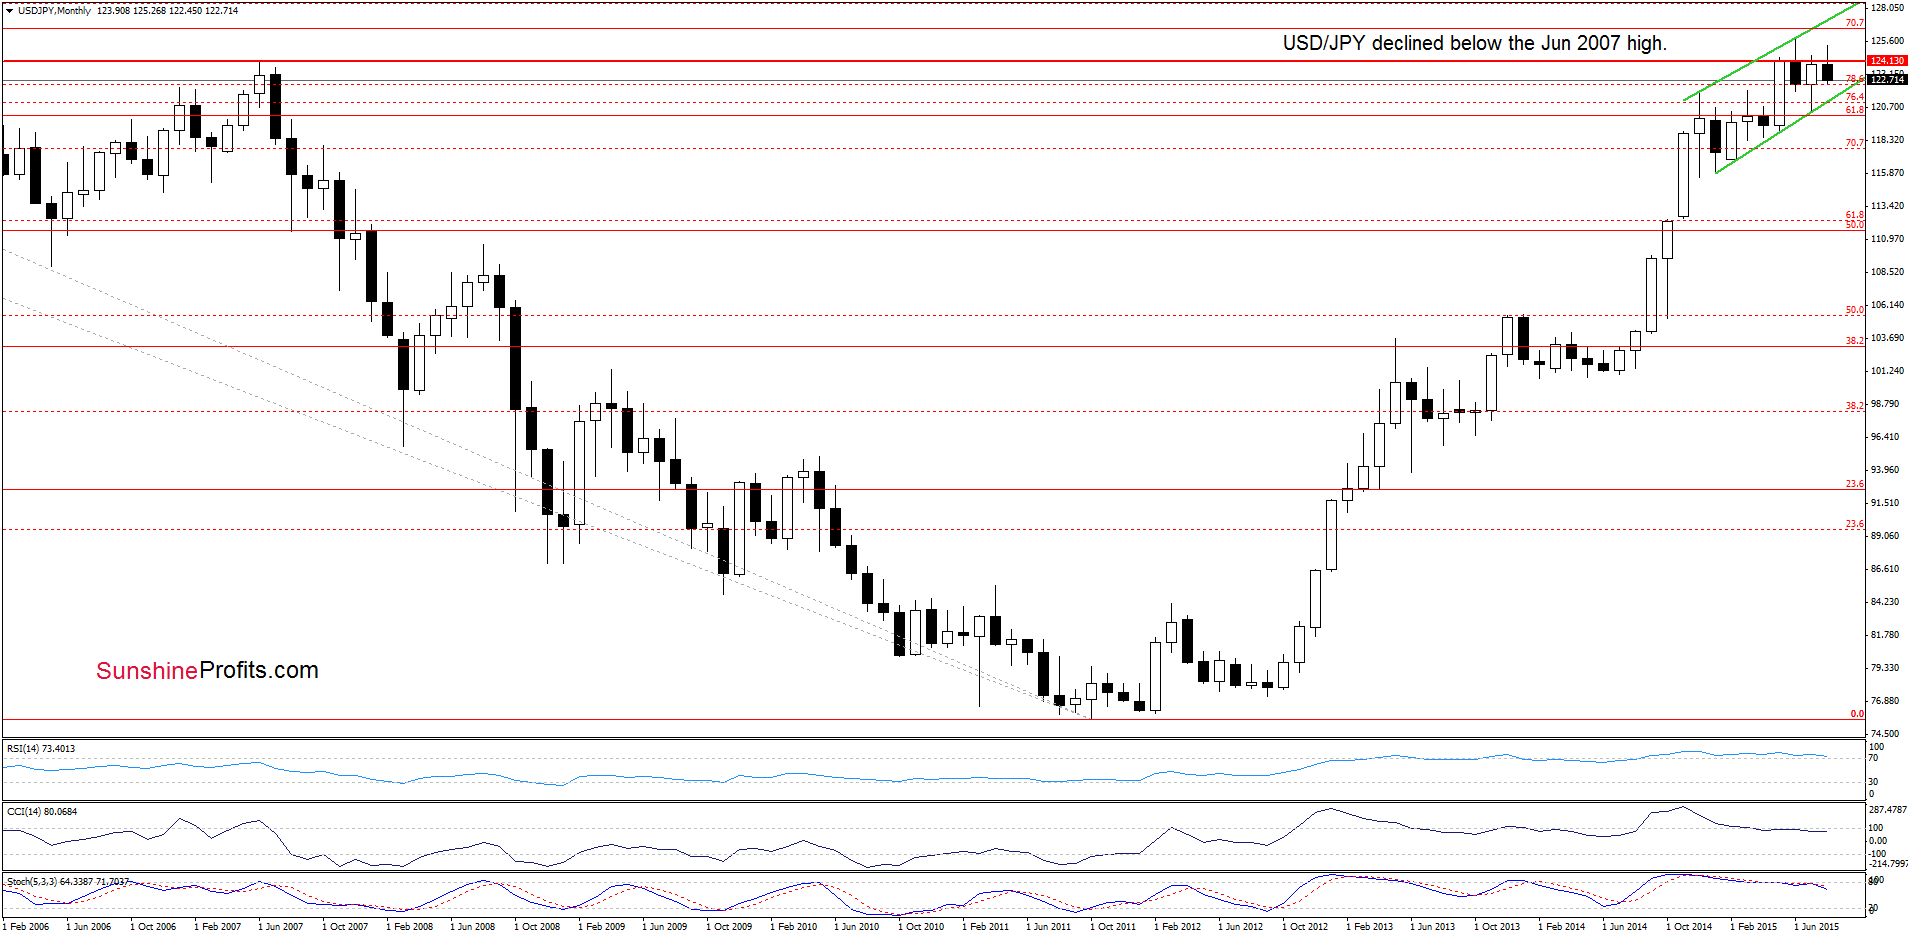
The medium-term picture has deteriorated as USD/JPY extended losses and moved away from the June 2007.
What impact did this drop have on the very short-term picture? Let’s check.
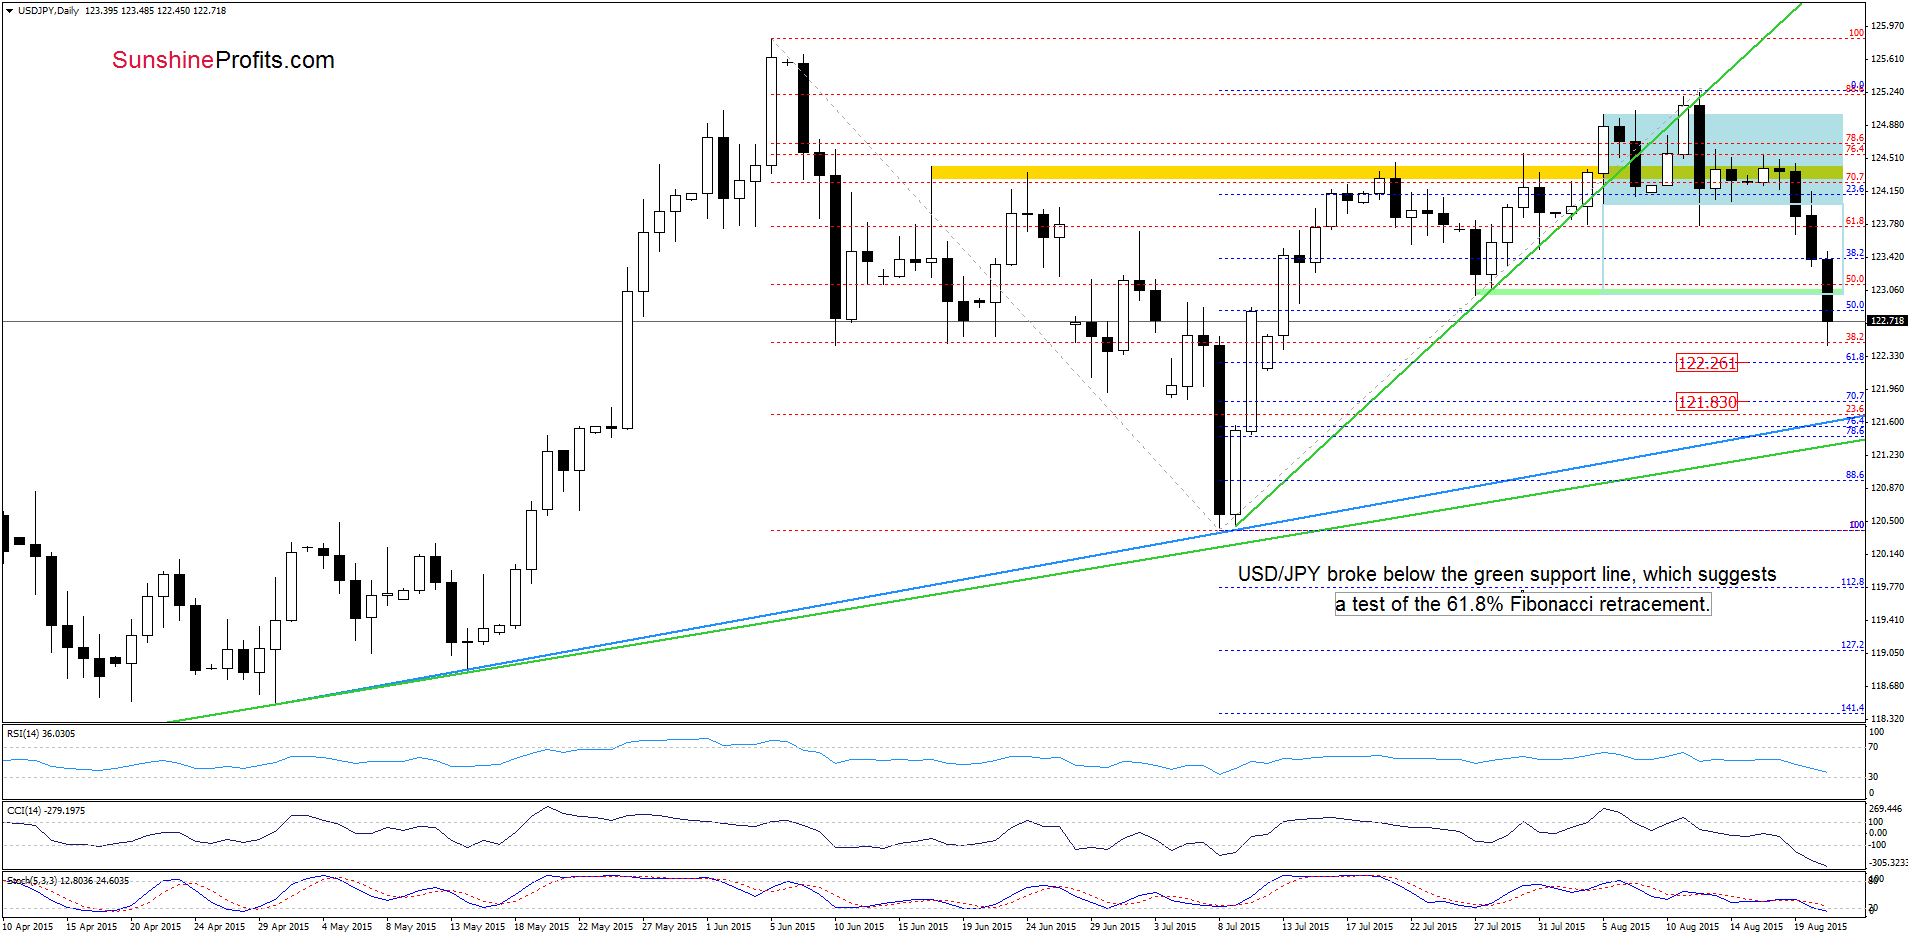
In our last commentary on this currency pair, we wrote the following:
(…) If currency bears win, and we see a successful drop not only below the lower line of the consolidation, but also under the June 2007 high (124-124.13), the initial downside target would be around 123.41, where the 38.2% Fibonacci retracement (based on the Jul-Aug rally) is.
(…) if this support is broken, we may see a decline even to around 123, where the size of the downward move will correspond to the height of the formation and where the green support zone is.
From today’s point of view we see that currency bears not only took the pair to our downside targets, but also managed to break under the green support zone. Earlier today, this negative signal triggered further deterioration, which suggests a test of the 61.8% Fibonacci retracement or even a drop to around 121.83, where the next Fibonacci support level is.
Very short-term outlook: bearish
Short-term outlook: mixed
MT outlook: mixed
LT outlook: mixed
Trading position (short-term; our opinion): No positions are justified from the risk/reward perspective at the moment. We will keep you informed should anything change, or should we see a confirmation/invalidation of the above.
USD/CAD
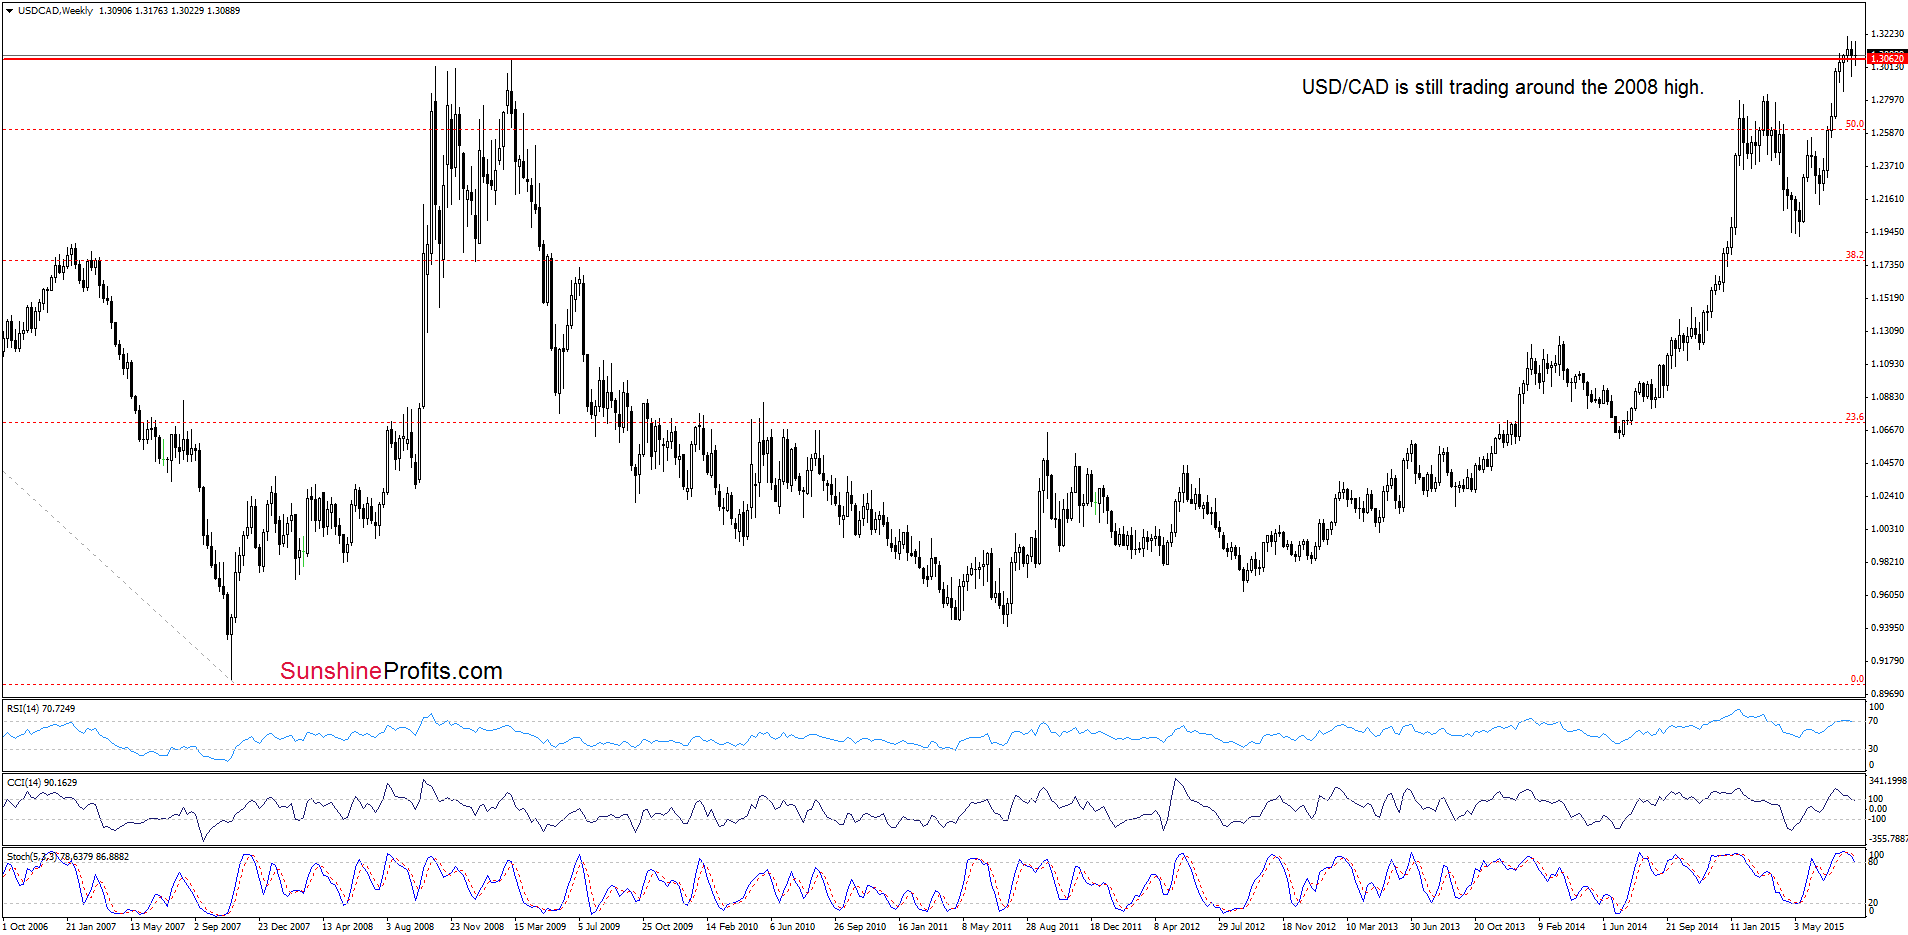
The medium-term picture hasn’t changed much as USD/CAD is still trading around the 2008 high.
Will we receive more clues about future moves examining a very short-term picture? Let’s check.
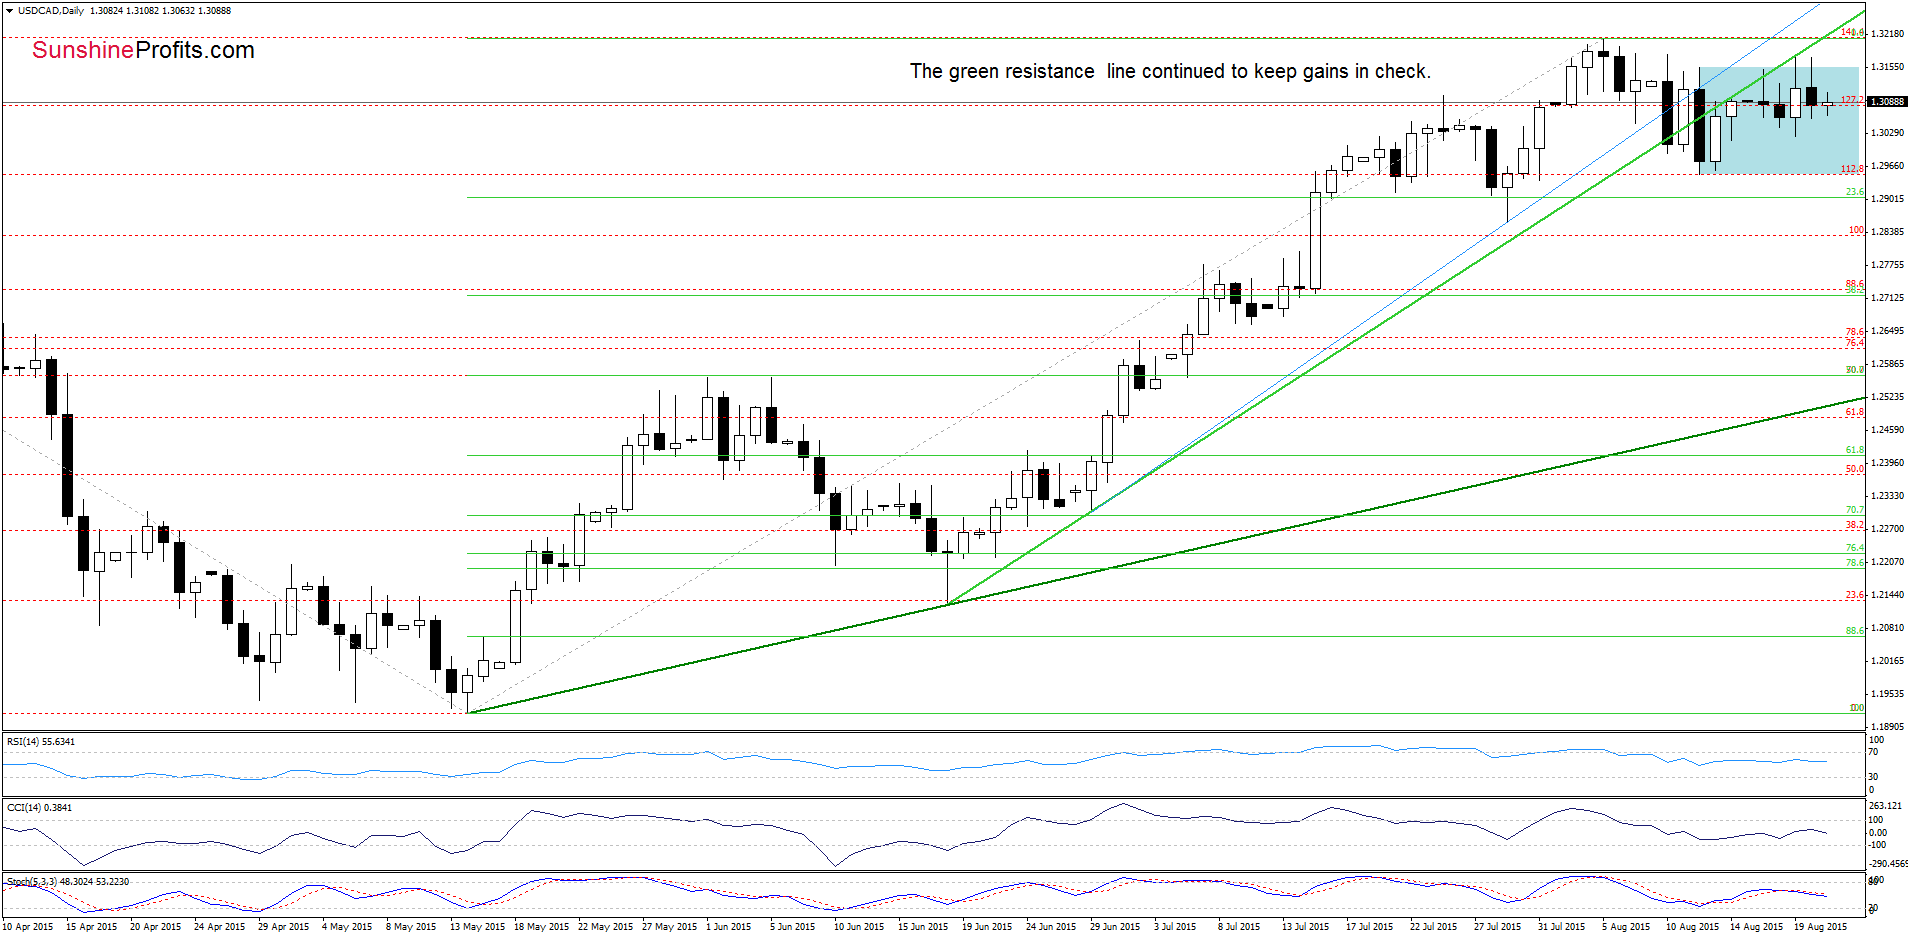
On the daily chart, we see that although USD/CAD climbed to the previously-broken green line yesterday, currency bulls didn’t manage to push the pair higher. Therefore, we still believe that as long as there is no invalidation of the breakdown below this key resistance, further improvement is questionable. Nevertheless, taking into account the current position of the indicators, we think that currency bulls will try to push the pair higher once again in the coming day(s).
Very short-term outlook: mixed
Short-term outlook: mixed
MT outlook: mixed with bearish bias
LT outlook: mixed
Trading position (short-term; our opinion): No positions are justified from the risk/reward perspective at the moment. We will keep you informed should anything change, or should we see a confirmation/invalidation of the above.
USD/CHF
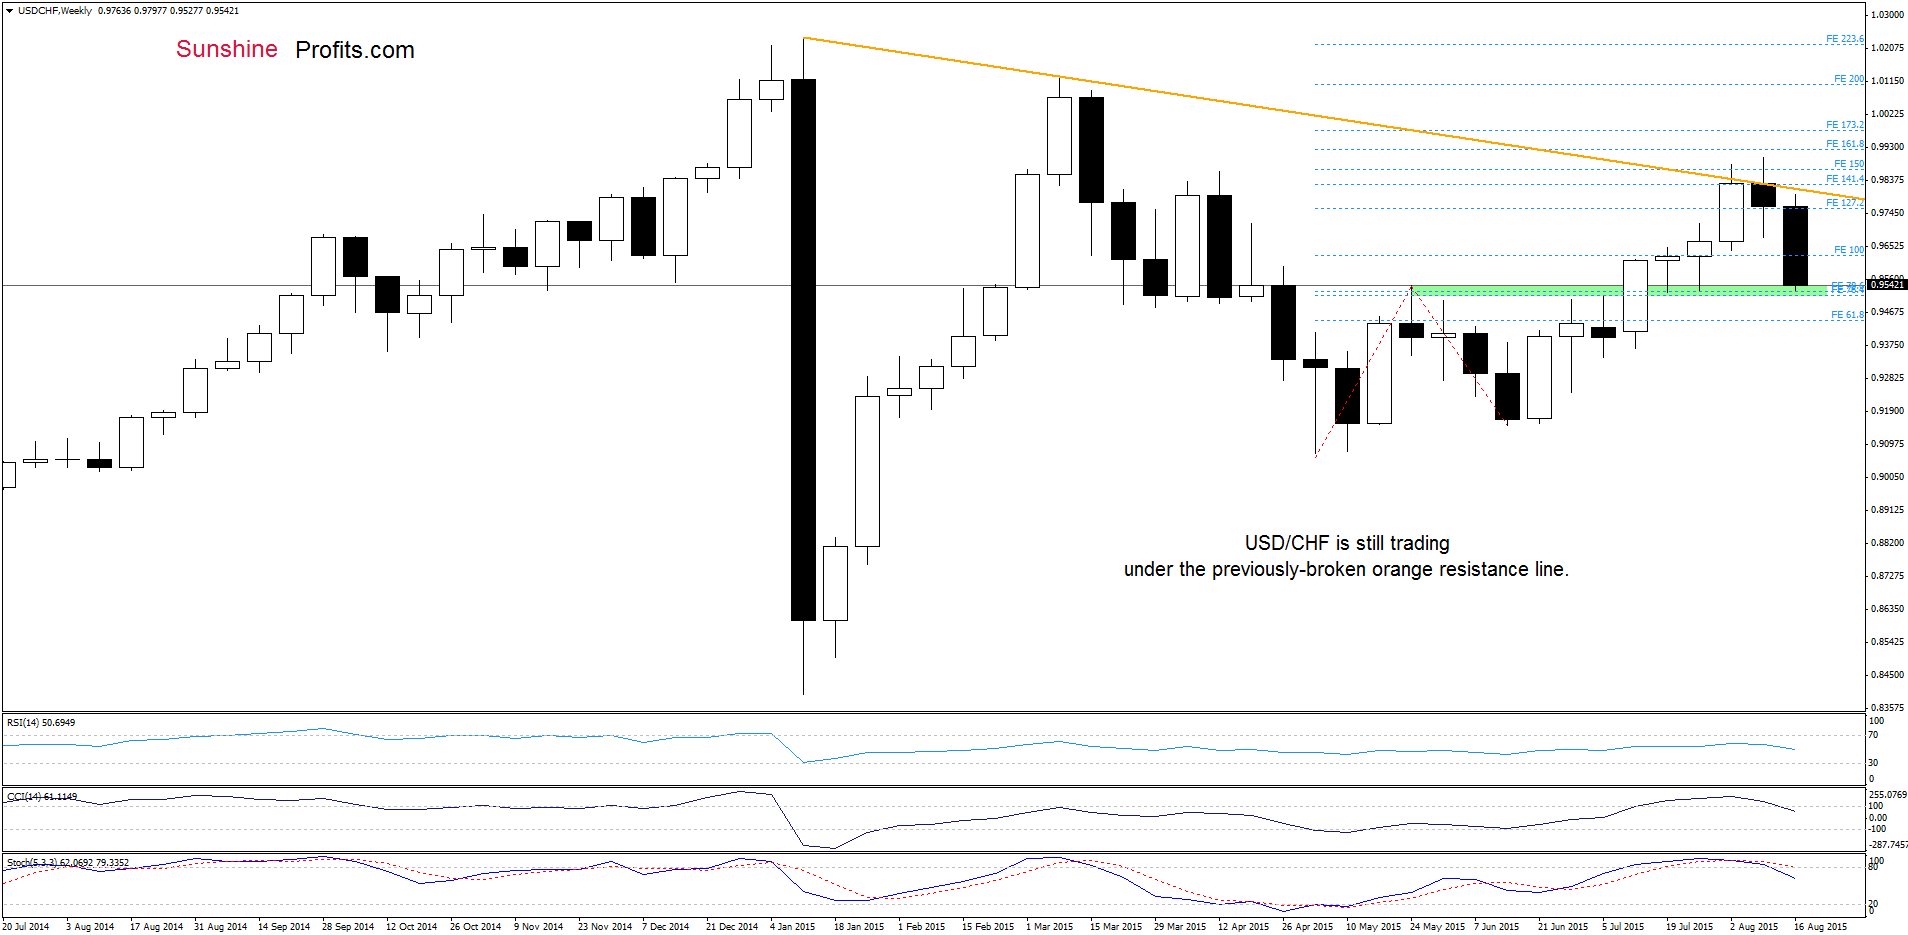
On the weekly chart, we see that USD/CHF is still trading under the previously-broken orange resistance line, which means that an invalidation of the breakout above it and its negative impact on the exchange rate is still in effect, suggesting another attempt to move lower (especially when we factor in the current position of the indicators).
How low could the pair go? Let’s examine the daily chart and find out.
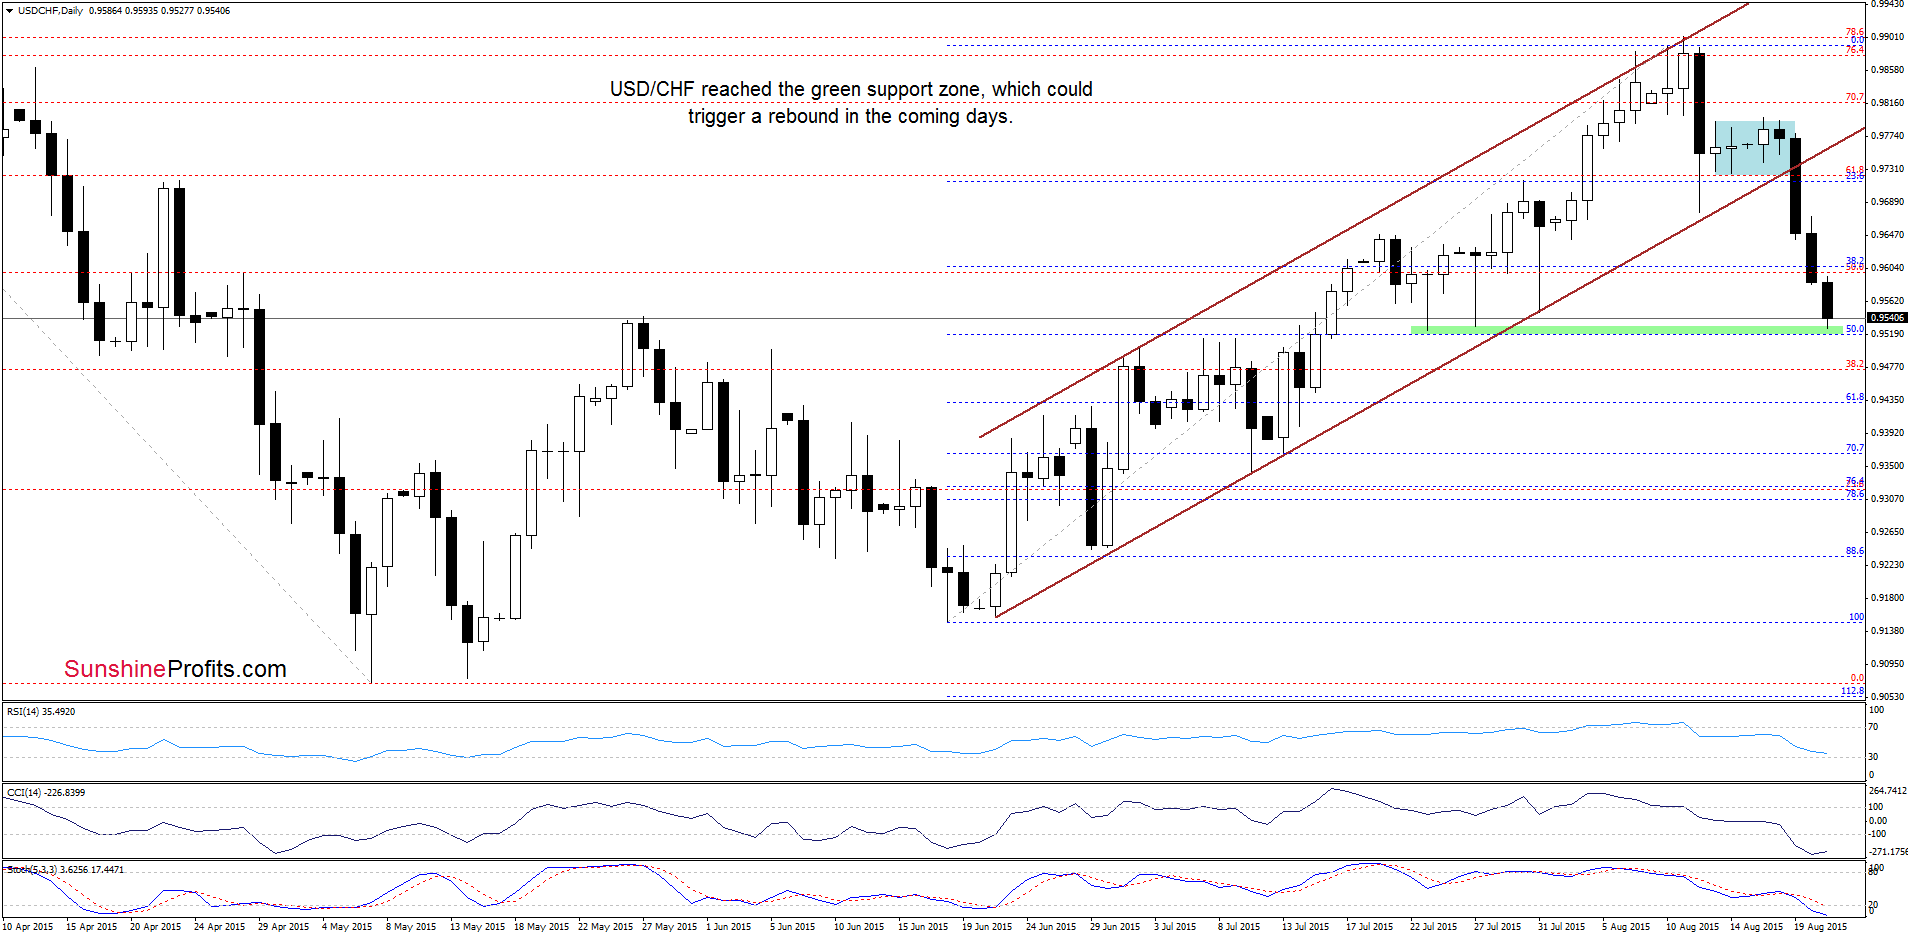
Quoting our last commentary on this currency pair:
(…) Earlier today, the pair extended losses, approaching the 38.2% Fibonacci retracement. Although this support could encourage currency bulls to act, it seems to us that the long- and medium-term pictures in combination with sell signals generated by the daily indicators will trigger further deterioration. If this is the case, and USD/CHF drops under the Fibonacci support, we’ll likely see a decline to around 0.9524-0.9530, where the Jul 23, Jul 27 lows and the 50% Fibonacci retracement are.
As you see on the daily chart, the situation developed in line with the above scenario and USD/CHF reached our downside target. What’s next? The medium-term picture and the current position of the indicators still support currency bears, suggesting further deterioration. Therefore, it seems to us that the next downside target would be around 0.9431, where the 61.8% Fibonacci retracement is. If this support is broken, we may see a decline even to 0.9366, where the 70.7% retracement and the Jul 13 low are.
Very short-term outlook: bearish
Short-term outlook: mixed with bearish bias
MT outlook: mixed
LT outlook: mixed
Trading position (short-term; our opinion): No positions are justified from the risk/reward perspective at the moment. We will keep you informed should anything change, or should we see a confirmation/invalidation of the above.
AUD/USD
The situation in the medium term hasn’t changed much as AUD/USD remains between the 70.7% Fibonacci retracement (which serves as resistance) and the green support zone (based on the 76.4% and 78.6% Fibonacci retracement levels).
Will the very short-term chart give us more clues about future moves? Let’s check.
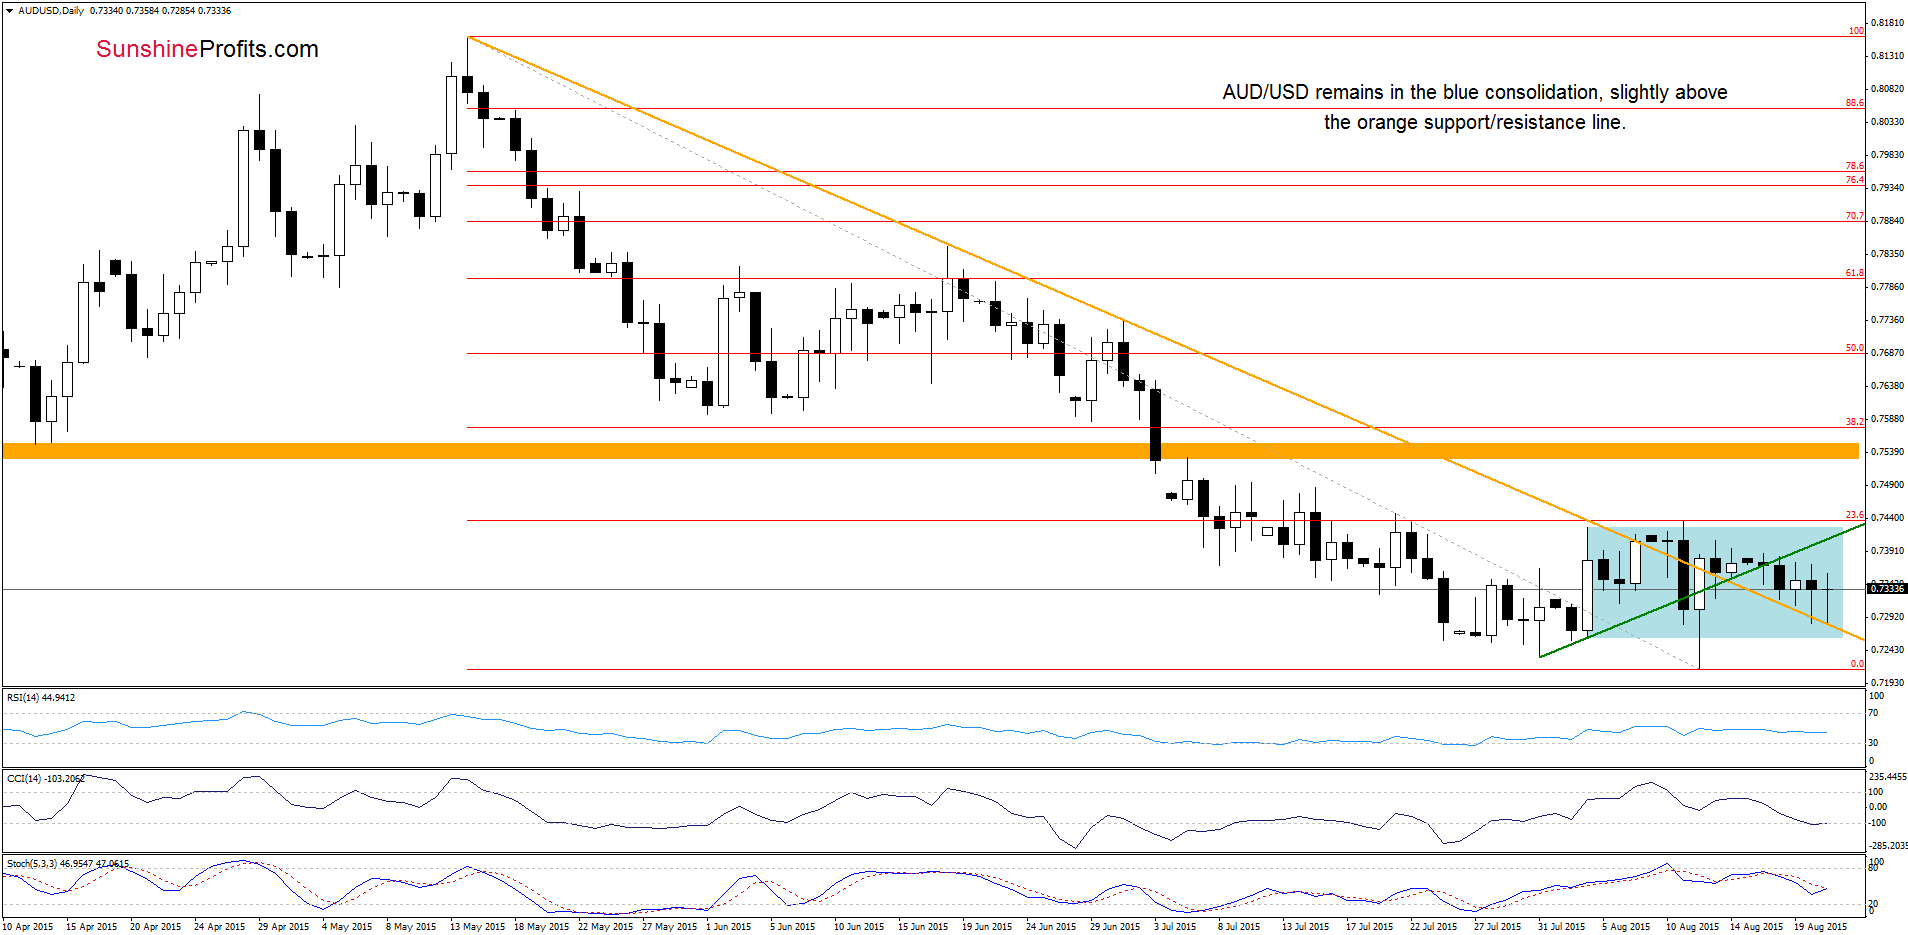
From today’s point of view we see that although AUD/USD moved lower in recent days, the overall situation hasn’t changed much as the exchange rate is still trading in the blue consolidation, slightly above the previously-broken orange support/resistance line. Therefore, as long as there is no daily close above the upper line of the formation or under the orange line, further rally or sizable decline is not likely to be seen.
Very short-term outlook: mixed
Short-term outlook: mixed
MT outlook: mixed
LT outlook: mixed
Trading position (short-term; our opinion): No positions are justified from the risk/reward perspective at the moment. We will keep you informed should anything change, or should we see a confirmation/invalidation of the above.
Thank you.
Nadia Simmons
Forex & Oil Trading Strategist
Przemyslaw Radomski, CFA
Founder, Editor-in-chief
Gold & Silver Trading Alerts
Forex Trading Alerts
Oil Investment Updates
Oil Trading Alerts

