

Earlier today, the U.S. Bureau of Labor Statistics showed that unit labor costs increased more than expected in the second quarter, while non-farm productivity rose by 1.3%, missing expectations for a gain of 1.6%. Thanks to these numbers, the USD Index moved lower and slipped below 97. What impact did this move have on our six currency pairs?
In our opinion the following forex trading positions are justified - summary:
EUR/USD
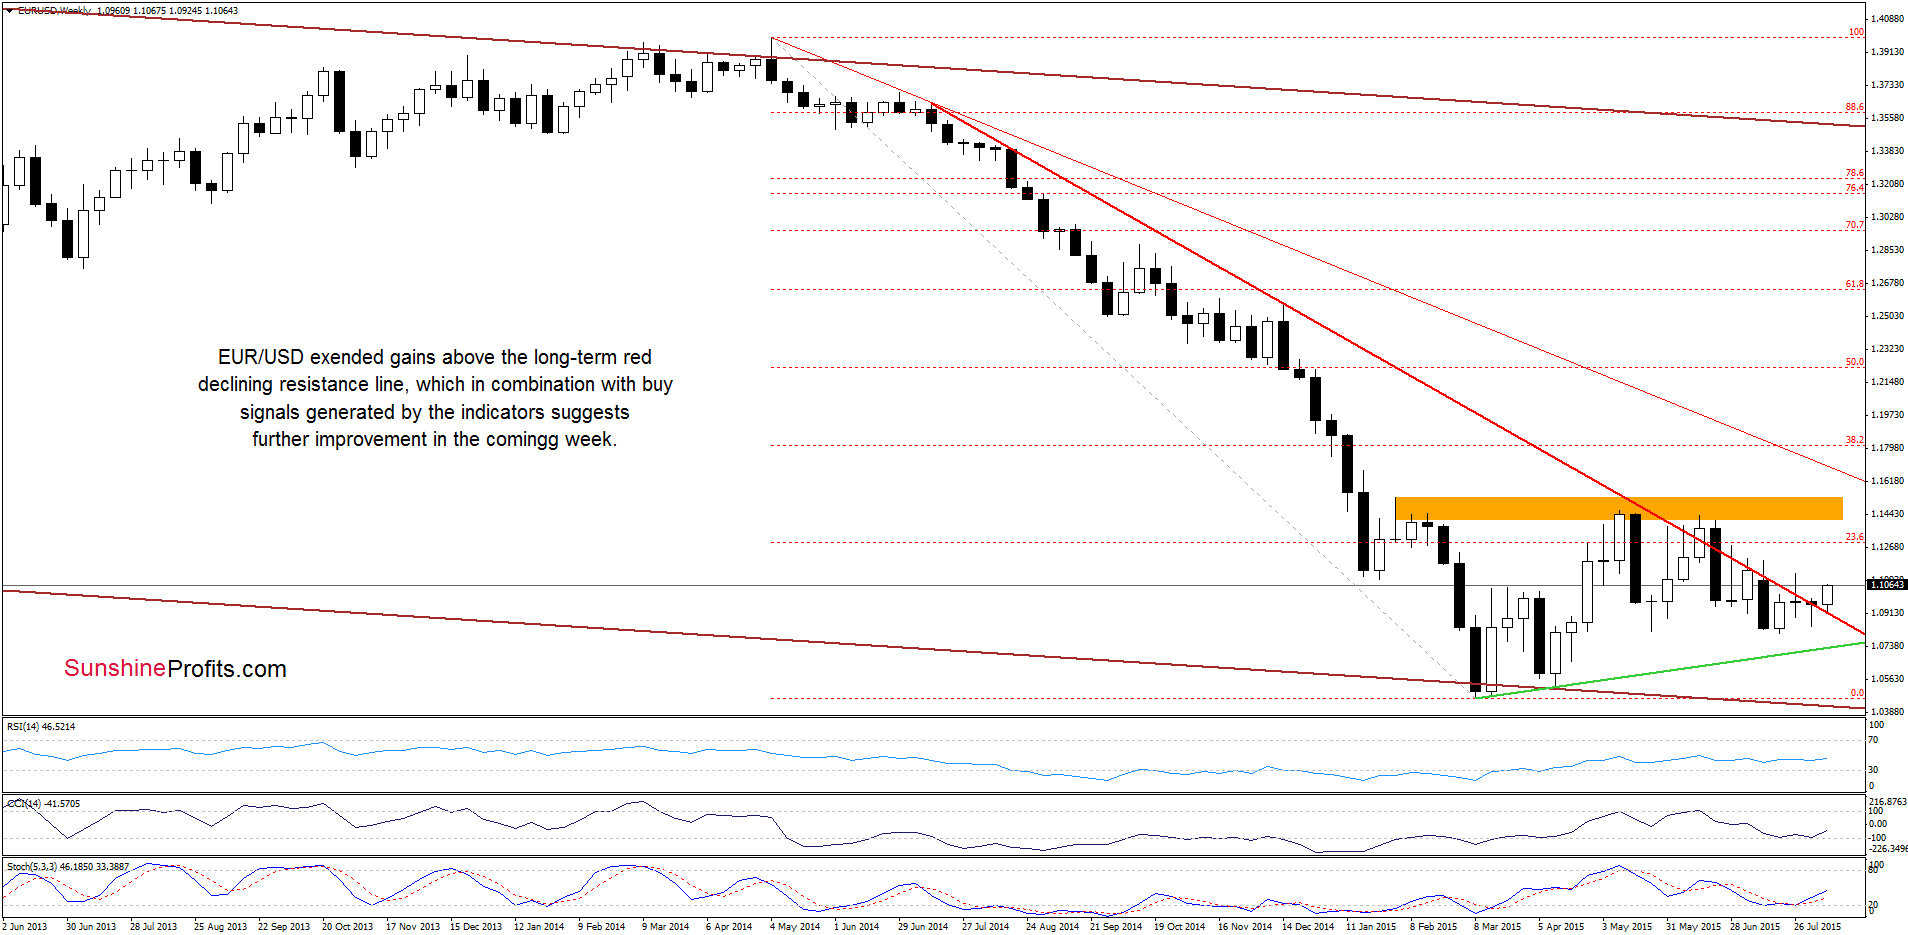
Looking at the weekly chart, we see that EUR/USD extended gains above the previously-broken long-term red declining resistance line, which is a positive signal that suggests further improvement – especially when we factor in buy signals generated by the indicators.
What can we infer from the very short-term picture? Let’s take a closer look at the daily chart and find out.
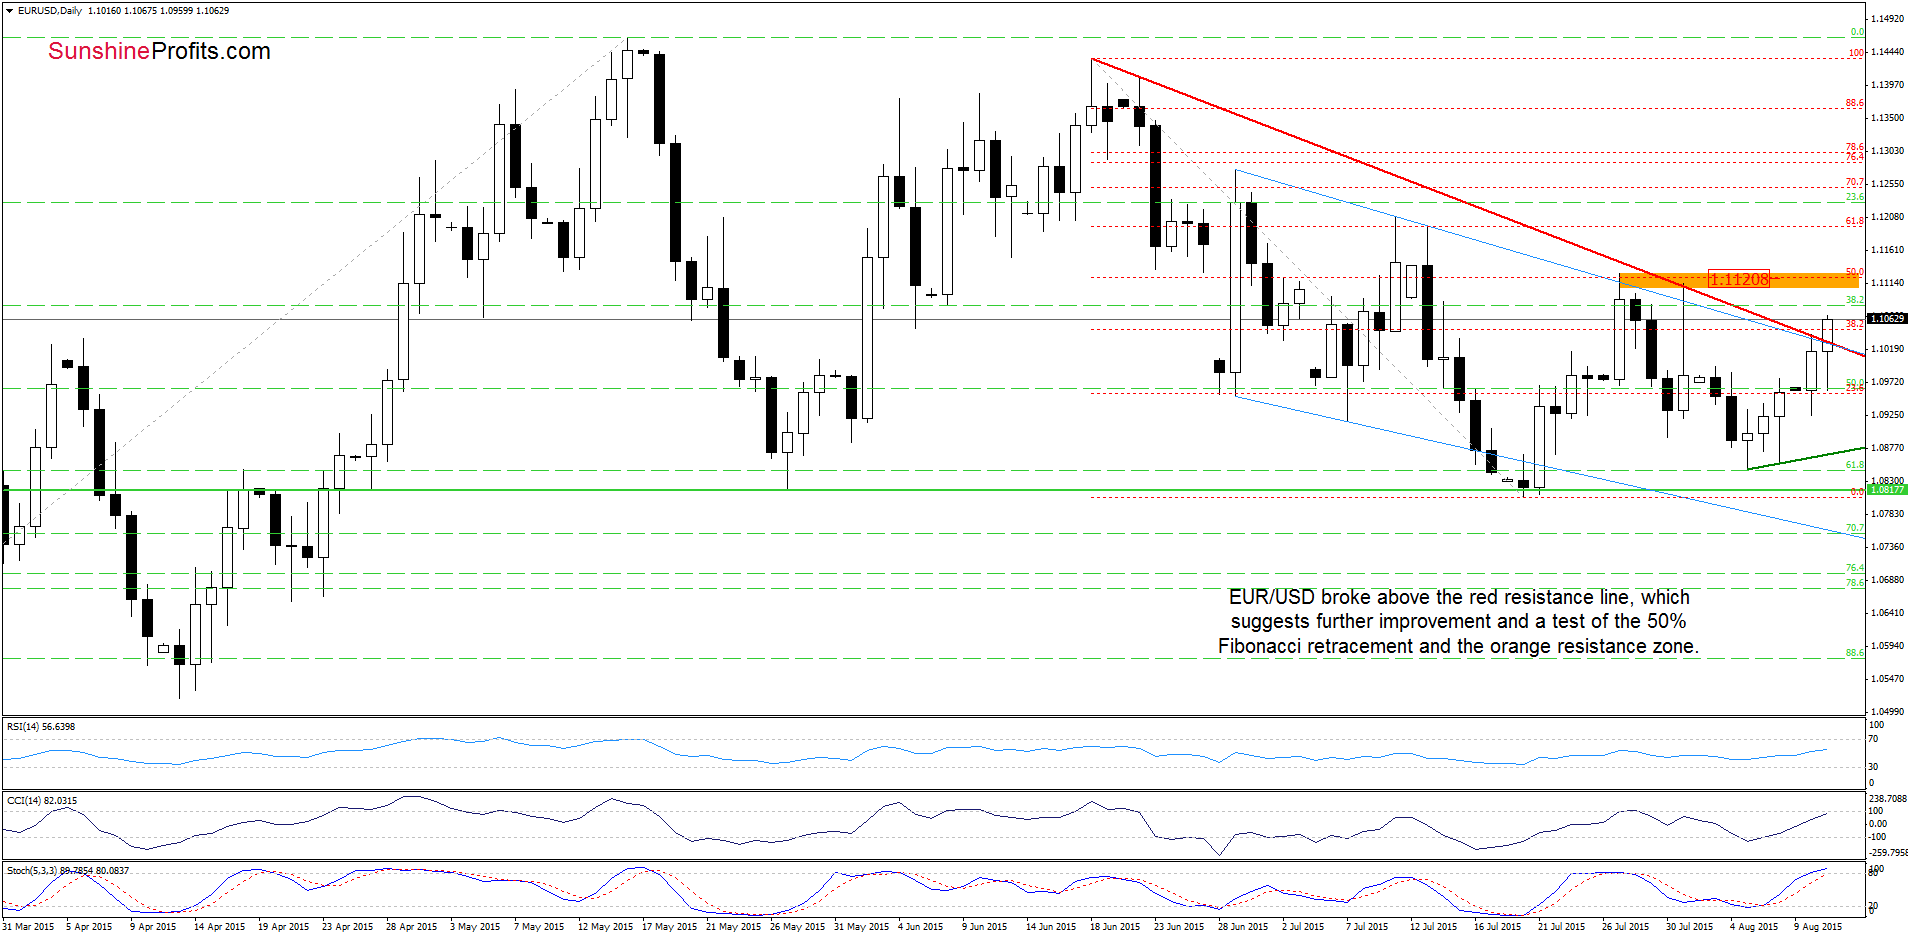
Yesterday, we wrote:
(…) the CCI and Stochastic Oscillator generated buy signals, which suggests that currency bulls will likely try to push the exchange rate above this resistance in the coming days. If this is the case, and they succeed, the next upside target would be around 1.1113-1.1128, where the Jul 27, Jul 31 highs and the 50% Fibonacci retracement (based on the Jun-Jul decline) are.
From today’s point of view we see that the situation developed in line with the above scenario and EUR/USD broke above the red declining resistance line earlier today. Taking this fact into account, and combining it with the current position of the indicators, it seems that upside targets from yesterday’s commentary will be in play in the coming day(s).
Very short-term outlook: bullish
Short-term outlook: mixed
MT outlook: mixed
LT outlook: mixed
Trading position (short-term; our opinion): No positions are justified from the risk/reward perspective at the moment. We will keep you informed should anything change, or should we see a confirmation/invalidation of the above.
GBP/USD
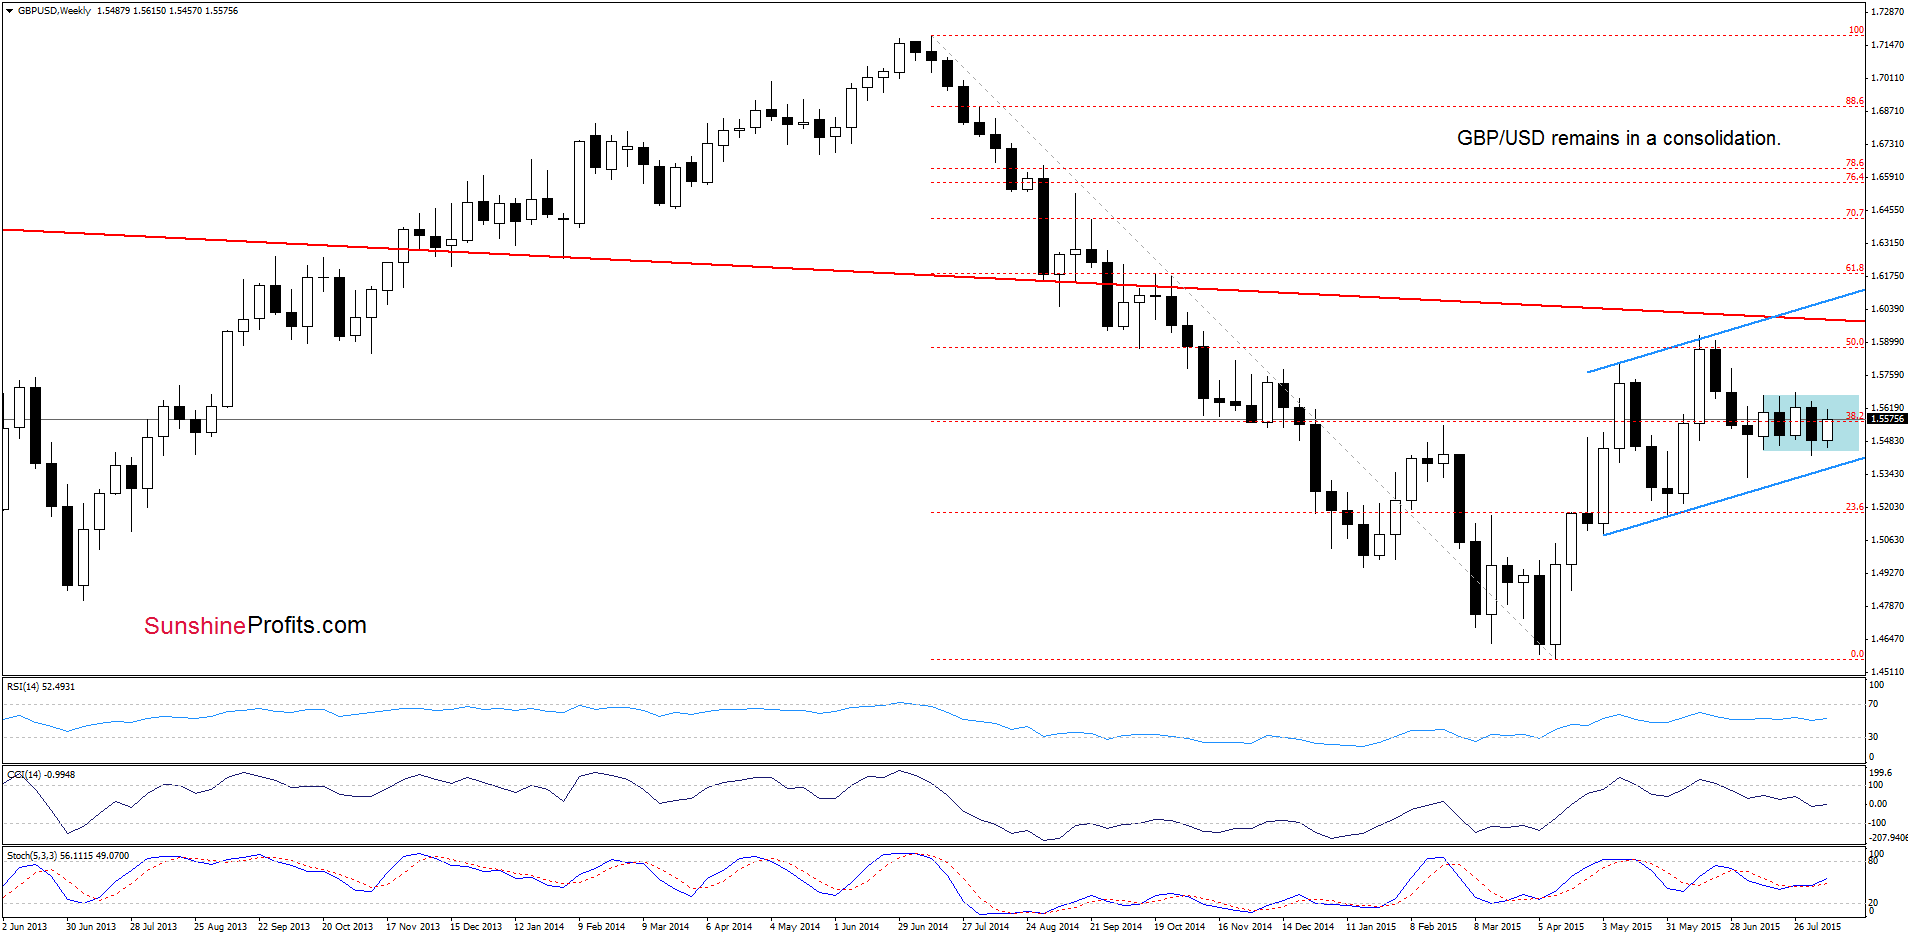
The situation in the medium term remains almost unchanged as GBP/USD is trading in the blue consolidation. Today, we’ll focus on the very short-term picture.
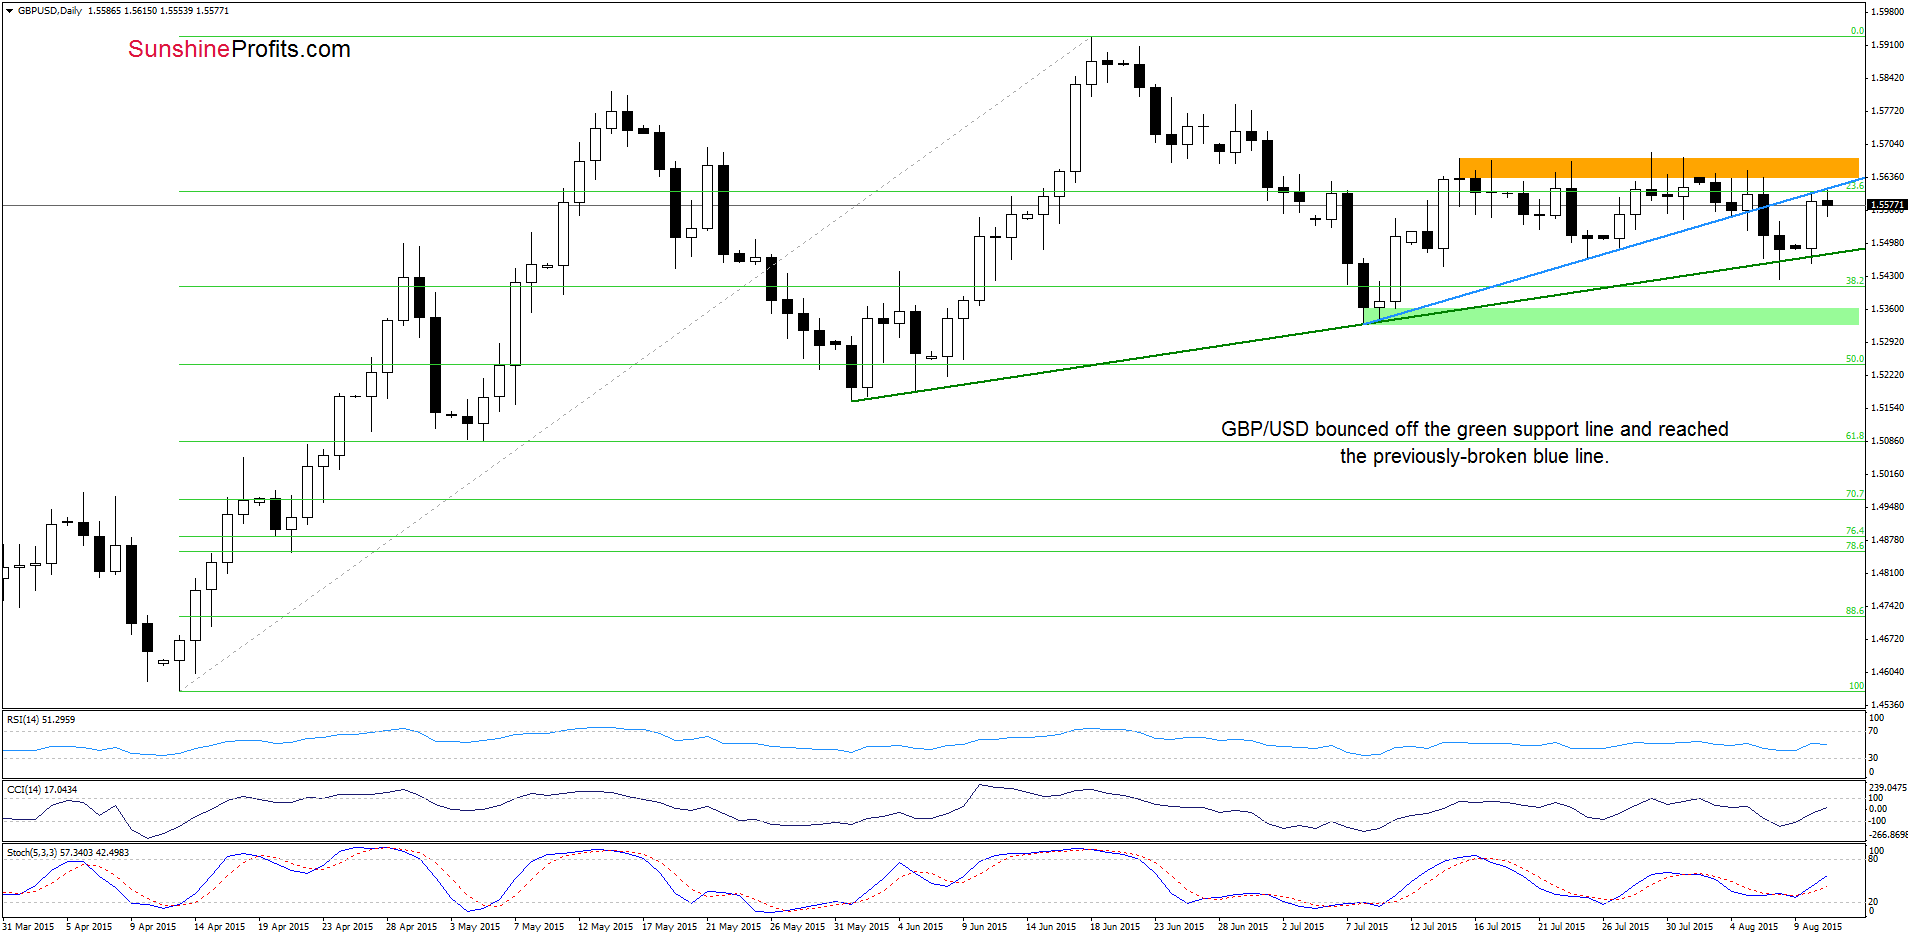
Looking at the above chart we see that GBP/USD climbed to the previously-broken blue line and declined slightly, which suggests that yesterday’s increase could be a verification of earlier breakdown. Nevertheless, the current position of the indicators (buy signals remain in place) suggests that another attempt to move higher can’t be ruled out. Finishing today’s commentary on this currency pair please note that a bigger upward move will be more likely only if we see a daily close above the blue resistance line and a successful breakout above the orange resistance zone based on the previous highs.
Very short-term outlook: mixed
Short-term outlook: mixed
MT outlook: mixed
LT outlook: mixed
Trading position (short-term; our opinion): No positions are justified from the risk/reward perspective at the moment. We will keep you informed should anything change, or should we see a confirmation/invalidation of the above.
USD/JPY
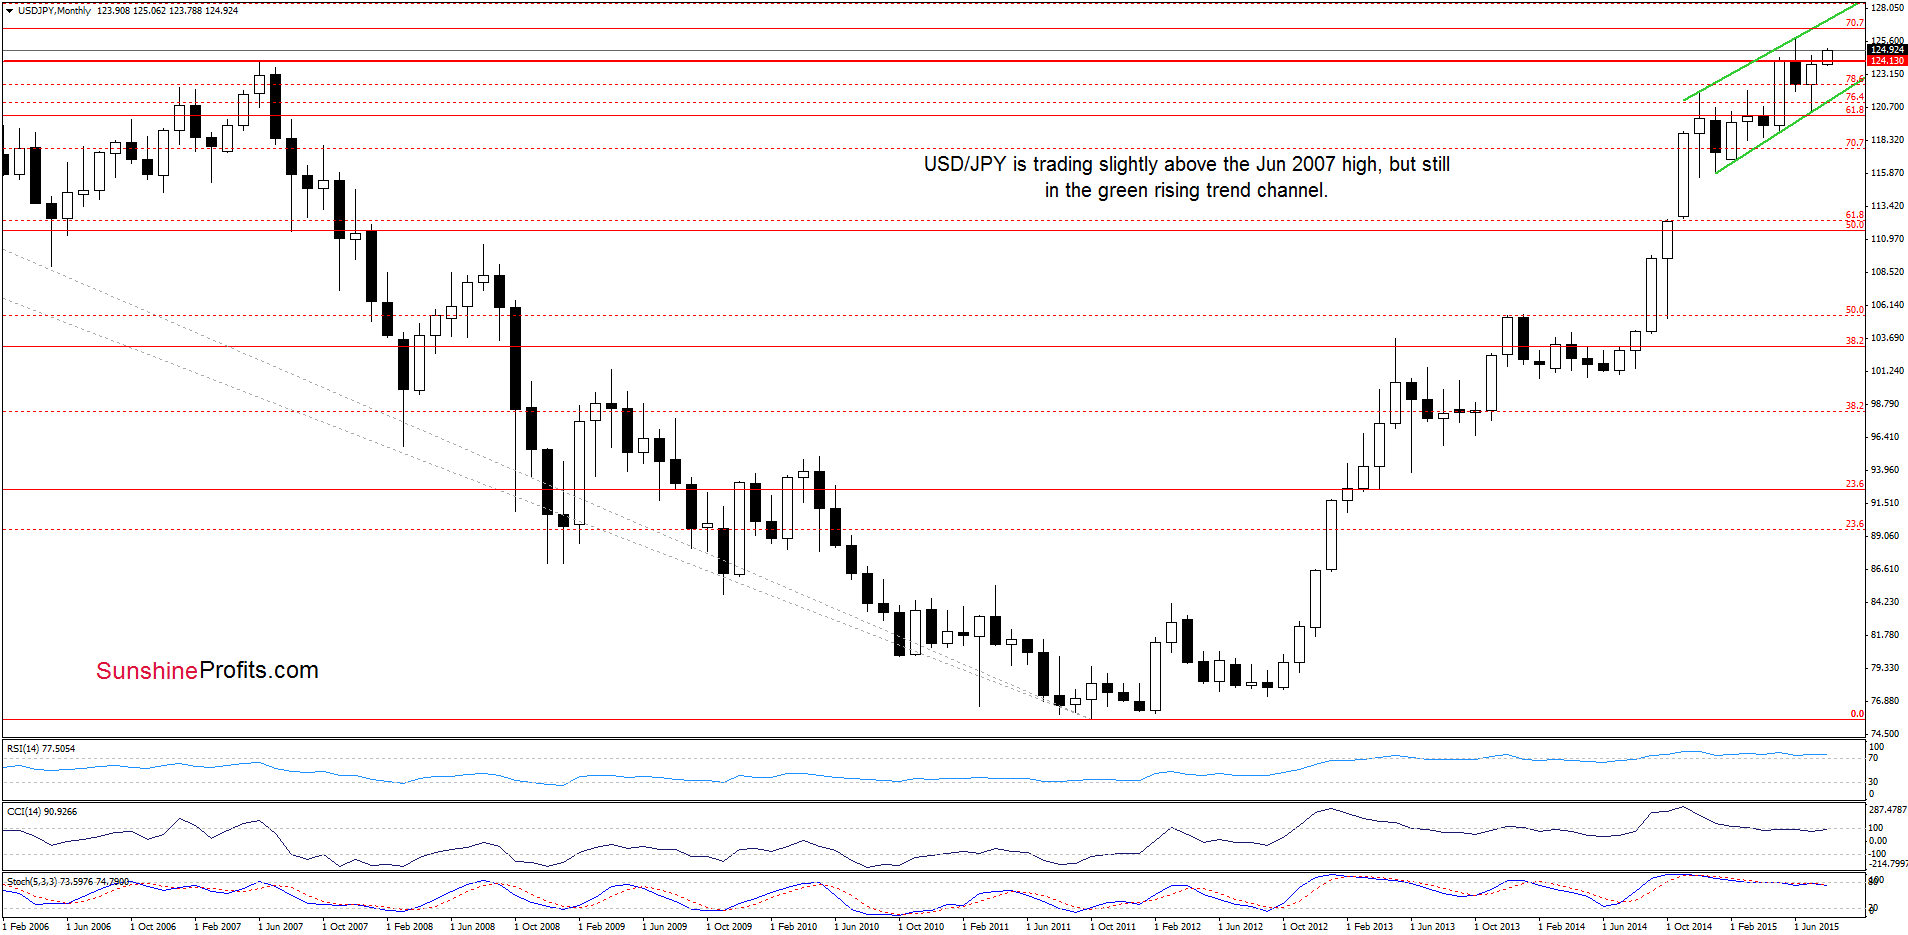
The situation in the medium term has improved as USD/JPY broke above the June 2007. Despite this move, the exchange rate is still trading in the green rising trend channel.
Having said that, let’s take a closer look at the daily chart.
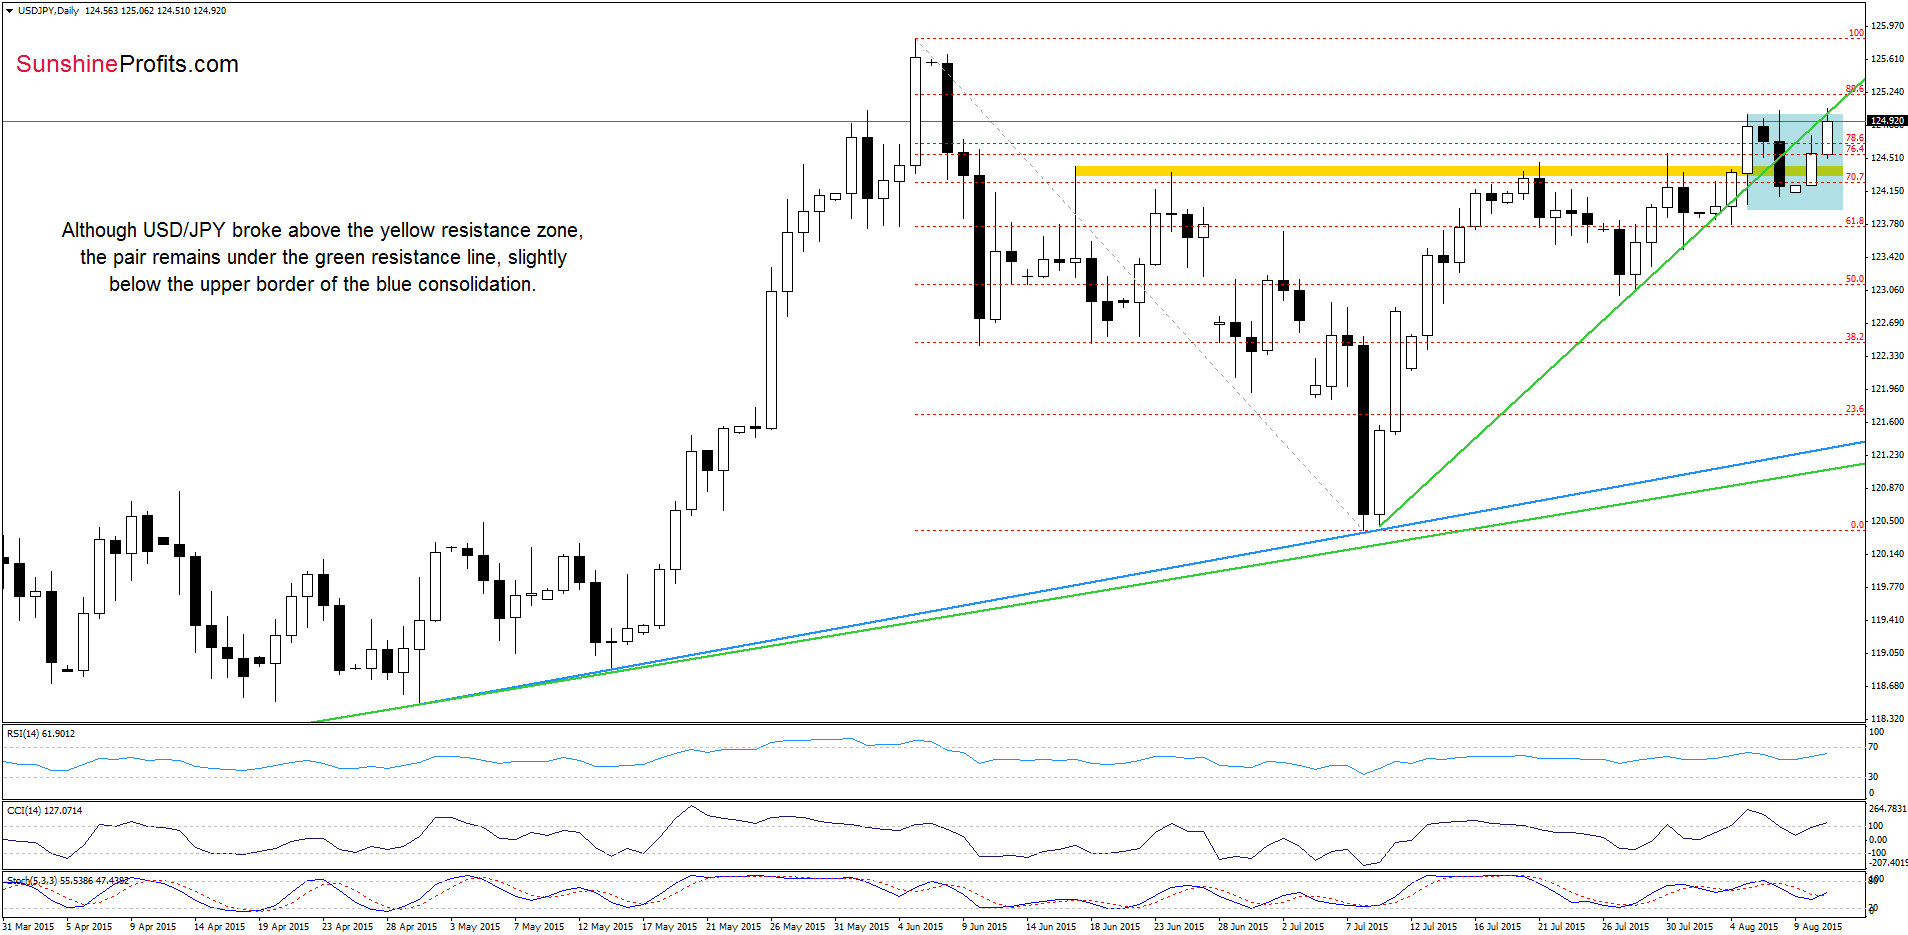
The first thing that catches the eye on the above chart is an invalidation of the breakdown under the yellow resistance zone and a climb above the resistance zone created by the 76.4% and 78.6% Fibonacci retracement levels. With today’s move, USD/JPY came back to the previously-broken green rising resistance line, which could be a verification of earlier breakdown. At this point, it is also worth noting that today’s increase took the exchange rate to the upper line of the blue consolidation, which suggests that if currency bulls manage to push the pair above the above-mentioned resistance levels, we’ll likely see further improvement and a test f the 88.6% Fibonacci retracement. However, if they fail, we’ll see a test of the lower border of the formation.
Very short-term outlook: mixed
Short-term outlook: mixed
MT outlook: mixed
LT outlook: mixed
Trading position (short-term; our opinion): No positions are justified from the risk/reward perspective at the moment. We will keep you informed should anything change, or should we see a confirmation/invalidation of the above.
USD/CAD
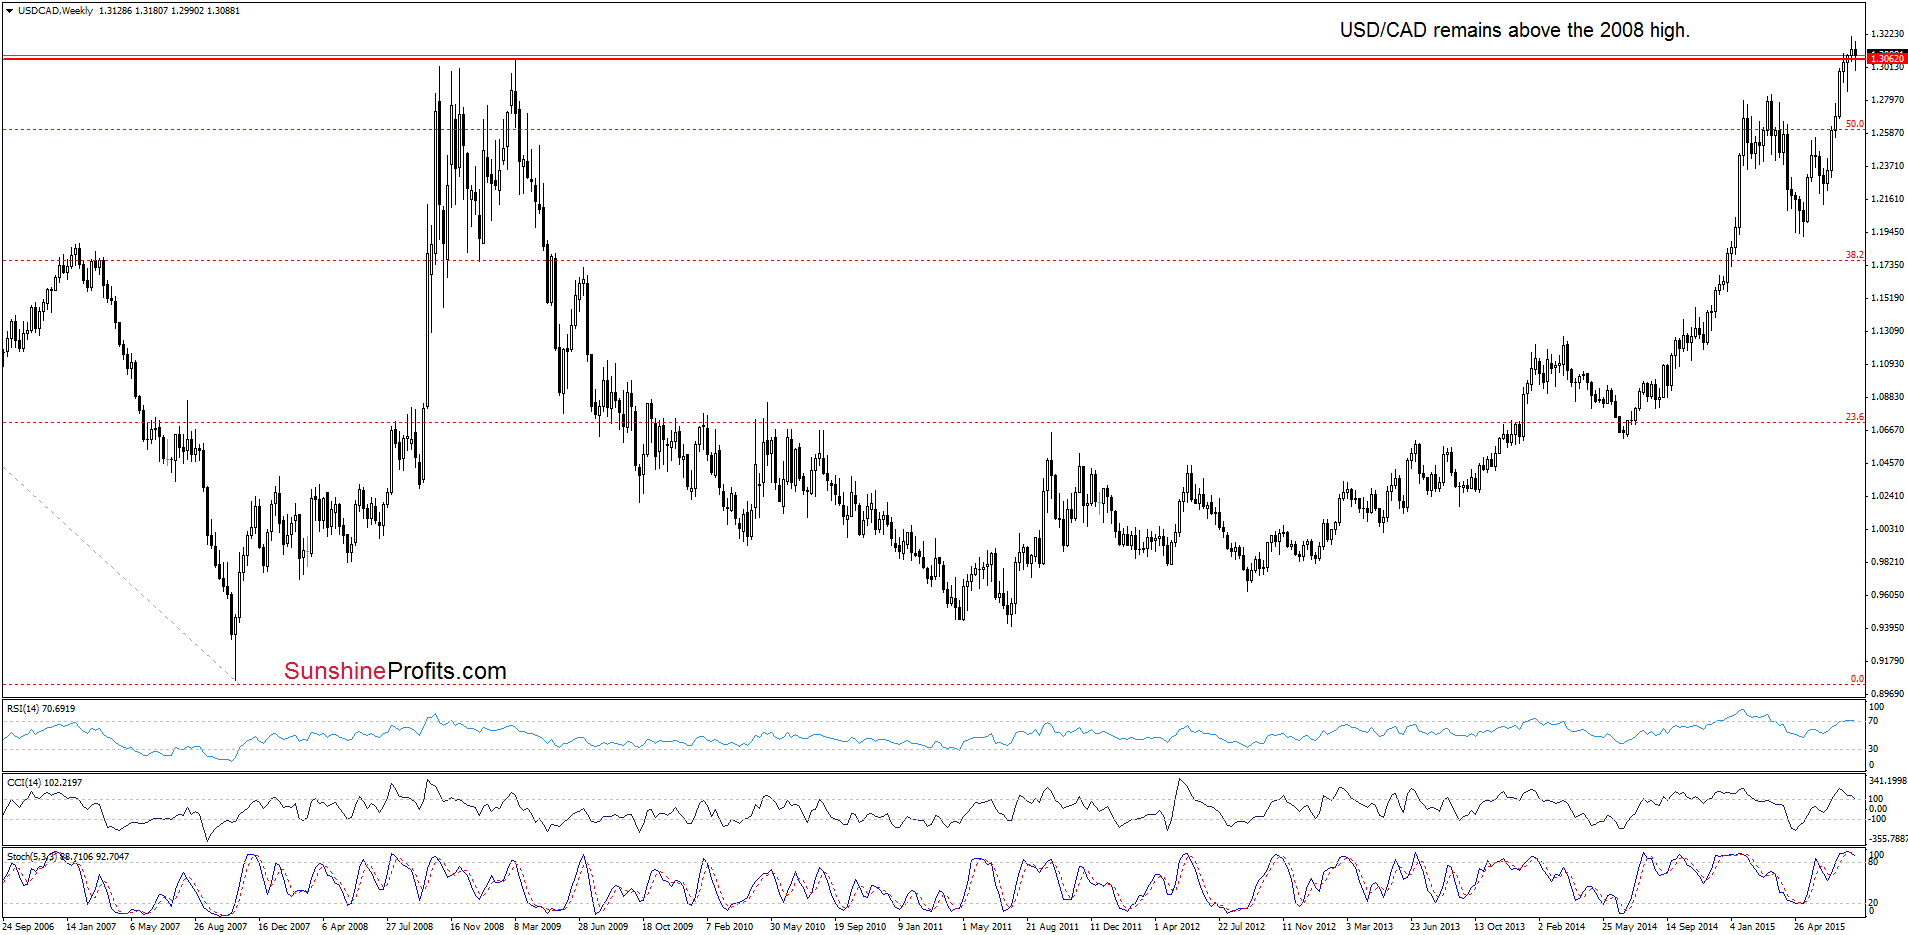
Looking at the weekly chart we see that although USD/CAD moved lower and slipped under the 2008 high, currency bulls didn’t give up and managed to push the pair above this resistance level once again. This is a positive signal, which suggests further improvement and a test of the last week’s high in the coming week.
Are there any other factors that could encourage currency bulls to act? Let’s check.
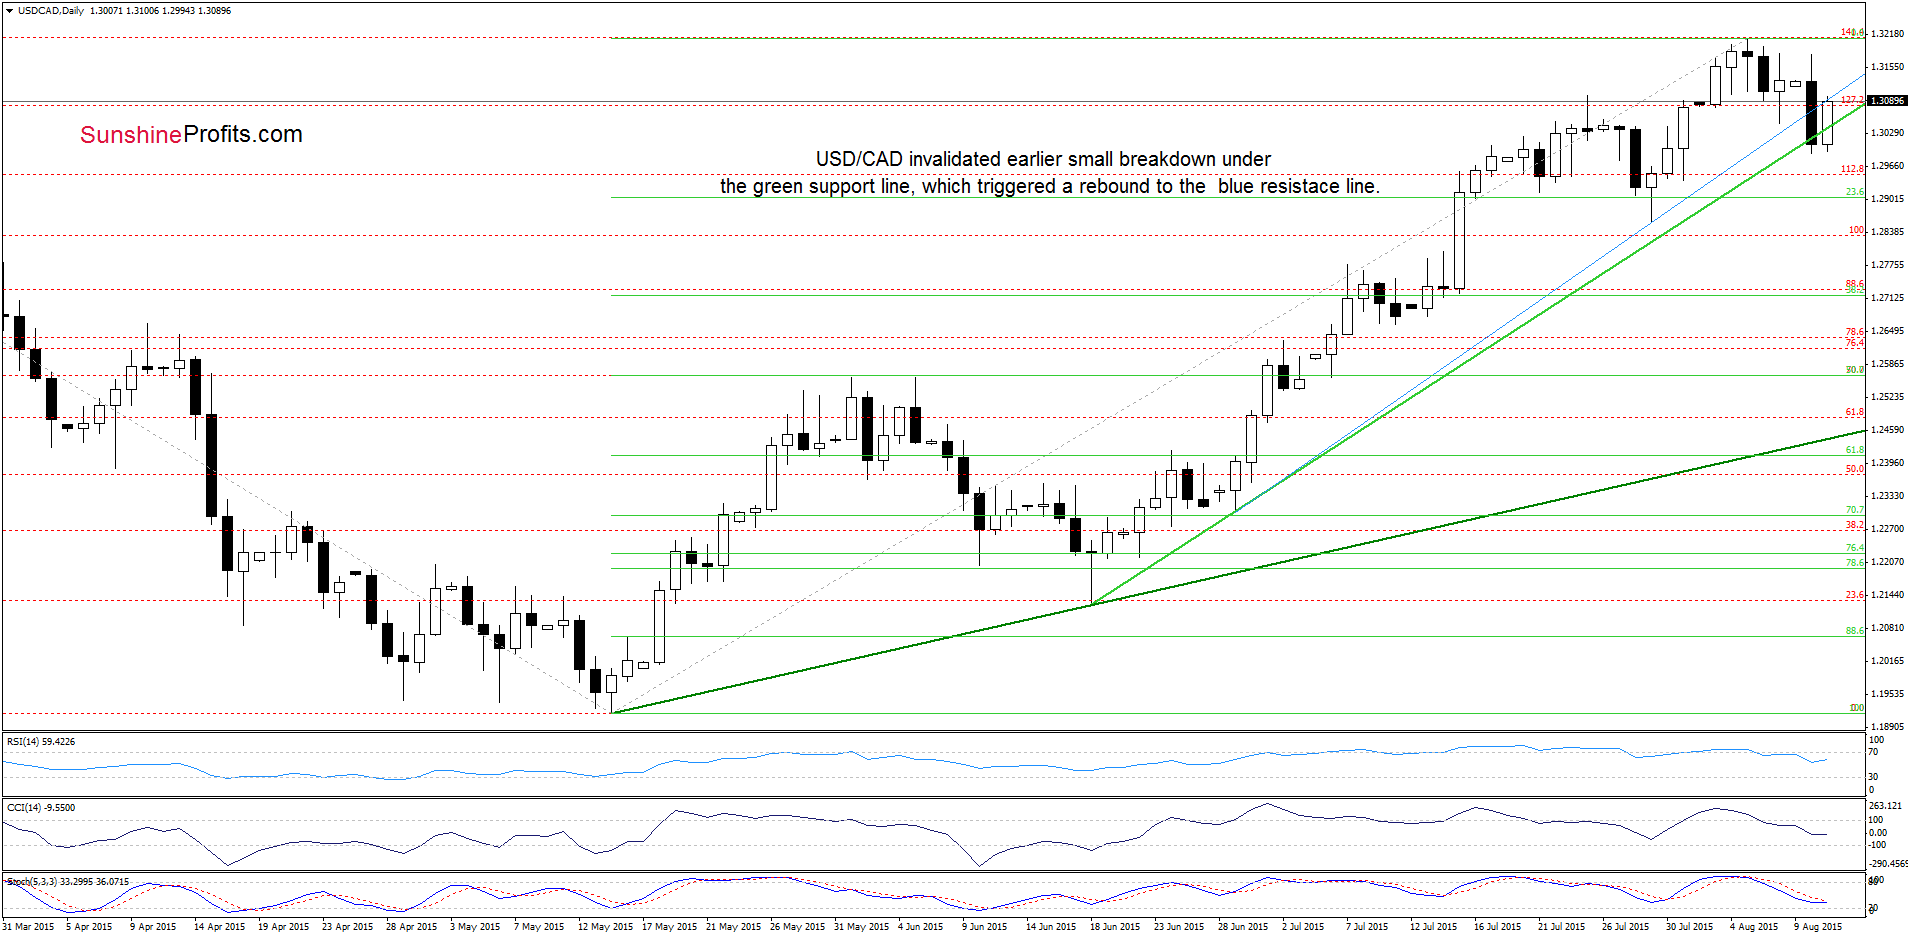
As you see on the daily chart the situation in the very short-term has improved as USD/CAD reversed and invalidated the breakdown below the short-term green support line earlier today. Thanks to this move, currency bulls pushed the pair higher, which resulted in a climb to the previously-broken blue line. Taking into account the medium-term picture and the current position of the daily indicators (the Stochastic Oscillator generated a buy signal), it seems that we’ll see a test of the Aug high in the coming day(s).
Very short-term outlook: mixed with bullish bias
Short-term outlook: mixed with bullish bias
MT outlook: mixed
LT outlook: mixed
Trading position (short-term; our opinion): No positions are justified from the risk/reward perspective at the moment. We will keep you informed should anything change, or should we see a confirmation/invalidation of the above.
USD/CHF
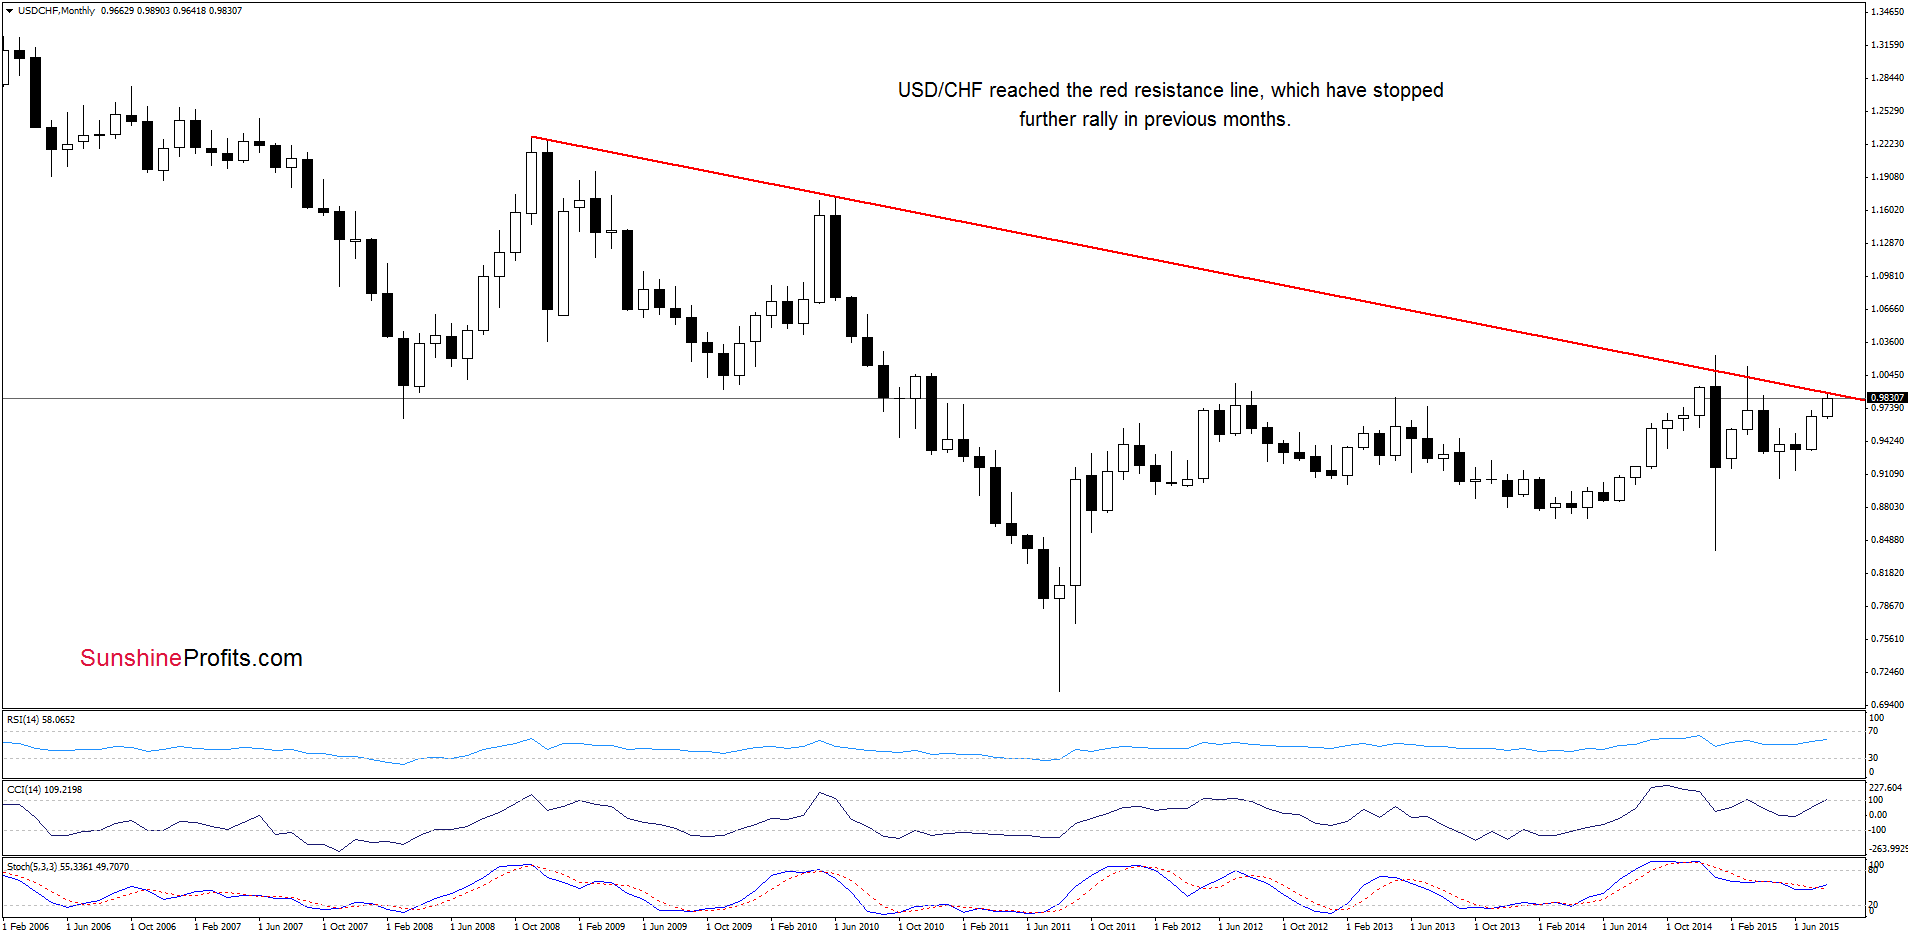
Quoting our previous commentary on this currency pair:
(…) USD/CHF reached the long-term red declining line. In previous months this solid resistance was strong enough to stop further rally and trigger corrections, which suggests that we could similar price action in the coming days/weeks.
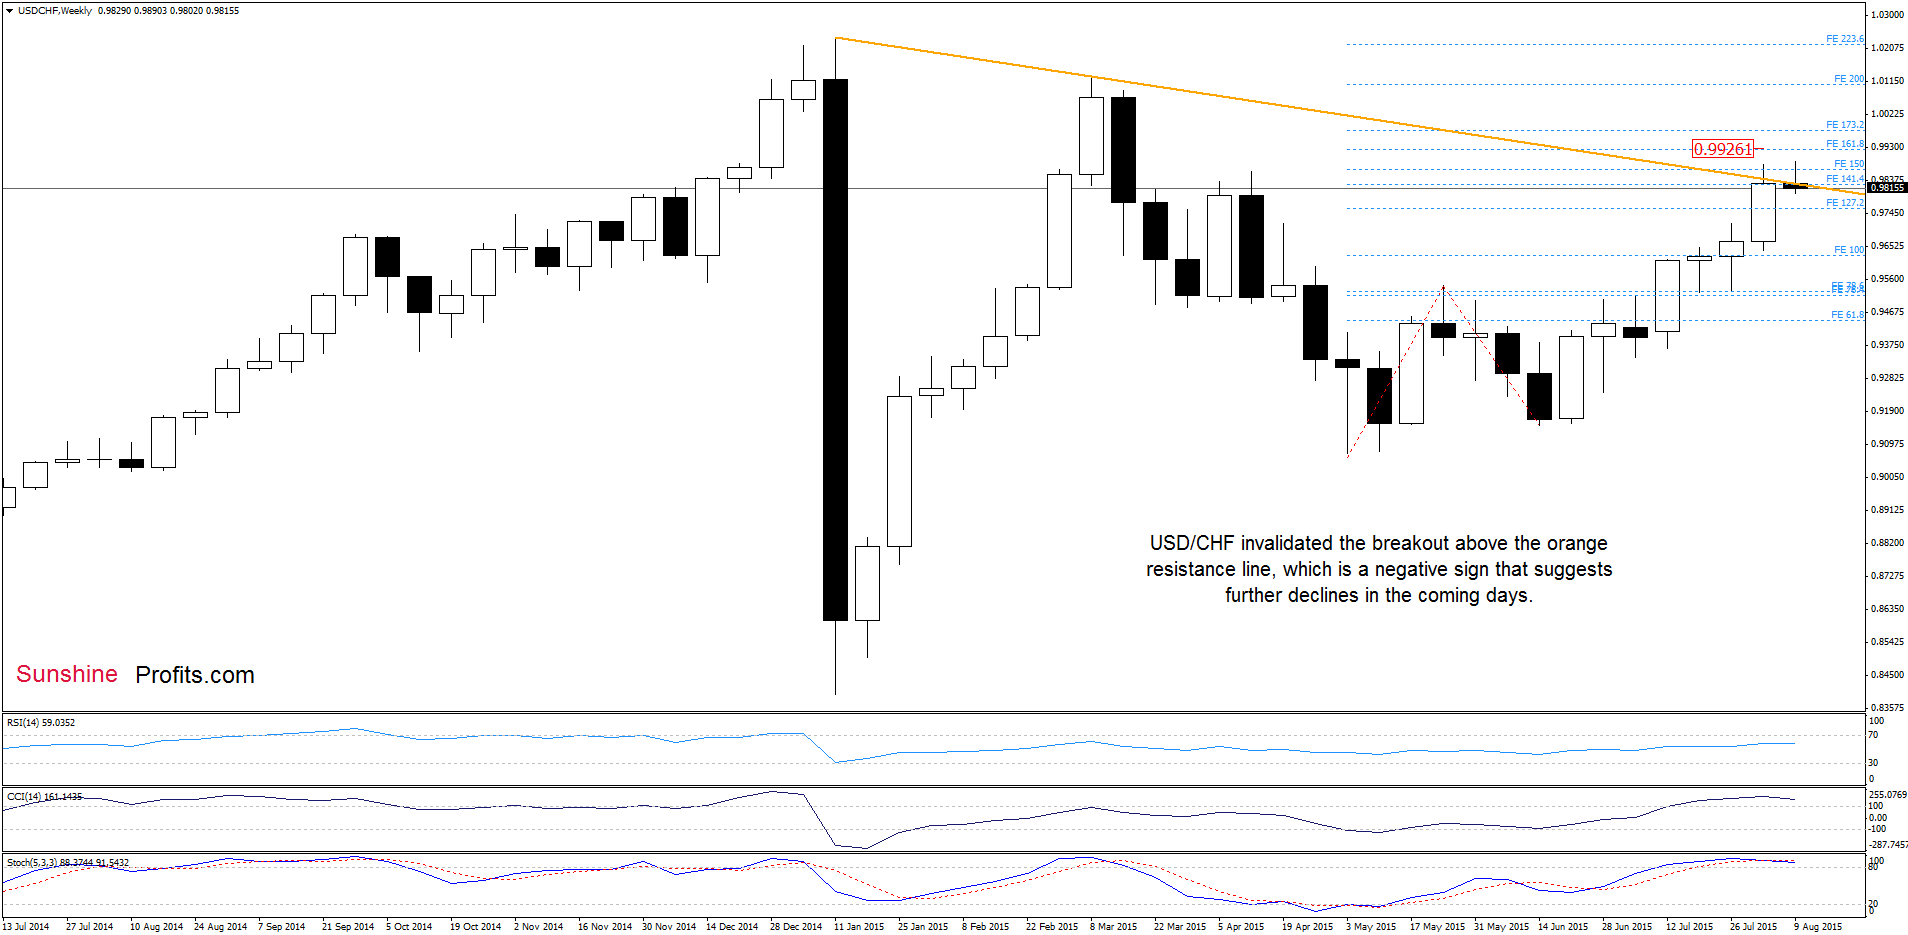
Looking at the weekly chart, we see that the above-mentioned resistance line triggered a pullback earlier today. With this move, USD/CHF slipped under the previously-broken orange support line, which is a negative sign (however, it will turn to bearish if we see a weekly close below this line).
What impact did this move have on the very short-term picture? Let’s find out.
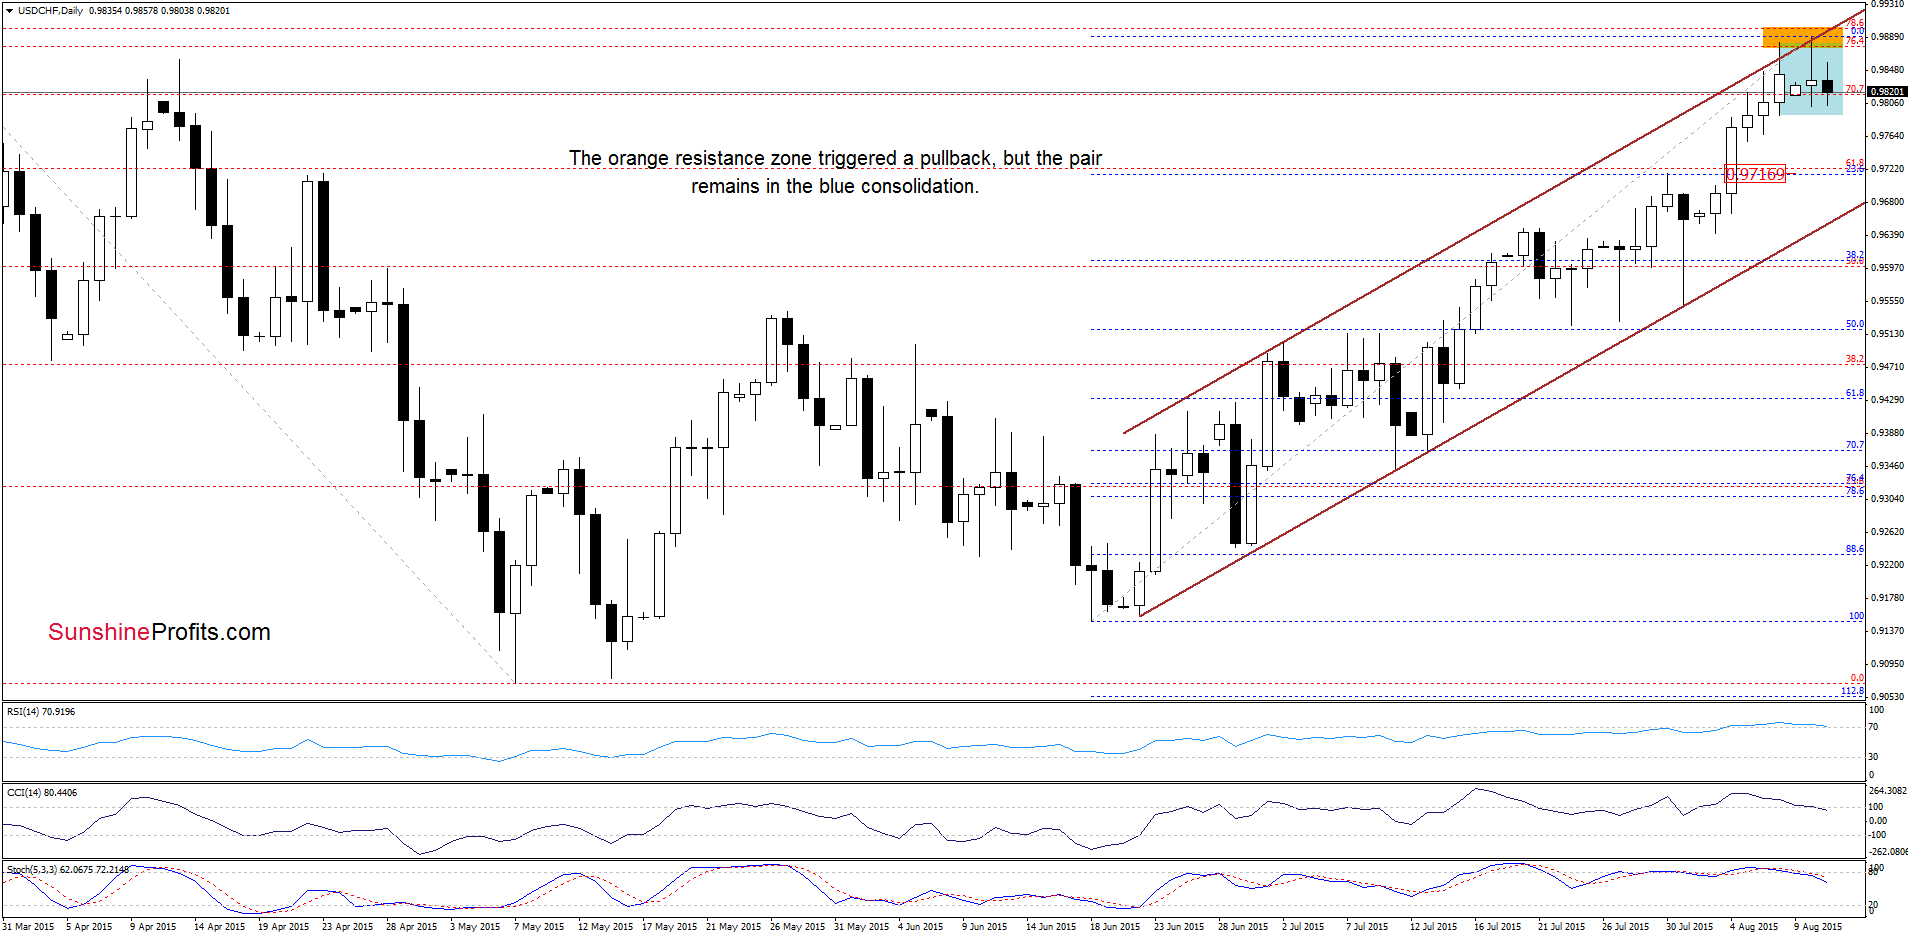
Yesterday, we wrote:
(…) the upper border of the rising trend channel and the orange resistance zone (created by the 76.4% and 78.6% Fibonacci retracement levels). As you see on the above chart, this solid resistance encouraged currency bears to act, which resulted in a pullback earlier today. Taking this fact into account, and combining it with the current position of the indicators (the RSI remains above the level of 70, the Stochastic Oscillator generated a sell signal, while the CCI is very close to doing the same), we think that the next move will be to the downside.
On the daily chart, we see that USD/CHF moved little lower earlier today. Despite this move, we think that as long as the pair remains in the blue consolidation, further deterioration is not likely to be seen. However, sell signals generated by the indicators suggest that another attempt to move lower is just around the corner. If this is the case, and the exchange rate drops below 0.9790, we may see a decline to around 0.9717, where the 23.6% Fibonacci retracement (based on the entire Jun-Aug rally) is.
Very short-term outlook: mixed with bearish bias
Short-term outlook: mixed
MT outlook: mixed
LT outlook: mixed
Trading position (short-term; our opinion): No positions are justified from the risk/reward perspective at the moment. We will keep you informed should anything change, or should we see a confirmation/invalidation of the above.
AUD/USD
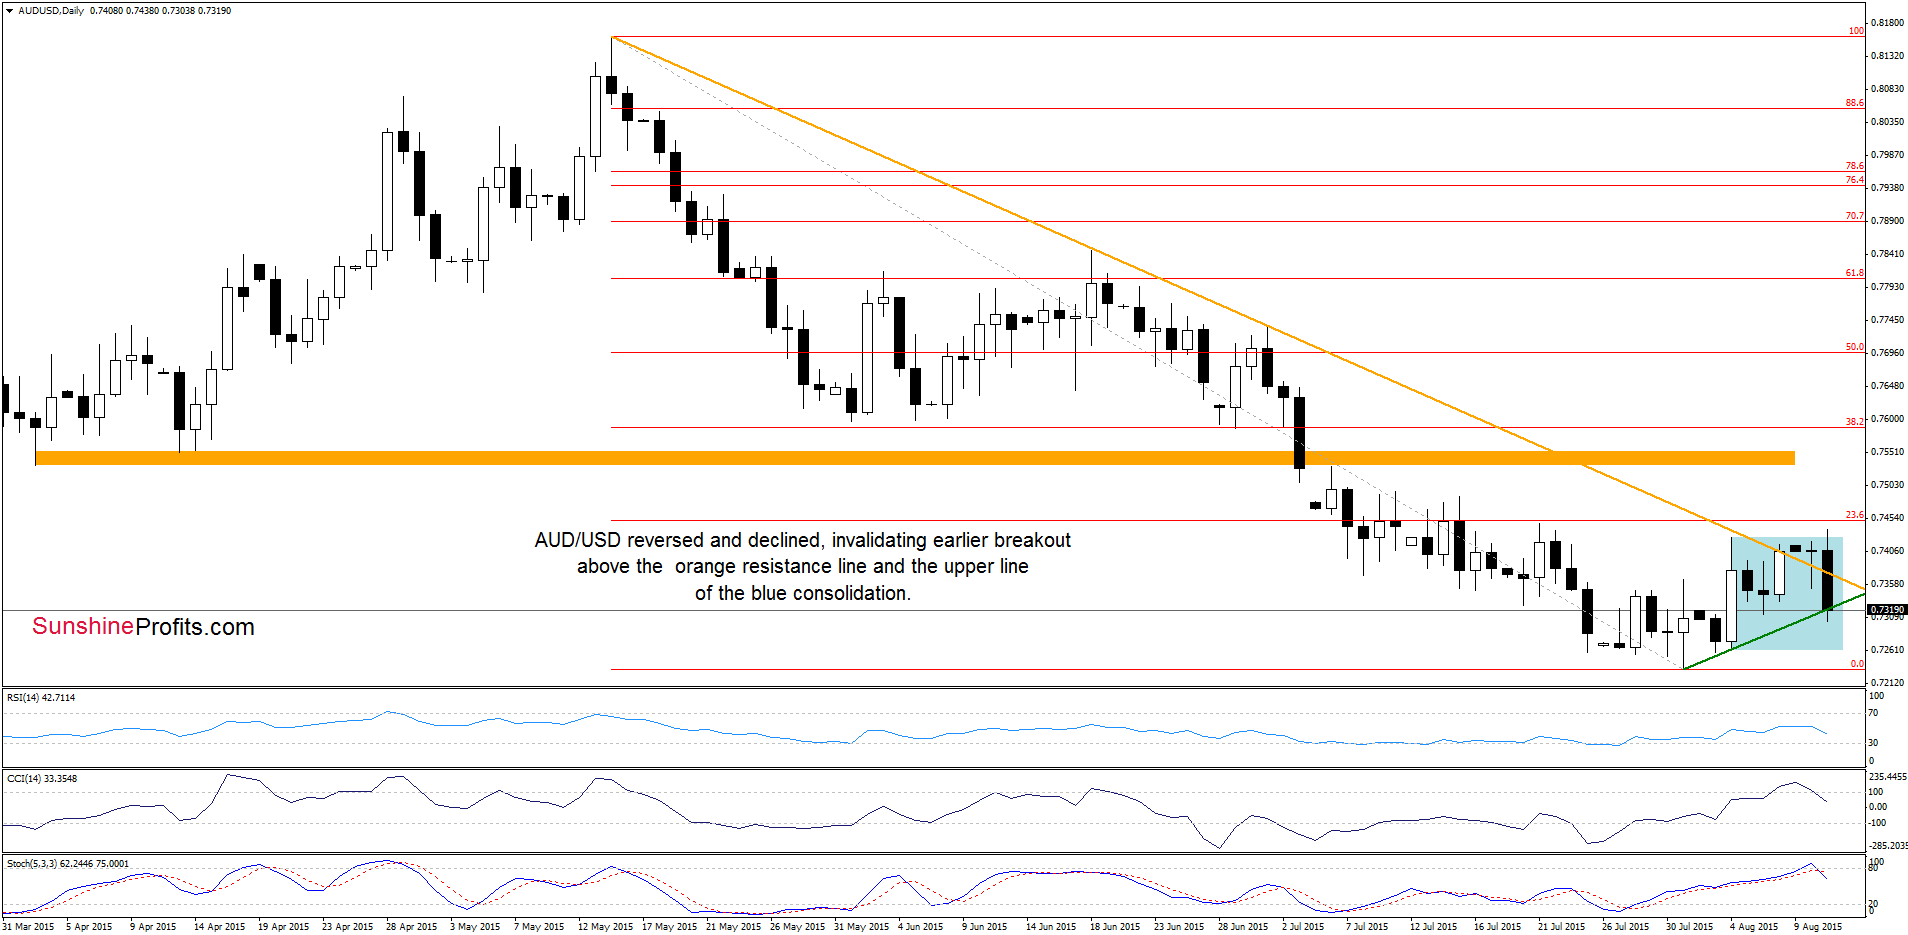
From today’s point of view, we see that AUD/USD reversed and declined, invalidating earlier breakout above the orange declining support line and the upper border of the blue consolidation. This negative event triggered a sharp decline, which took the pair to the green support line (based on the recent lows) earlier today. Although the pair could rebound from here, the current position of the indicators the CCI and Stochastic Oscillator generated sell signals) suggests that further deterioration is more likely. If this is the case, and the pair moves lower for here, it would be another negative sign (which will turn to bearish if AUD/USD closes today’s session under this line), which will likely translate to a test of the recent lows in the coming days.
What could happen if currency bulls didn’t manage to hold them? Let’s examine the weekly chart and find out.
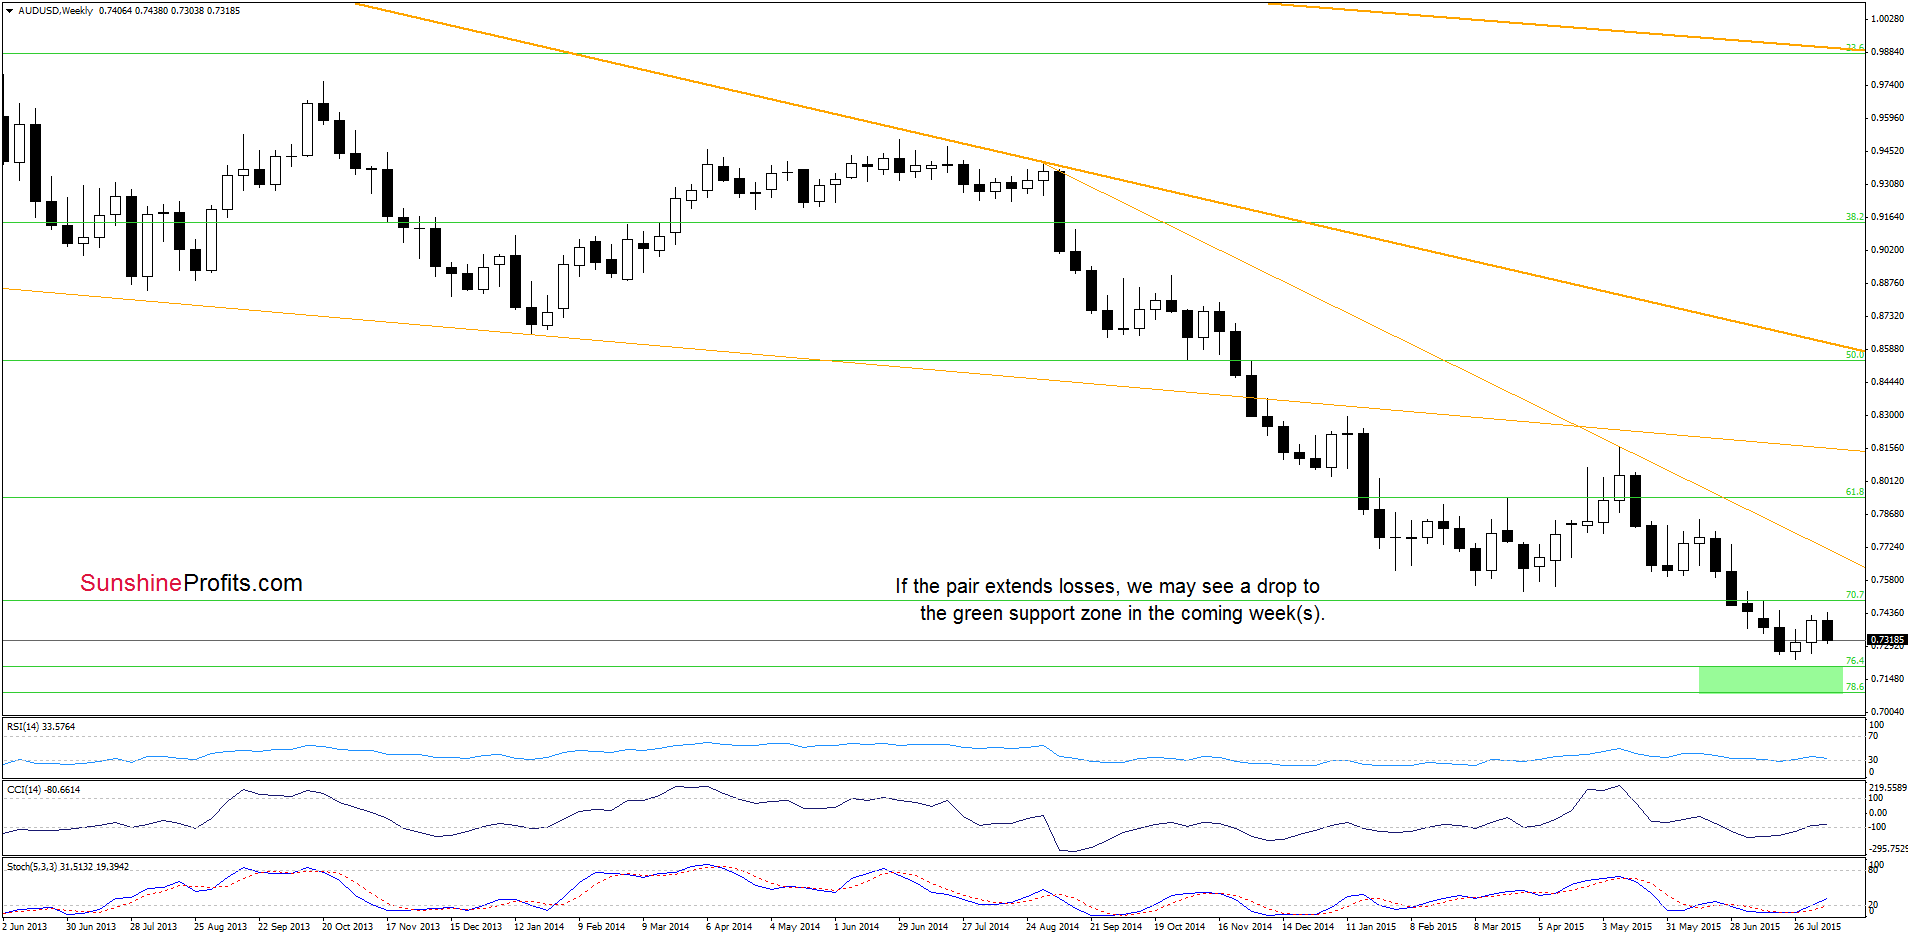
If AUD/USD extends losses, we may see a drop even to around 0.7087-0.7200, where the green support zone (based on the 76.4% and 78.6% Fibonacci retracement levels) is.
Very short-term outlook: bearish
Short-term outlook: mixed with bearish bias
MT outlook: mixed with bearish bias
LT outlook: mixed
Trading position (short-term; our opinion): No positions are justified from the risk/reward perspective at the moment. We will keep you informed should anything change, or should we see a confirmation/invalidation of the above.
Thank you.
Nadia Simmons
Forex & Oil Trading Strategist
Przemyslaw Radomski, CFA
Founder, Editor-in-chief
Gold & Silver Trading Alerts
Forex Trading Alerts
Oil Investment Updates
Oil Trading Alerts

