

Although Friday’s solid U.S. jobs report for July reinforced expectations for higher interest rates, the USD Index reversed and extended losses, slipping to slightly above 97 earlier today. As a result, USD/CHF pulled back from a multi-month high, but will we see further deterioration in the coming days?
In our opinion the following forex trading positions are justified - summary:
EUR/USD
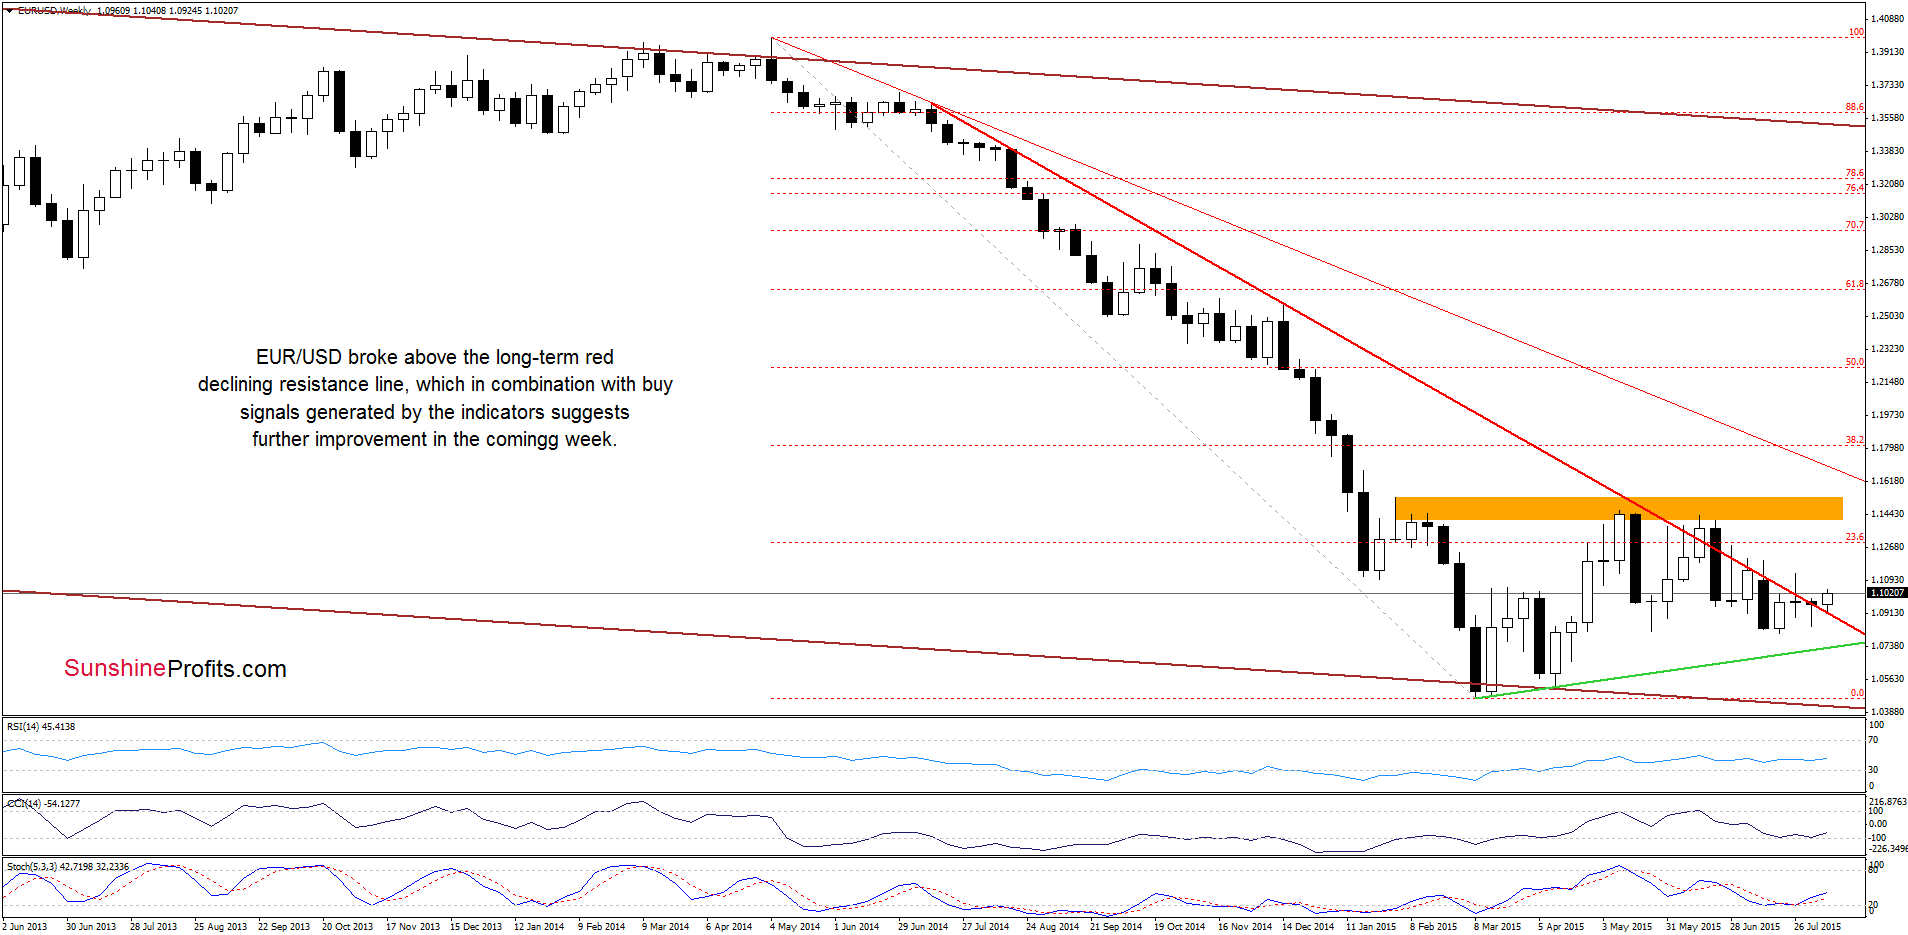
The first thing that catches the eye on the weekly chart is a breakout above the long-term red declining resistance line, which is a positive signal that suggests further improvement – especially when we factor in buy signals generated by the indicators.
What impact did this move have on the very short-term picture? Let’s take a closer look at the daily chart and find out.
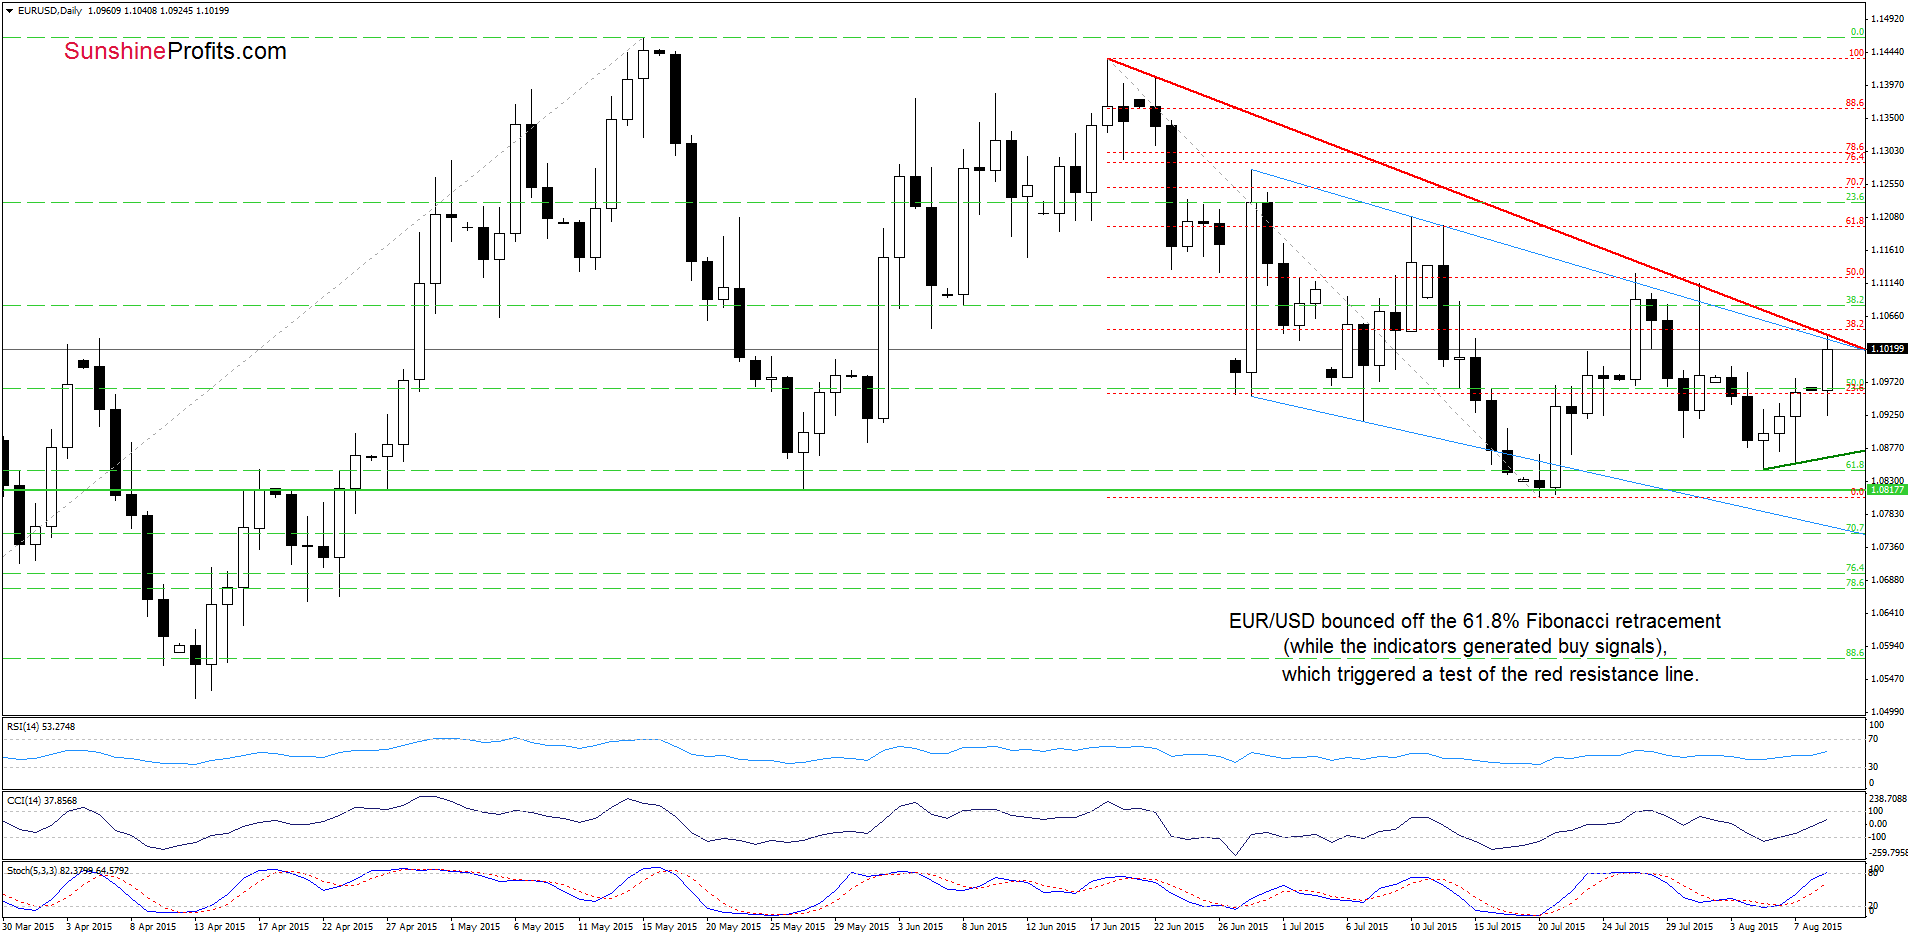
From this perspective, we see that EUR/USD bounced off the 61.8% Fibonacci retracement, which resulted in a rally to the red declining resistance line earlier today. Additionally, the CCI and Stochastic Oscillator generated buy signals, which suggests that currency bulls will likely try to push the exchange rate above this resistance in the coming days. If this is the case, and they succeed, the next upside target would be around 1.1113-1.1128, where the Jul 27, Jul 31 highs and the 50% Fibonacci retracement (based on the Jun-Jul decline) are.
Very short-term outlook: mixed with bullish bias
Short-term outlook: mixed
MT outlook: mixed
LT outlook: mixed
Trading position (short-term; our opinion): No positions are justified from the risk/reward perspective at the moment. We will keep you informed should anything change, or should we see a confirmation/invalidation of the above.
GBP/USD
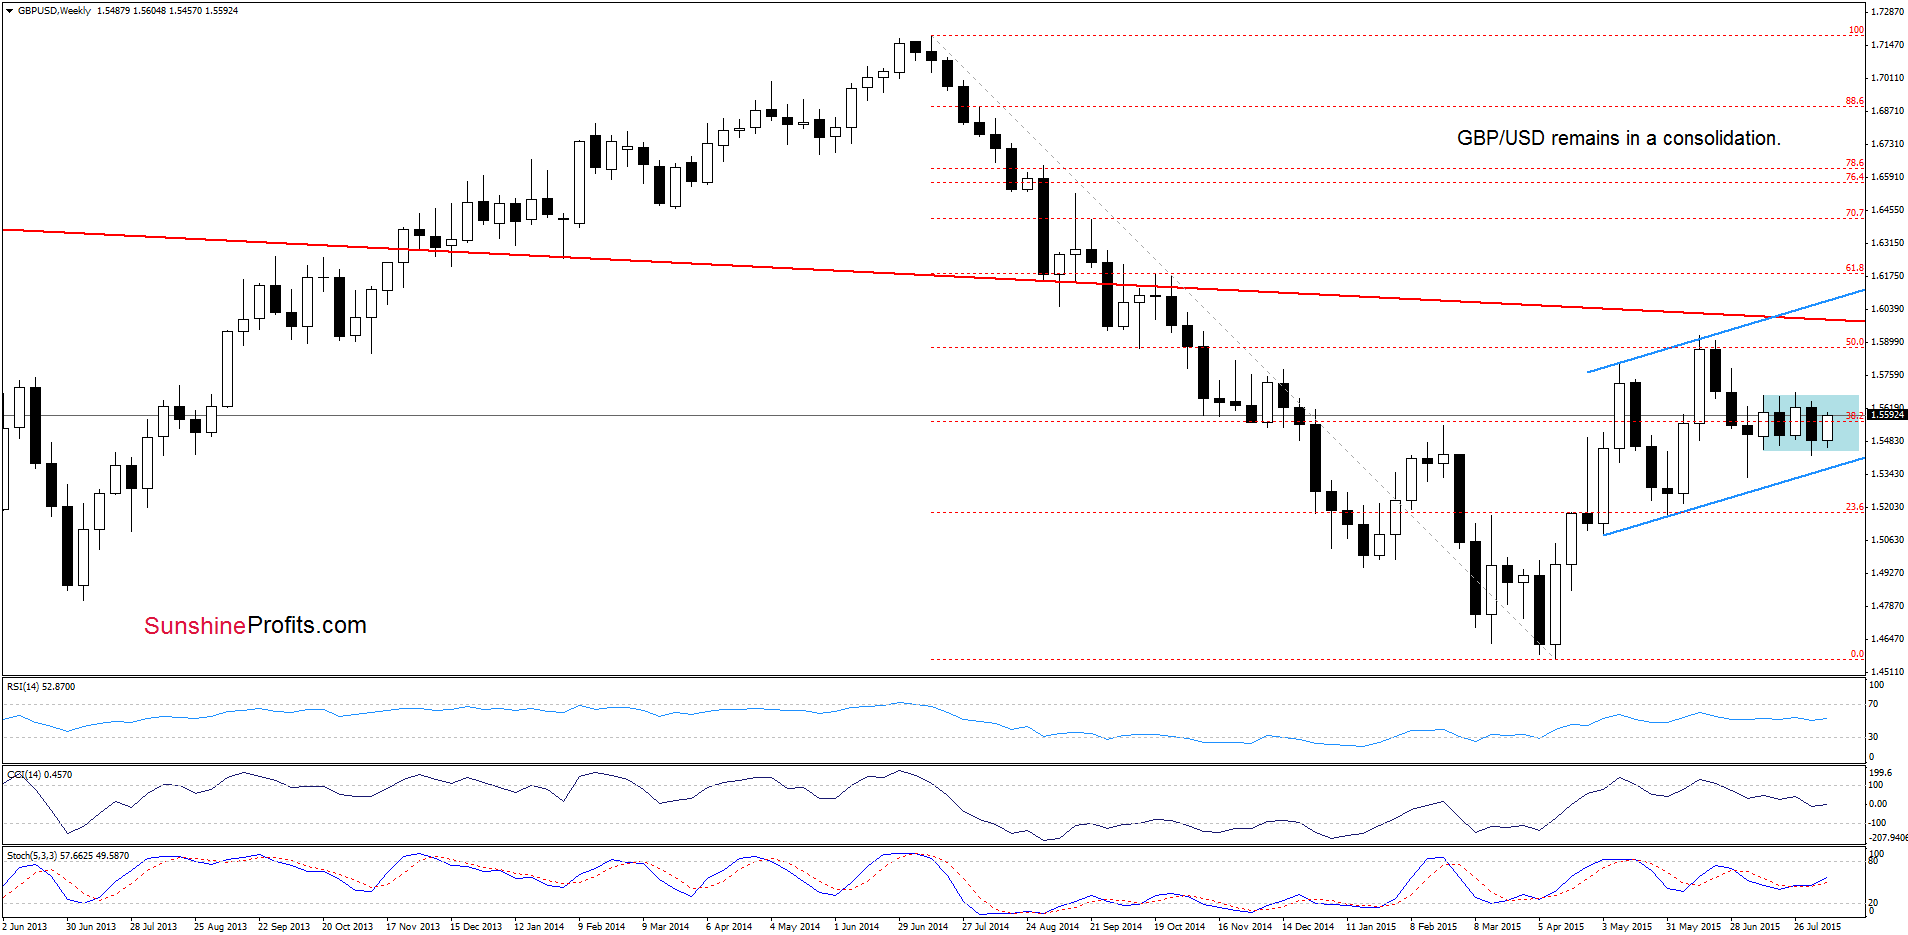
The situation in the medium term remains almost unchanged as GBP/USD is trading in the blue consolidation. Today, we’ll focus on the very short-term picture.
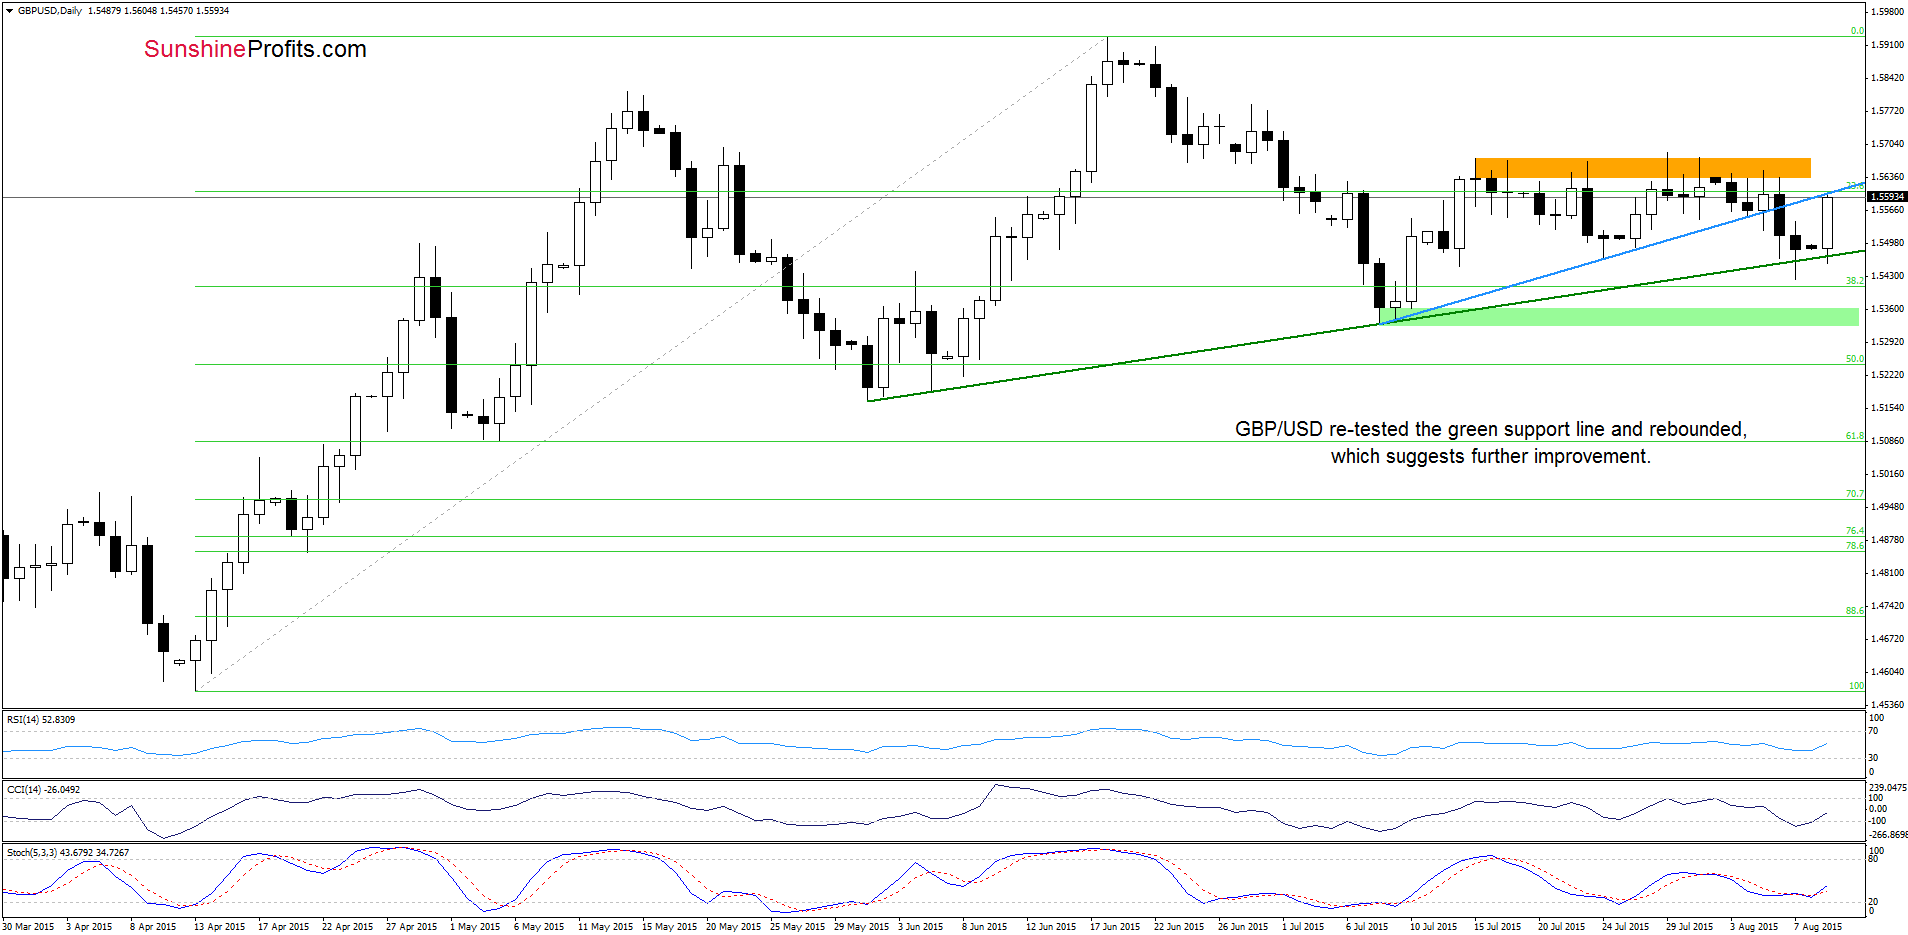
Looking at the above chart we see that GBP/USD broke below the blue support line, which triggered a decline to slightly below the short-term green support line. Despite this deterioration, currency bulls managed to invalidate this breakdown, which translated to a sharp rebound earlier today. With this upswing, the exchange rate climbed to the previously-broken blue line. Verification of earlier breakdown or further rally? Taking into account the current position of the indicators (the CCI and Stochastic Oscillator generated buy signals), we think that further improvement is just around the corner. Nevertheless, a bigger upward move will be more likely if we see a daily close above the blue resistance line and a successful breakout above the orange resistance zone based on the previous highs.
Very short-term outlook: mixed with bullish bias
Short-term outlook: mixed
MT outlook: mixed
LT outlook: mixed
Trading position (short-term; our opinion): No positions are justified from the risk/reward perspective at the moment. We will keep you informed should anything change, or should we see a confirmation/invalidation of the above.
USD/CHF
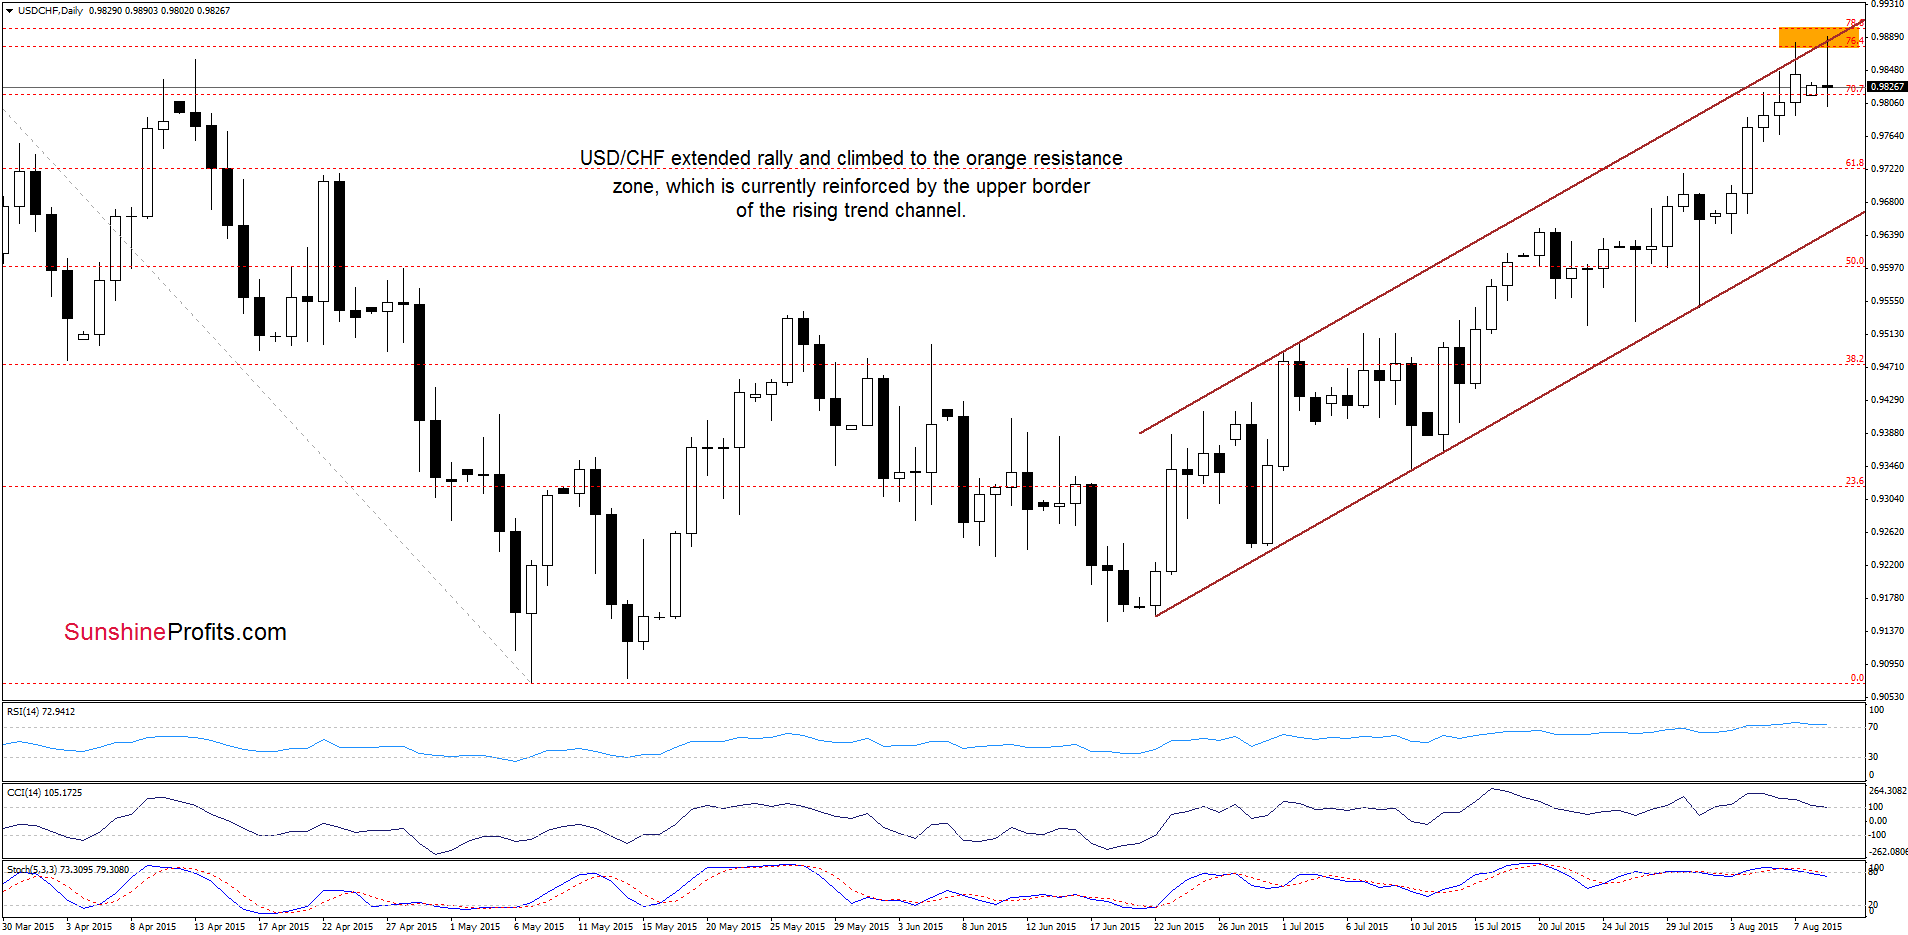
From today’s point of view we see that USD/CHF broke above the 70.7% Fibonacci retracement, which triggered a test of the upper border of the rising trend channel and the orange resistance zone (created by the 76.4% and 78.6% Fibonacci retracement levels). As you see on the above chart, this solid resistance encouraged currency bears to act, which resulted in a pullback earlier today. Taking this fact into account, and combining it with the current position of the indicators (the RSI remains above the level of 70, the Stochastic Oscillator generated a sell signal, while the CCI is very close to doing the same), we think that the next move will be to the downside.
Are there any other technical factors that could encourage currency bears to act? Let’s take a look at the long-term chart and find out.
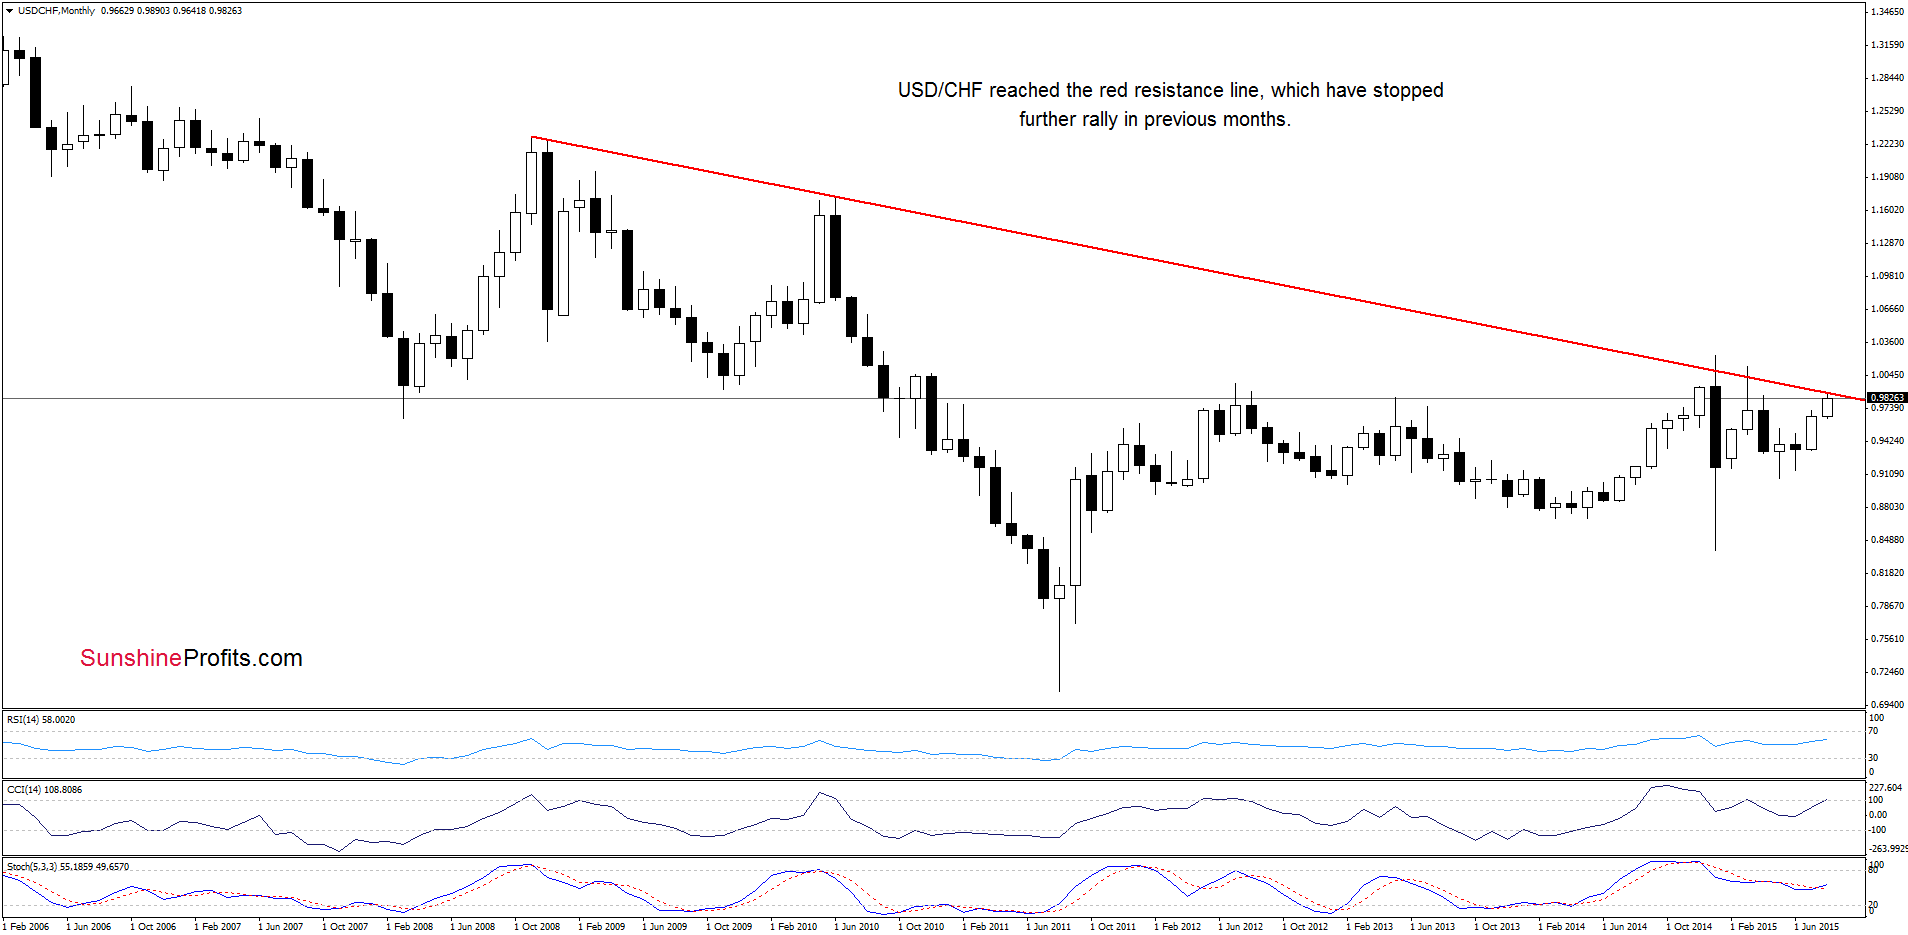
As you see on the monthly chart USD/CHF reached the long-term red declining line. In previous months this solid resistance was strong enough to stop further rally and trigger corrections, which suggests that we could similar price action in the coming days/weeks.
Very short-term outlook: mixed with bearish bias
Short-term outlook: mixed
MT outlook: mixed
LT outlook: mixed
Trading position (short-term; our opinion): No positions are justified from the risk/reward perspective at the moment. We will keep you informed should anything change, or should we see a confirmation/invalidation of the above.
Finishing today’s Forex Trading Alert please note that we’ll discuss the current situation in our all six currency pairs in tomorrow’s commentary.
Thank you.
Nadia Simmons
Forex & Oil Trading Strategist
Przemyslaw Radomski, CFA
Founder, Editor-in-chief
Gold & Silver Trading Alerts
Forex Trading Alerts
Oil Investment Updates
Oil Trading Alerts

