

Yesterday, the Federal Reserve Bank of Philadelphia showed that its manufacturing index dropped to 5.7 in July, missing analysts’ expectations for a drop to 12.0. As a result, the USD Index moved away from a one-and-a-half month high of 97.92. Nevertheless, the greenback remains supported by growing expectations for a U.S. rate hike later this year. Will today’s data push the index higher? Before we know the answer to this question, let’s take a closer look at the current picture of our currency pairs.
In our opinion the following forex trading positions are justified - summary:
- EUR/USD: short (stop-loss order at 1.1058)
- GBP/USD: none
- USD/JPY: none
- USD/CAD: none
- USD/CHF: none
- AUD/USD: none
EUR/USD
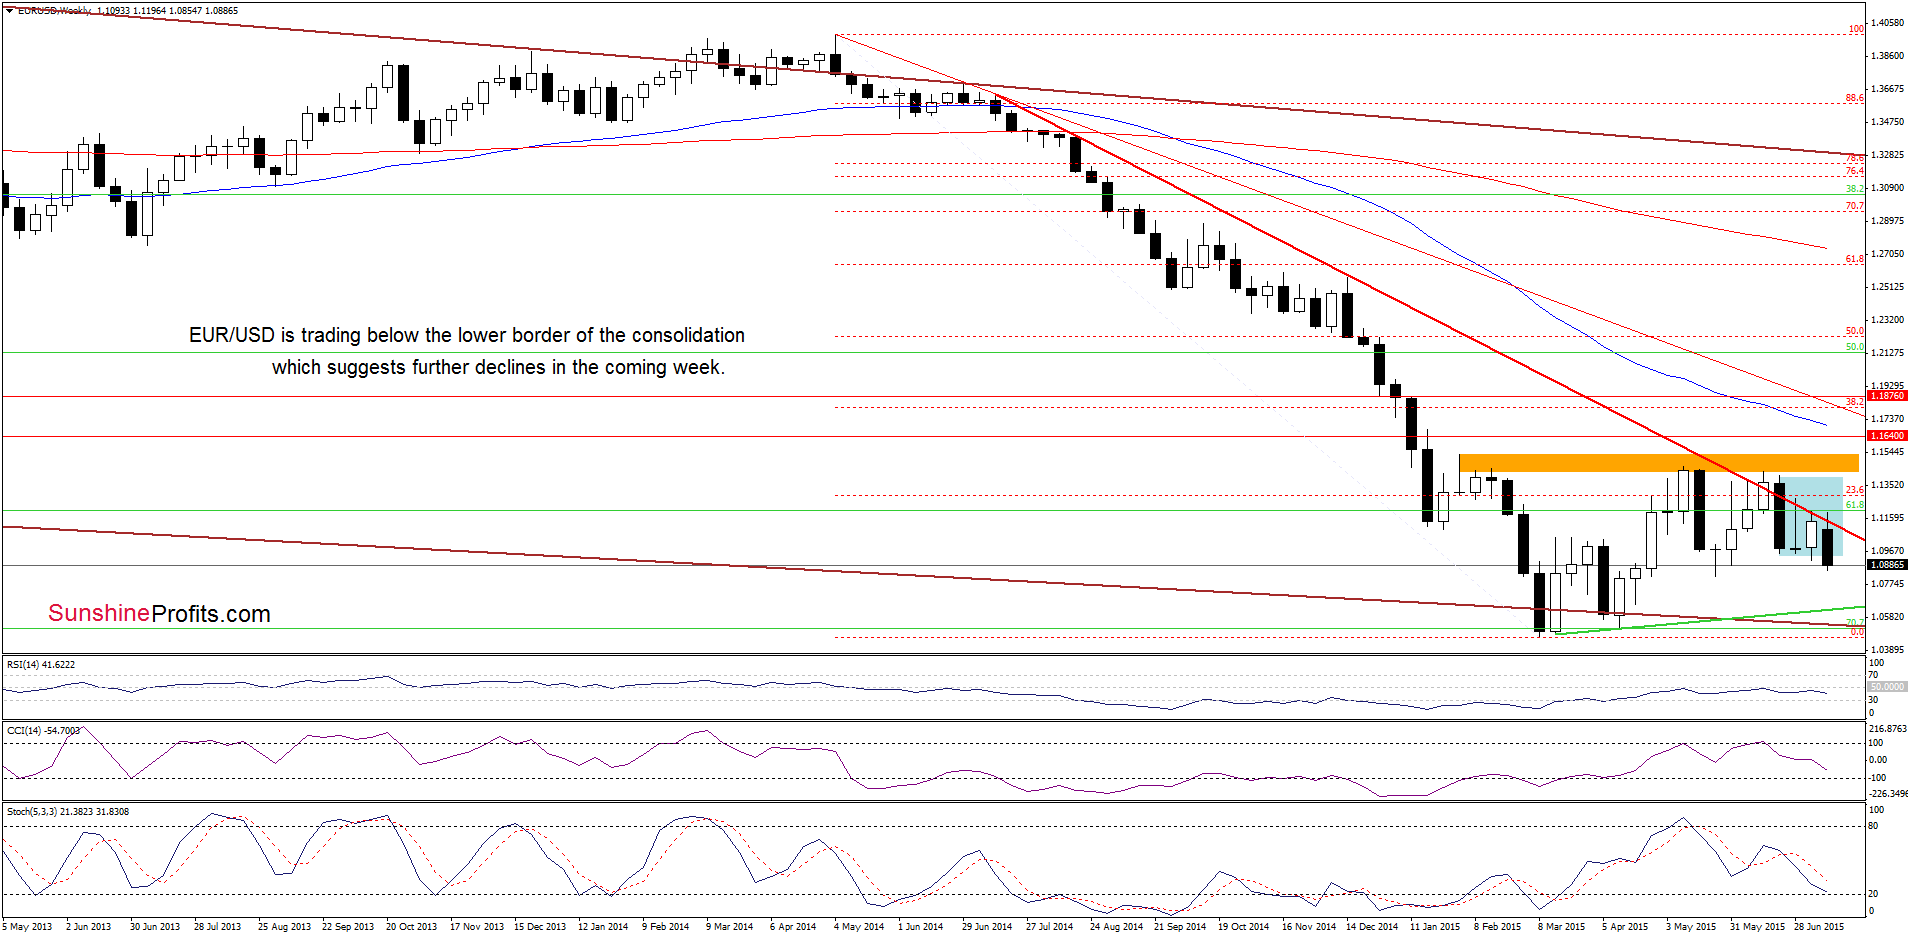
The situation in the medium term hasn’t changed much as EUR/USD is trading under the previously-broken lower border of the blue consolidation, which is a bearish signal that suggests further deterioration.
Having said that, let’s focus on the very short-term changes.
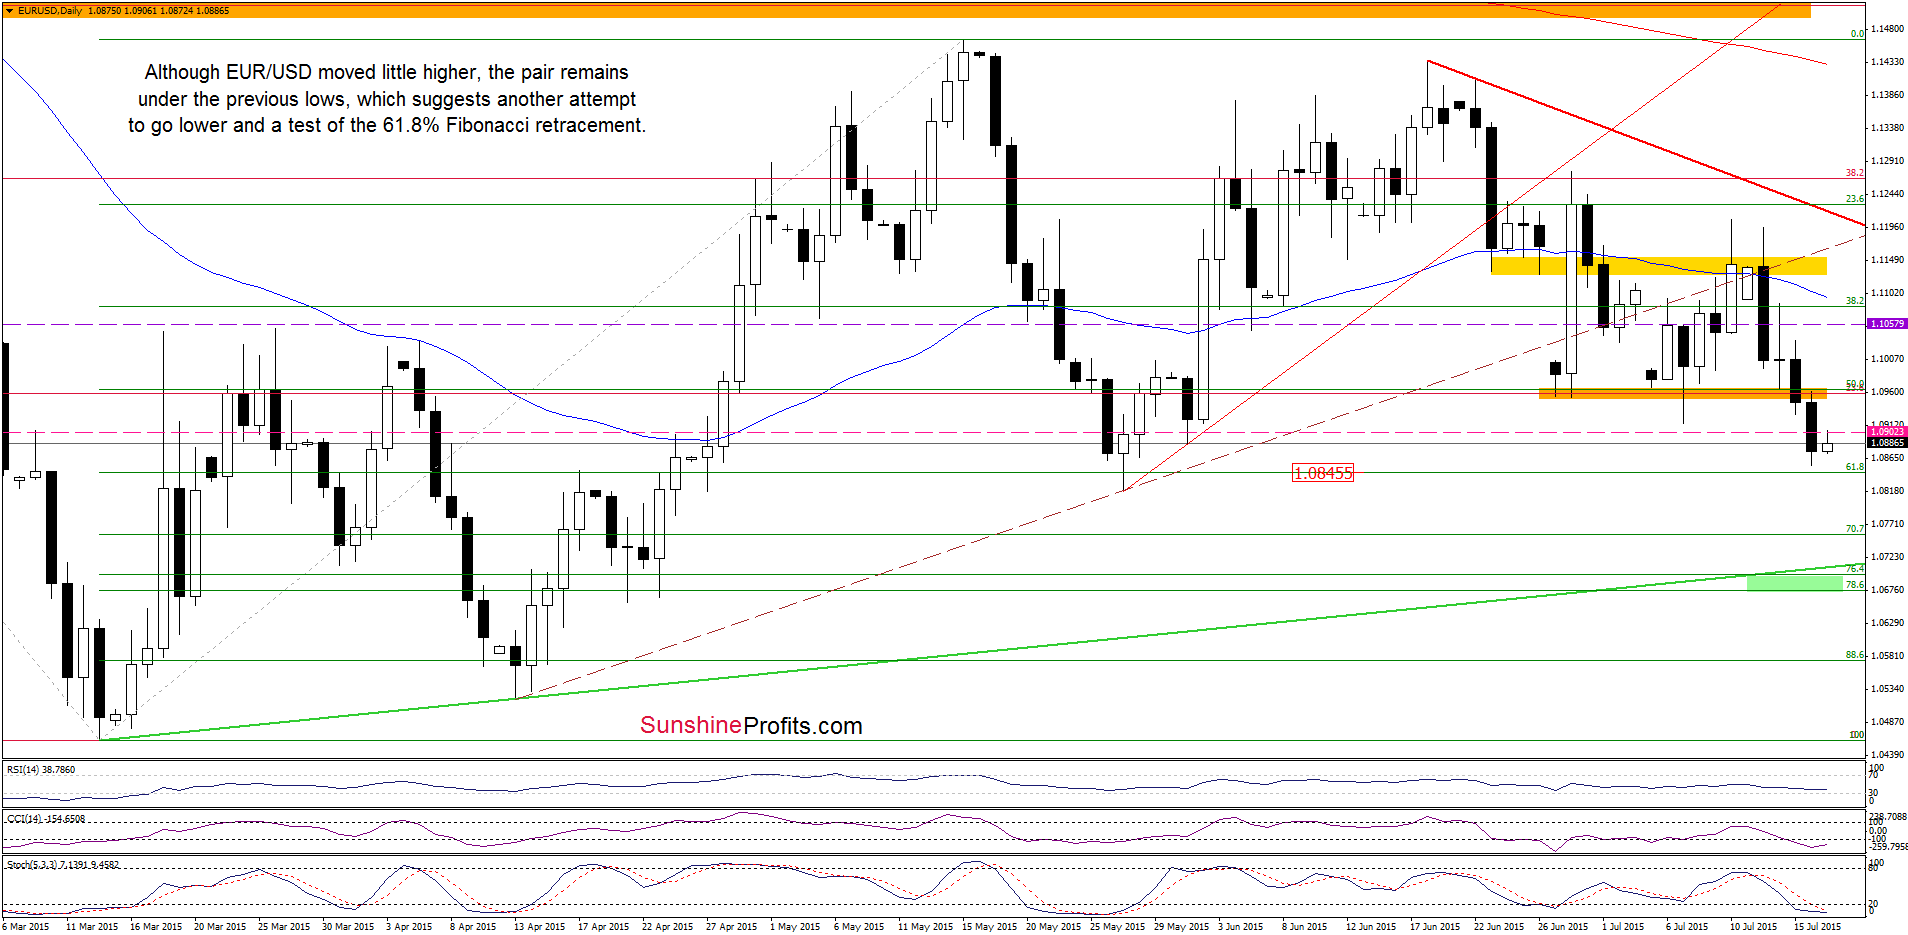
From this perspective, we see that the proximity to the 61.8% Fibonacci retracement encouraged currency bulls to act, which translated to a small rebound earlier today. Despite this move, EUR/USD remains under the previous lows (the orange resistance zone), which suggests that we’ll see a test of the May low and the 61.8% Fibonacci retracement. If this area is broken, we may see a decline to the medium-term green support line (currently around 1.0707) or even to 1.0676-1.0698, where the green support zone (created by the 76.4% and 78.6% Fibonacci retracement levels) is.
Very short-term outlook: bearish
Short-term outlook: mixed with bearish bias
MT outlook: mixed
LT outlook: mixed
Trading position (short-term; our opinion): Short positions (with a stop-loss order at 1.1058) are justified from the risk/reward perspective at the moment. We will keep you informed should anything change, or should we see a confirmation/invalidation of the above.
GBP/USD
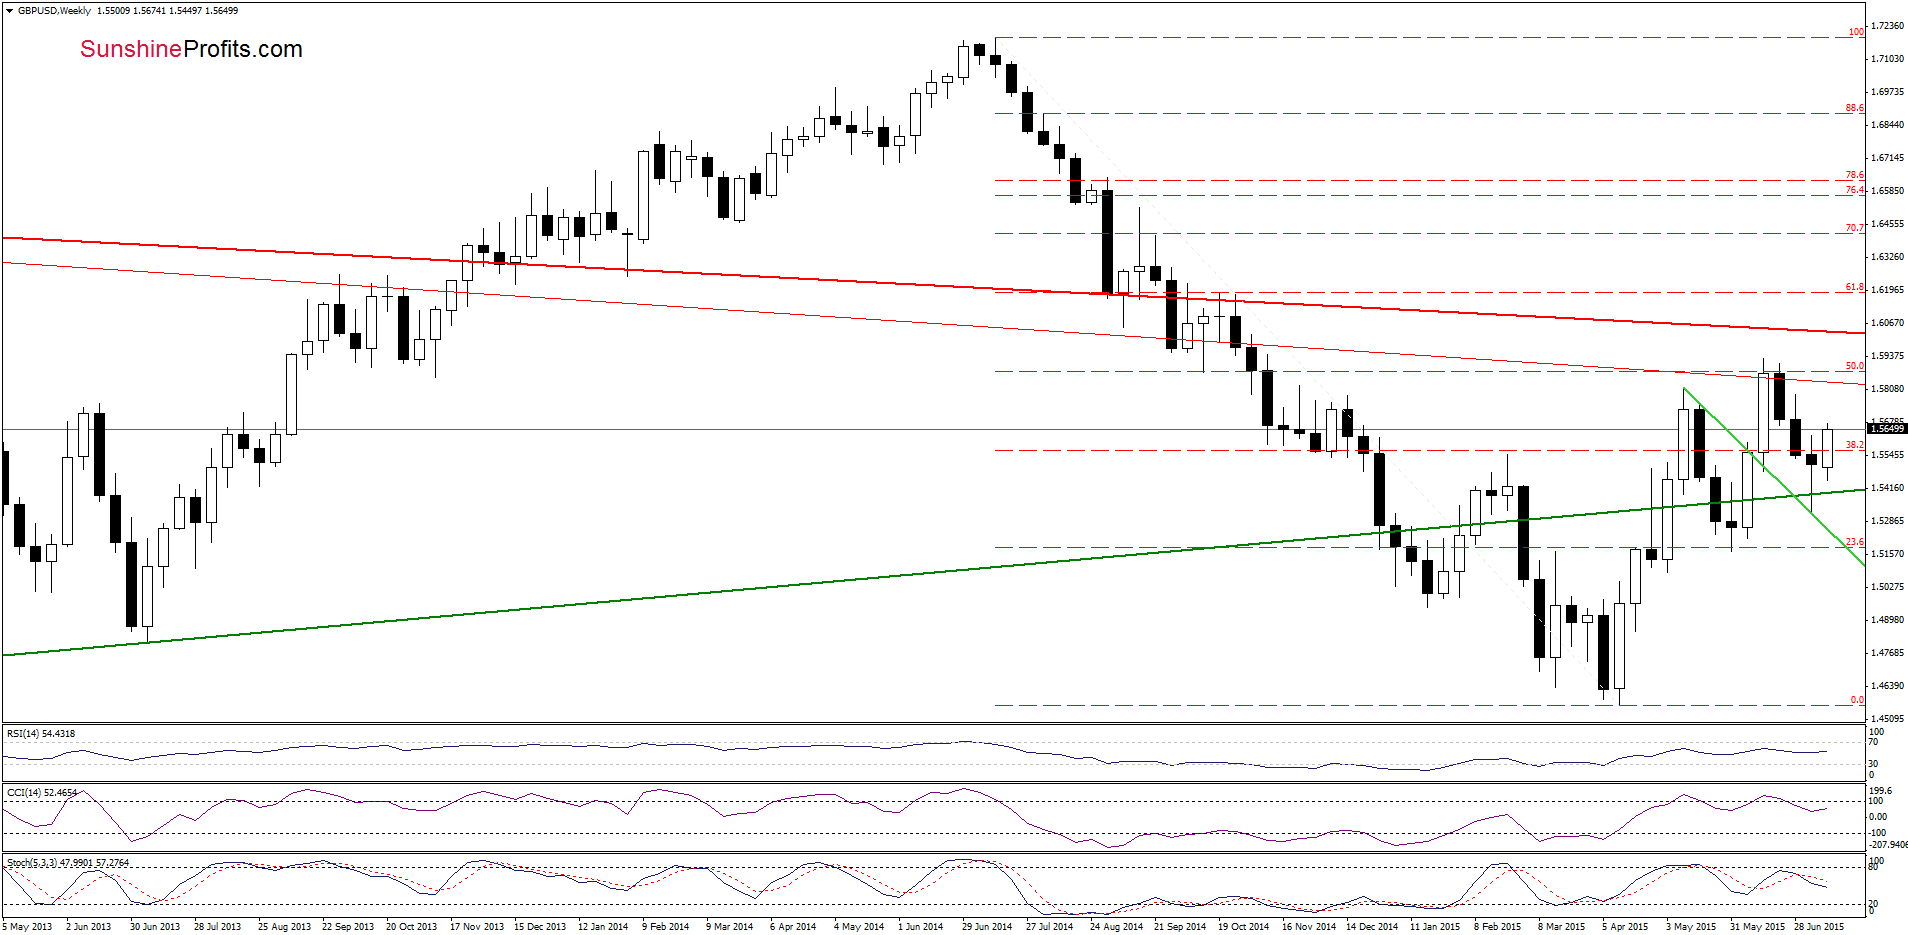
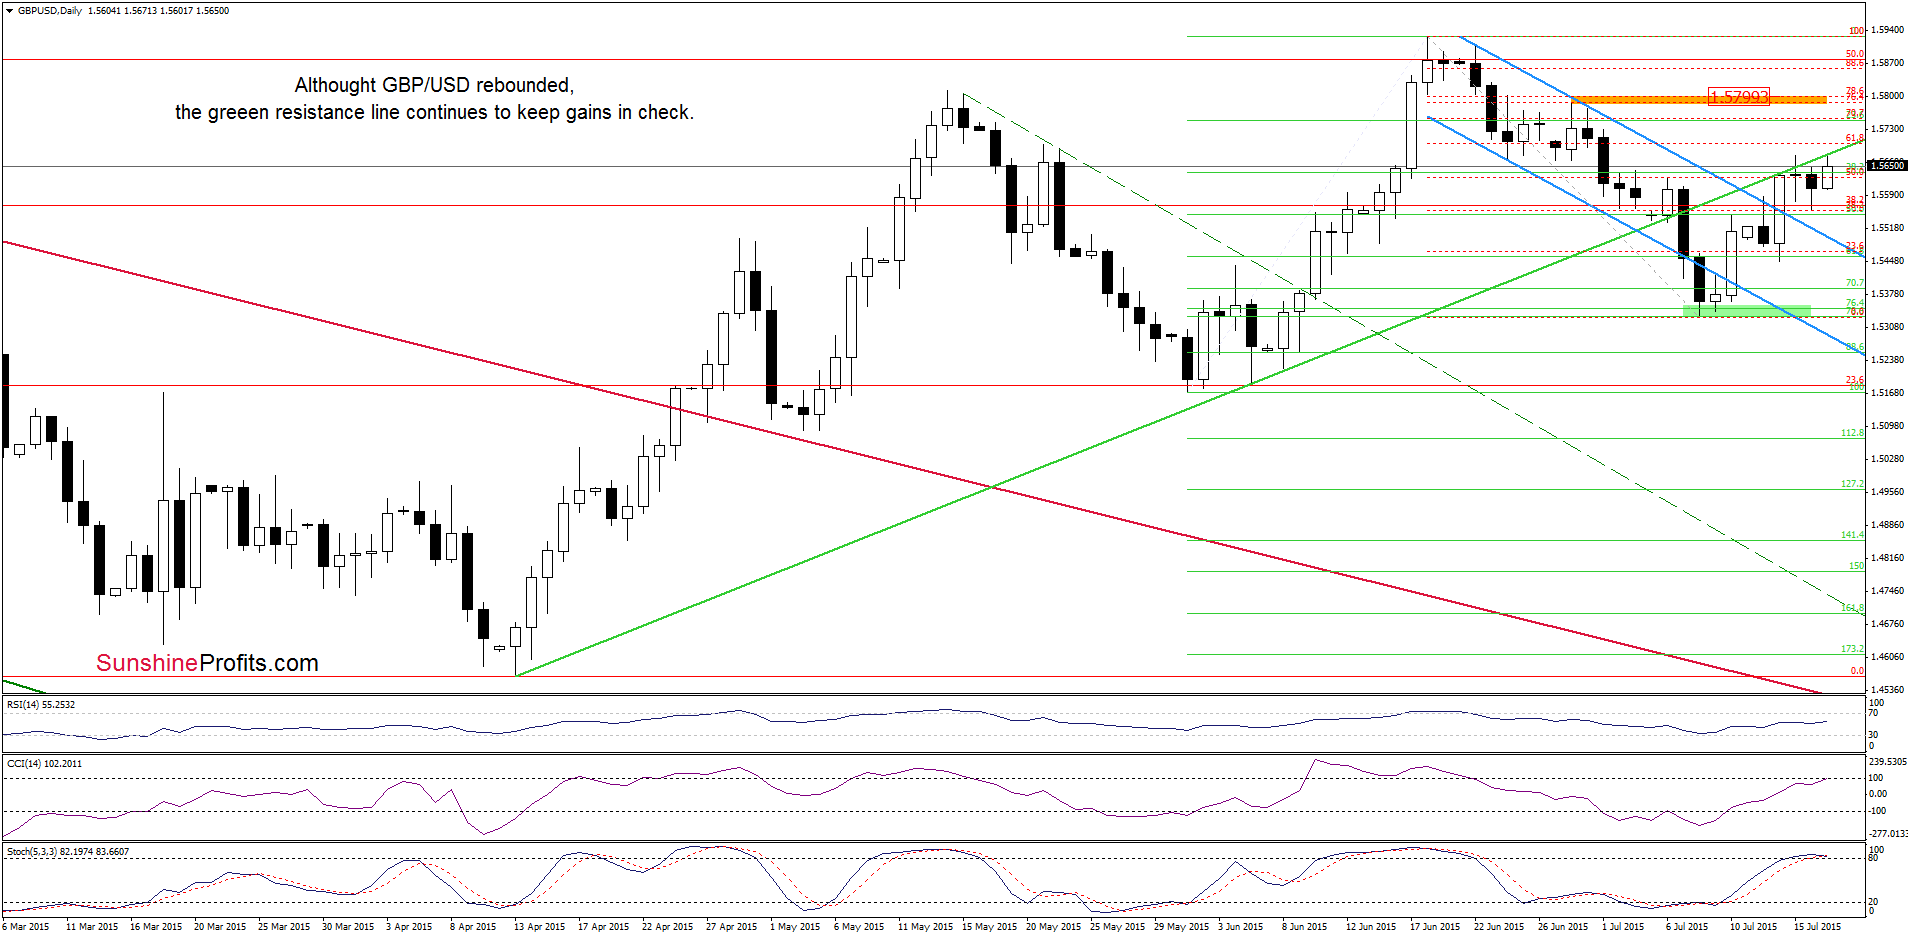
Looking at the daily chart, we see that although GBP/USD moved higher once again, erasing yesterday’s losses, the exchange rate is trading under the medium-term green line (it serves as resistance now). Therefore, in our opinion, further improvement will be more likely only if we see a breakout above it and the 61.8% Fibonacci retracement (around 1.5700). Nevertheless, taking into account the current position of the indicators (the CCI reached the level of 100, while the Stochastic Oscillator is very close to generating a sell signal), it seems that reversal in the coming day(s) should not surprise us. If we see such price action and GBP/USD moves lower from here, it would be a negative signal, which will suggest that the current upward move is just a verification of the breakdown below the medium-term green resistance line. In this case, we’ll likely see a decline to the previously-broken upper border of the declining blue trend channel (currently around 1.5500) in the coming week.
Very short-term outlook: mixed with bearish bias
Short-term outlook: mixed
MT outlook: mixed
LT outlook: mixed
Trading position (short-term; our opinion): No positions are justified from the risk/reward perspective at the moment. We will keep you informed should anything change, or should we see a confirmation/invalidation of the above.
USD/JPY
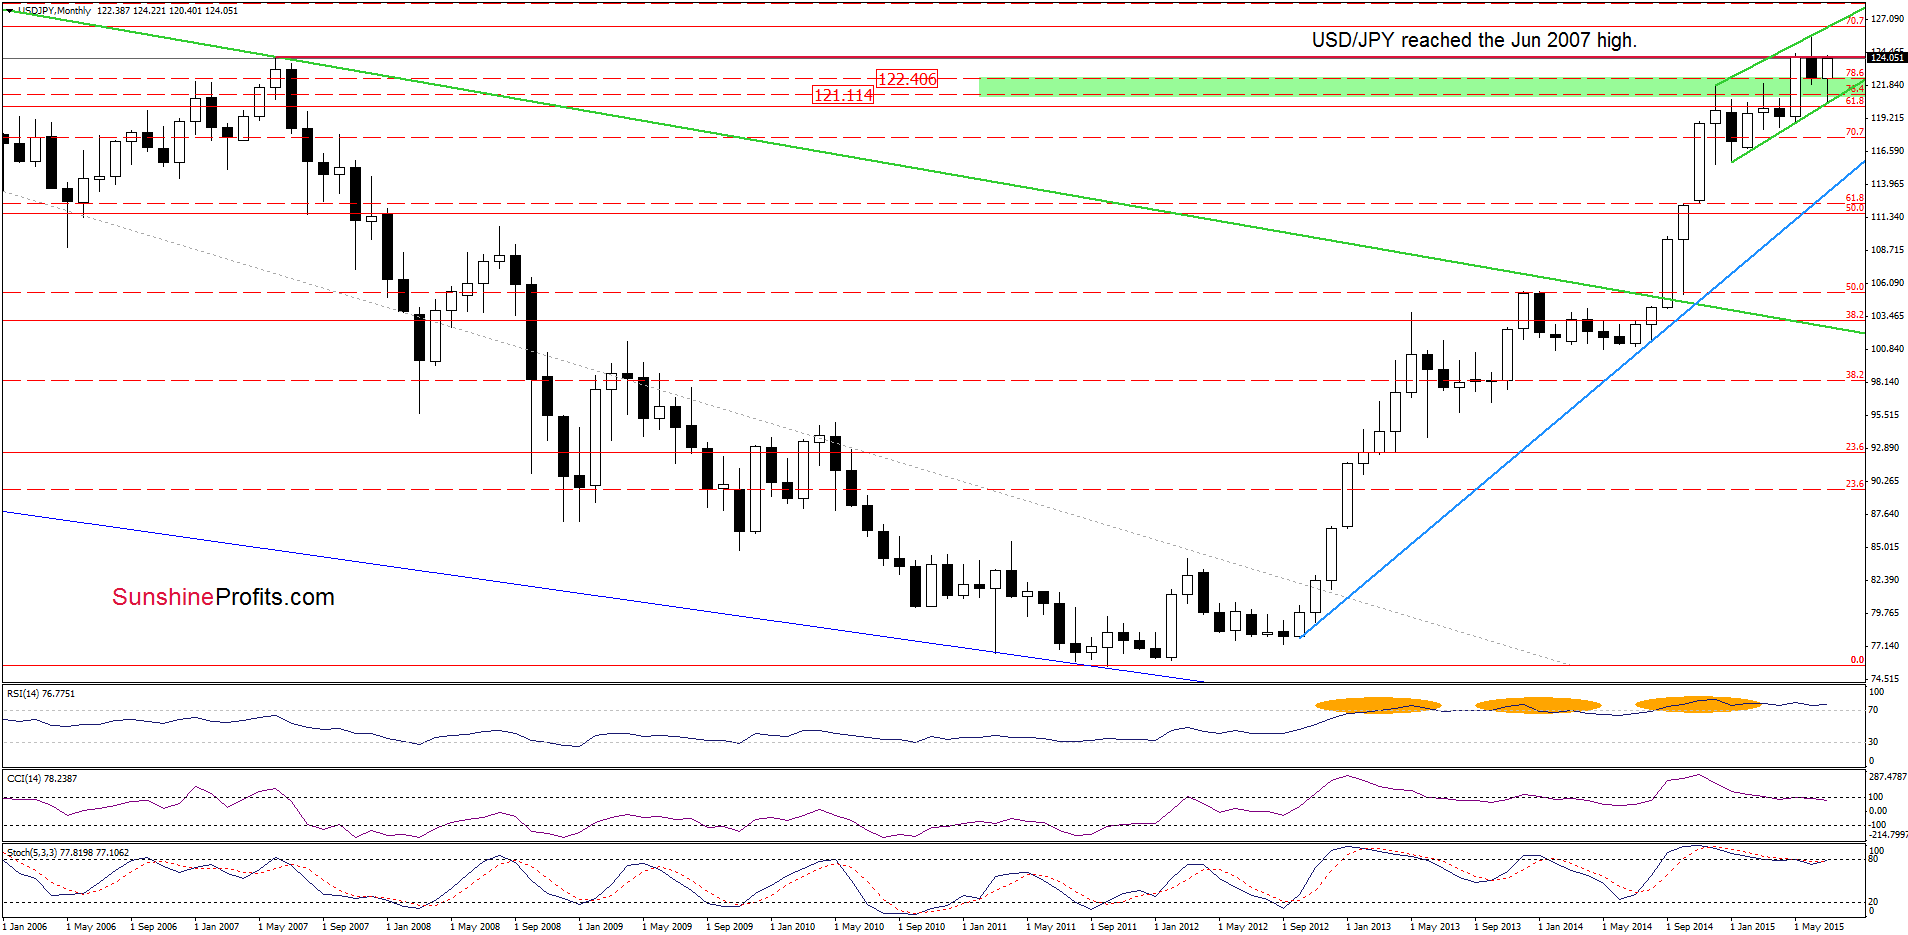
On Wednesday, we wrote:
(…) USD/JPY extended gains and broke above the upper line of the green zone, which suggests that we’ll likely see a test of the June 2007 high of 124.13 in the coming week.
As you see on the weekly chart, the situation developed in line with the above scenario and the pair reached our upside target.
What impact did this increase have on the very short-term picture? Let’s check.
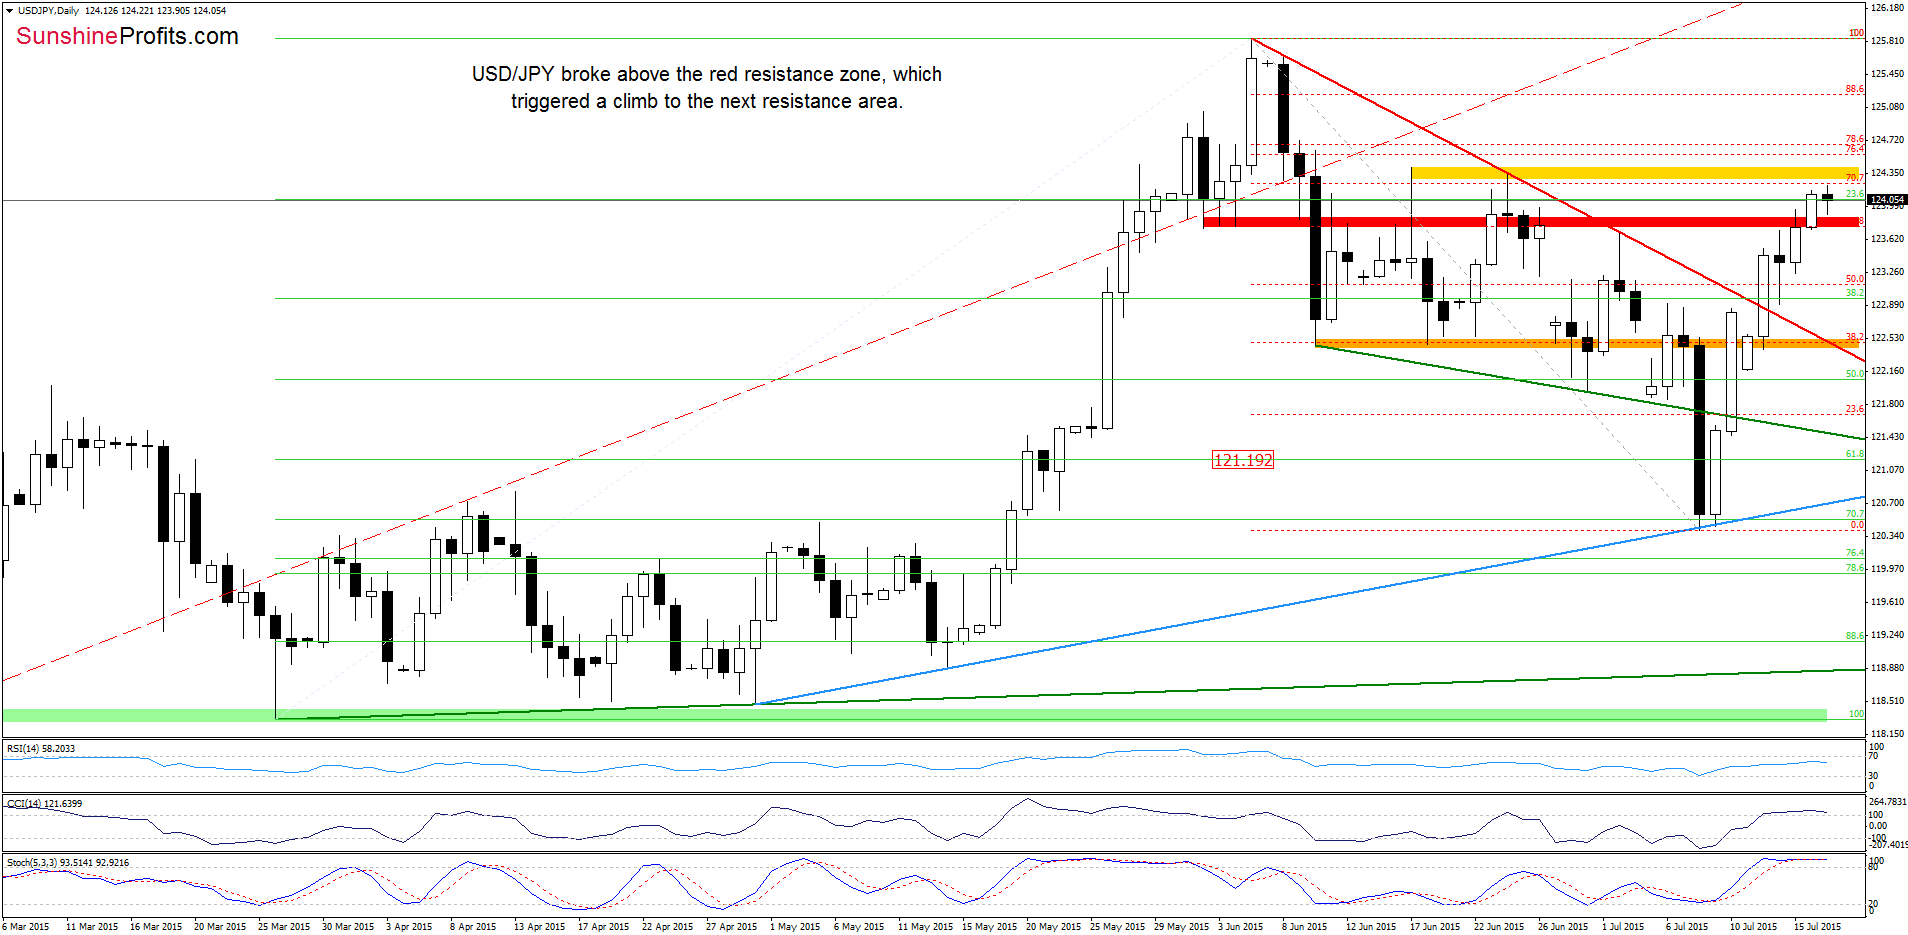
The first thing that catches the eye on the daily chart is a breakout above the red resistance zone. Although this is a positive signal, which suggests further improvement, USD/JPY remains under the yellow resistance area (based on the Jun 17and Jun 24 high) reinforced by the 70.7% Fibonacci retracement. Even if currency bulls manage to push the pair above it, we should keep in mind that slightly above this area are also the 76.4% and 78.6% Fibonacci retracement levels, which together could stop further rally. Taking this fact into account, and combining it with the medium-term resistance level (the Jun 2007 high of 124.13) and the position of daily indicators (the CCI and Stochastic Oscillator are overbought and close to generating sell signals), it seems that reversal is just around the corner.
Very short-term outlook: mixed with bearish bias
Short-term outlook: mixed
MT outlook: mixed
LT outlook: bullish
Trading position (short-term; our opinion): No positions are justified from the risk/reward perspective at the moment. We will keep you informed should anything change, or should we see a confirmation/invalidation of the above.
USD/CAD
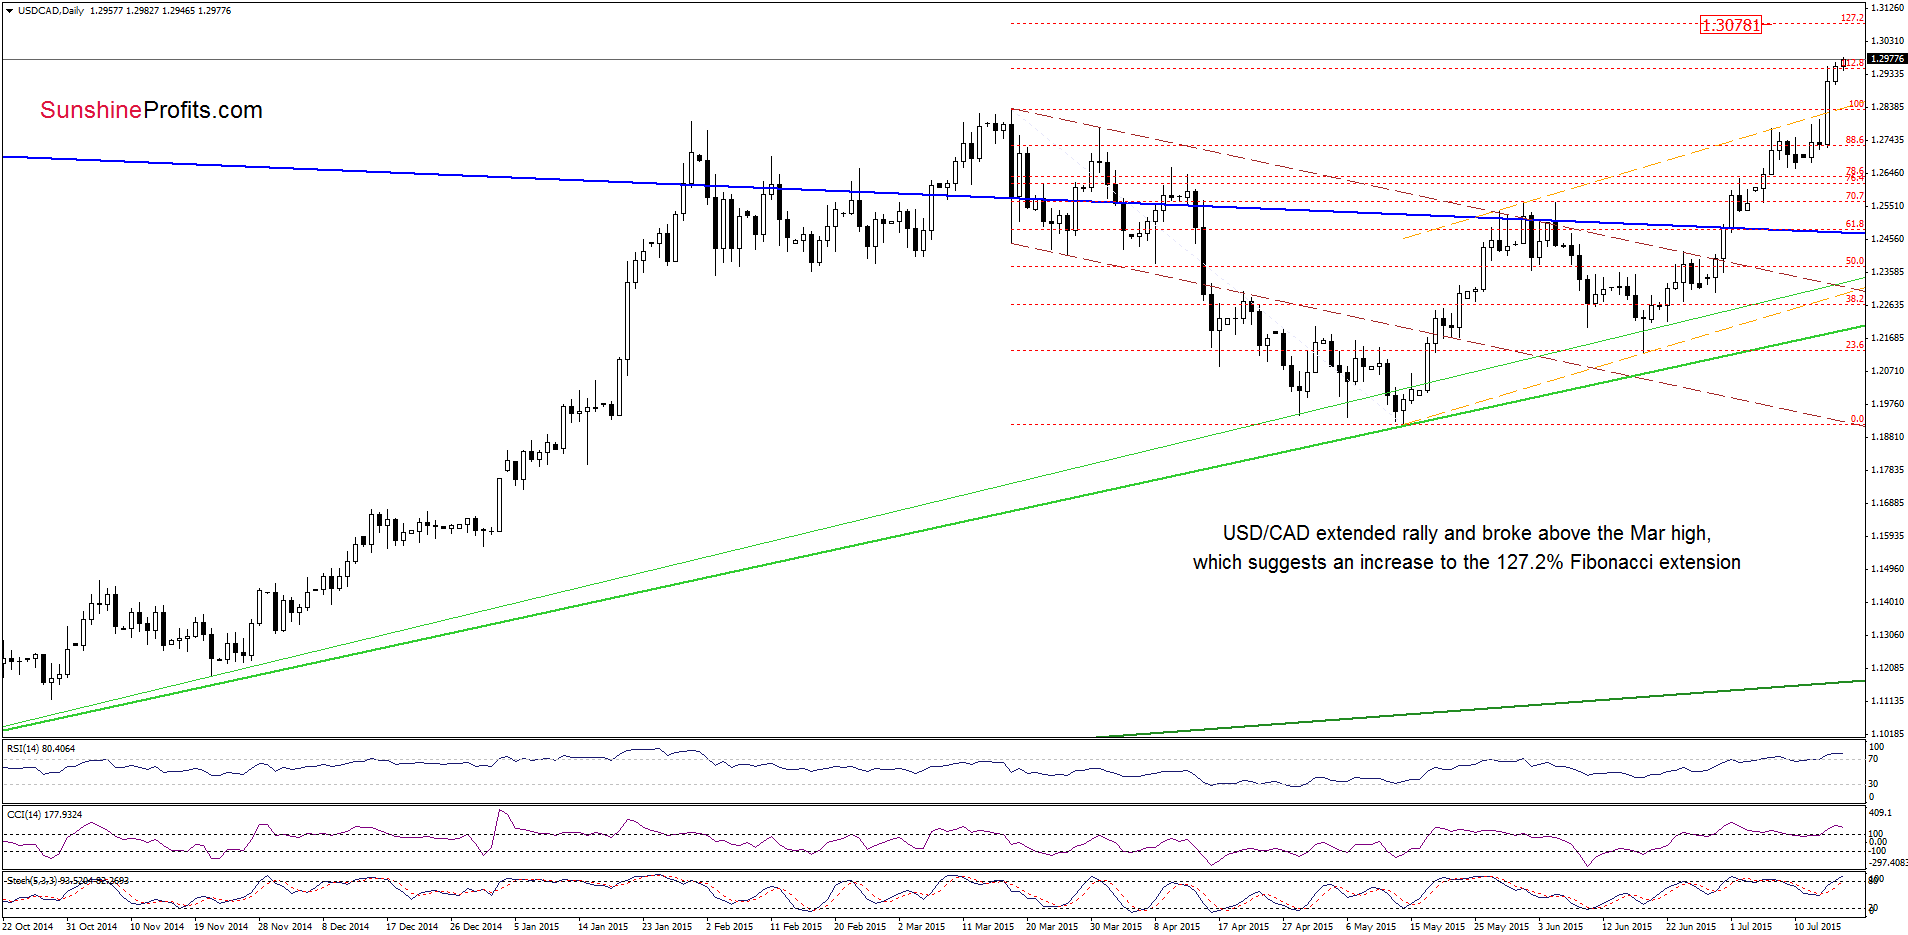
In the recent days, USD/CAD extended rally and climbed above the Mar high, which suggests further improvement and an increase to around 1.3078, where the 127.2% Fibonacci extension is. Nevertheless, we should keep in mind that the RSI increased above the level of 80 (for the first time since Jan), the Stochastic Oscillator is extremely overbought (above 90) and there is a negative divergence between the CCI and the exchange rate, which suggests that we may see a reversal and lower values of USD/CAD in the coming week.
Are there any other factors that could encourage currency bears to act? Let’s examine the weekly chart and find out.
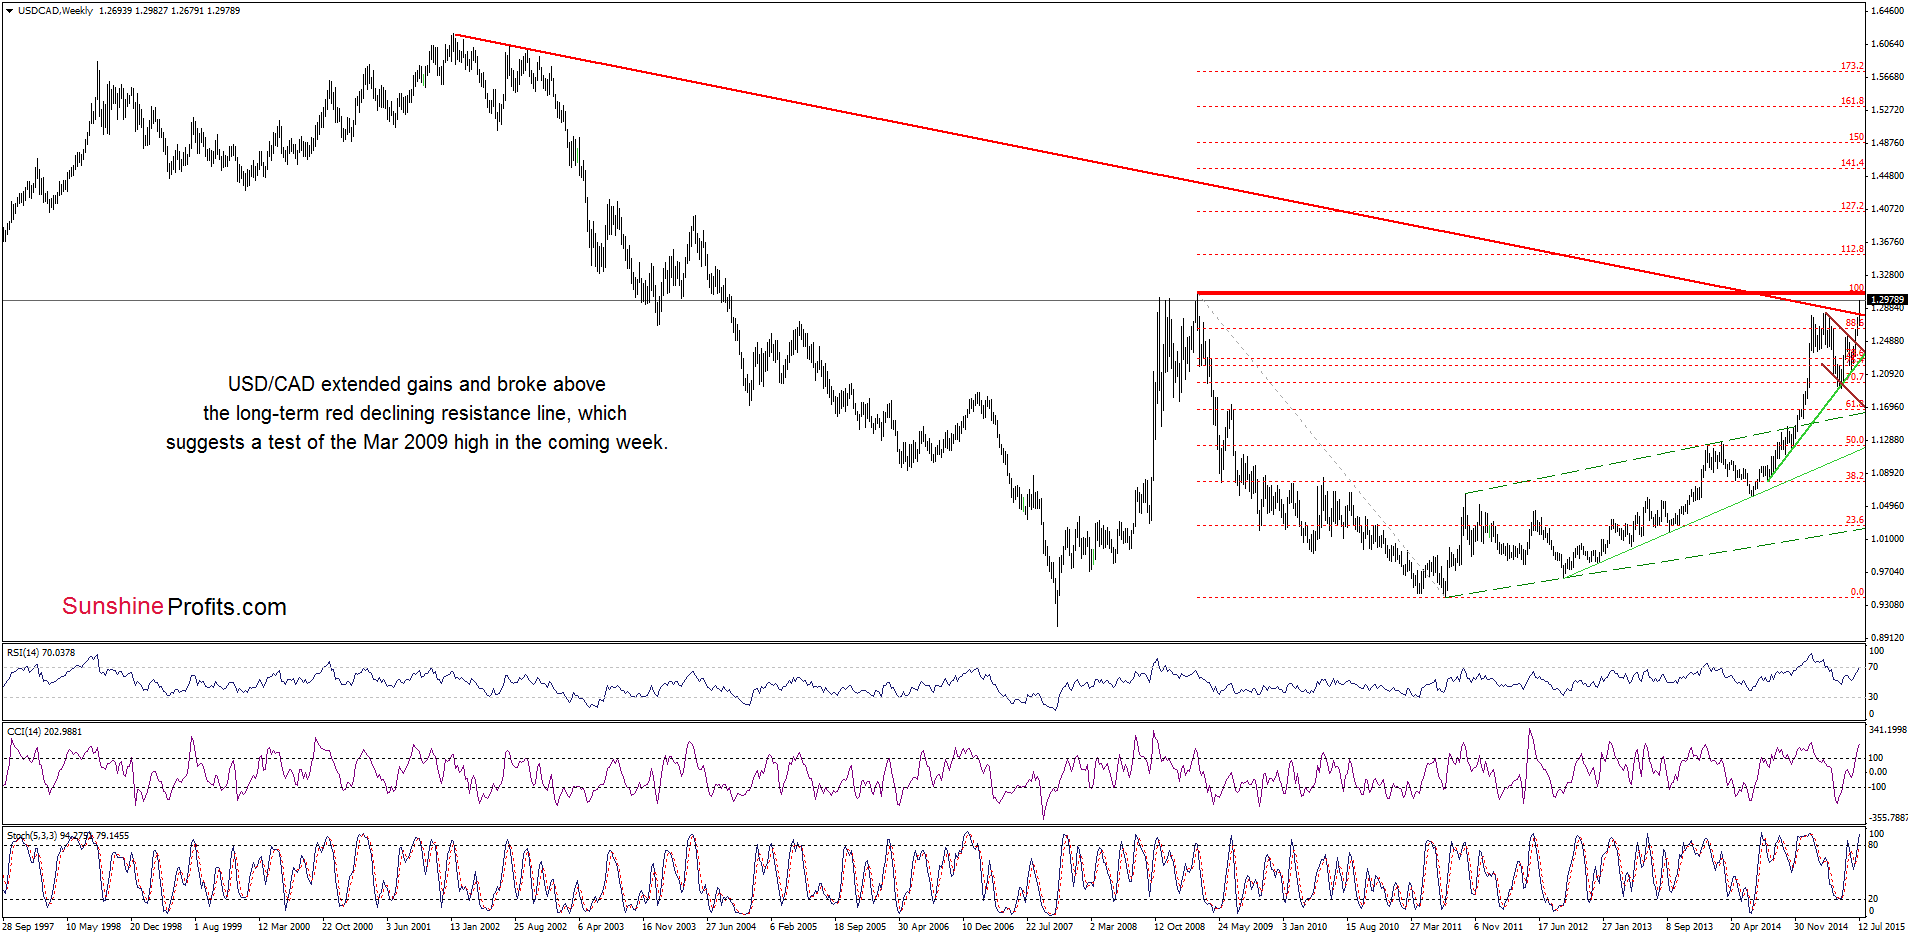
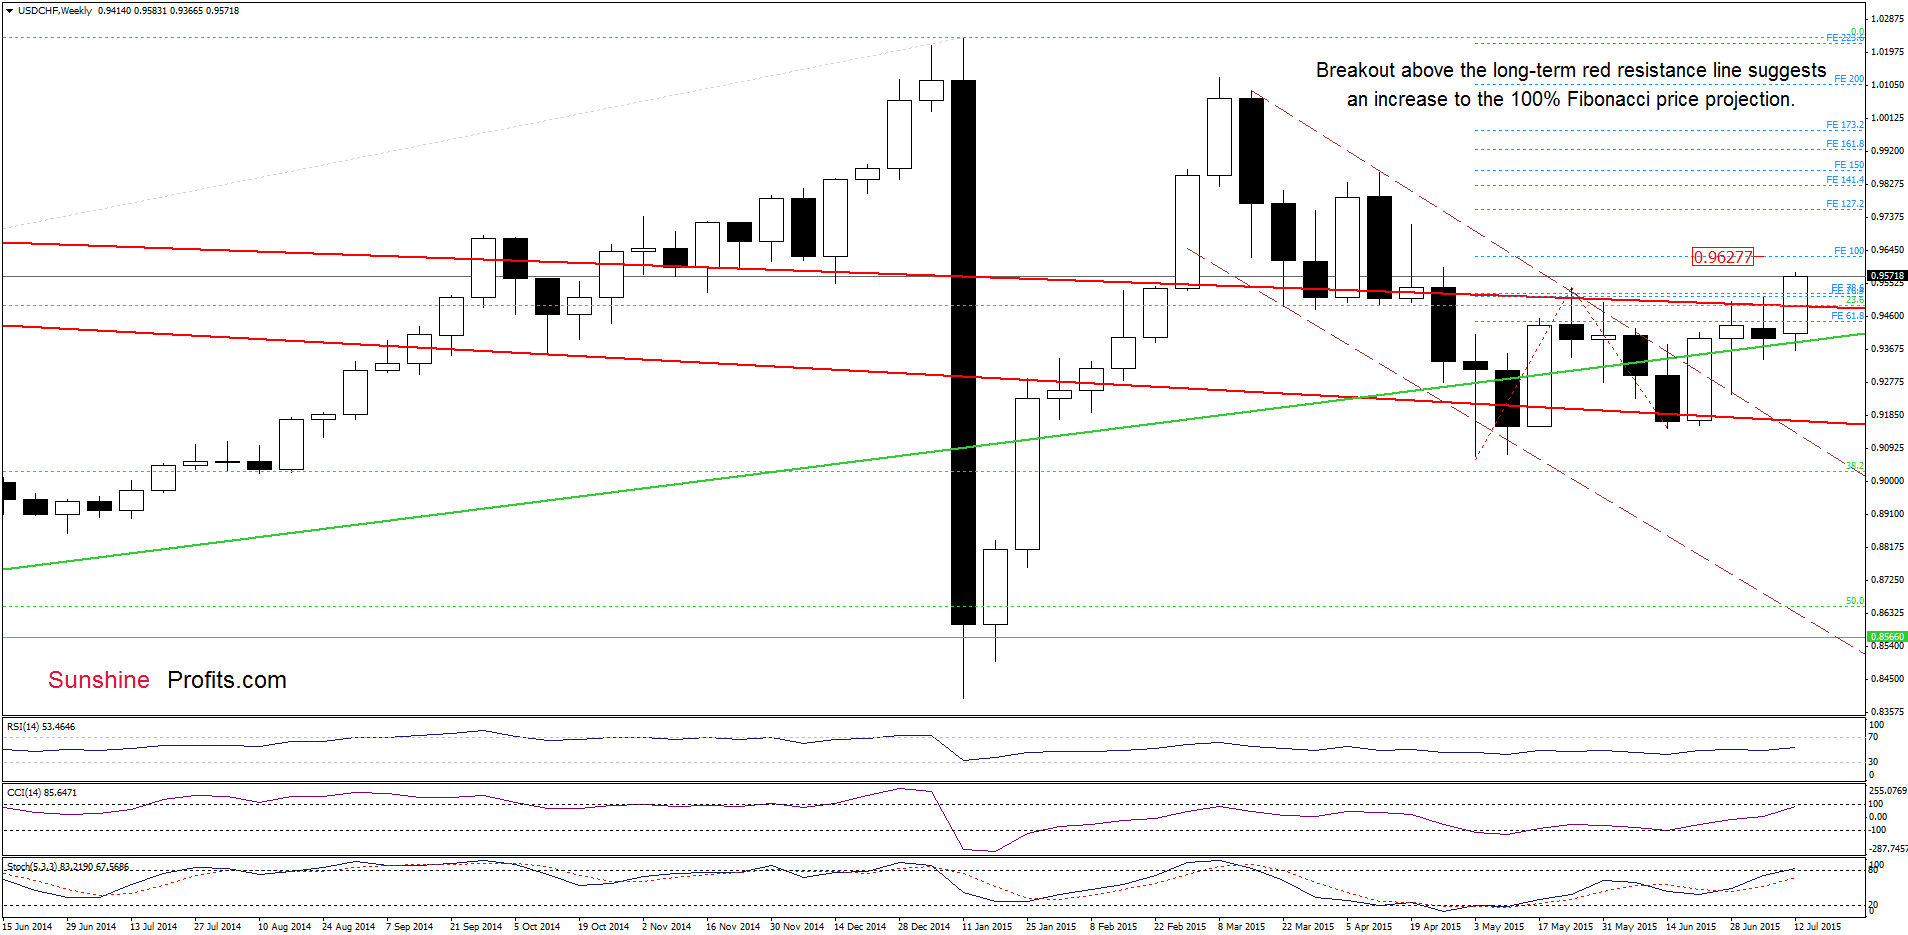
From this perspective, we see that although USD/CAD extended gains and broke above the long-term red declining resistance line, the pair remains under the Mar 2009 high, which serves as the nearest medium-term resistance. Therefore, we think that as long as the exchange rate is trading below it further rally is questionable. Additionally, there are negative divergences between the RSI, CCI and USD/CAD (while the Stochastic Oscillator is overbought), which increases the probability of reversal in the coming week.
Very short-term outlook: mixed
Short-term outlook: mixed with bearish bias
MT outlook: mixed with bearish bias
LT outlook: mixed
Trading position (short-term; our opinion): No positions are justified from the risk/reward perspective at the moment. We will keep you informed should anything change, or should we see a confirmation/invalidation of the above.
USD/CHF
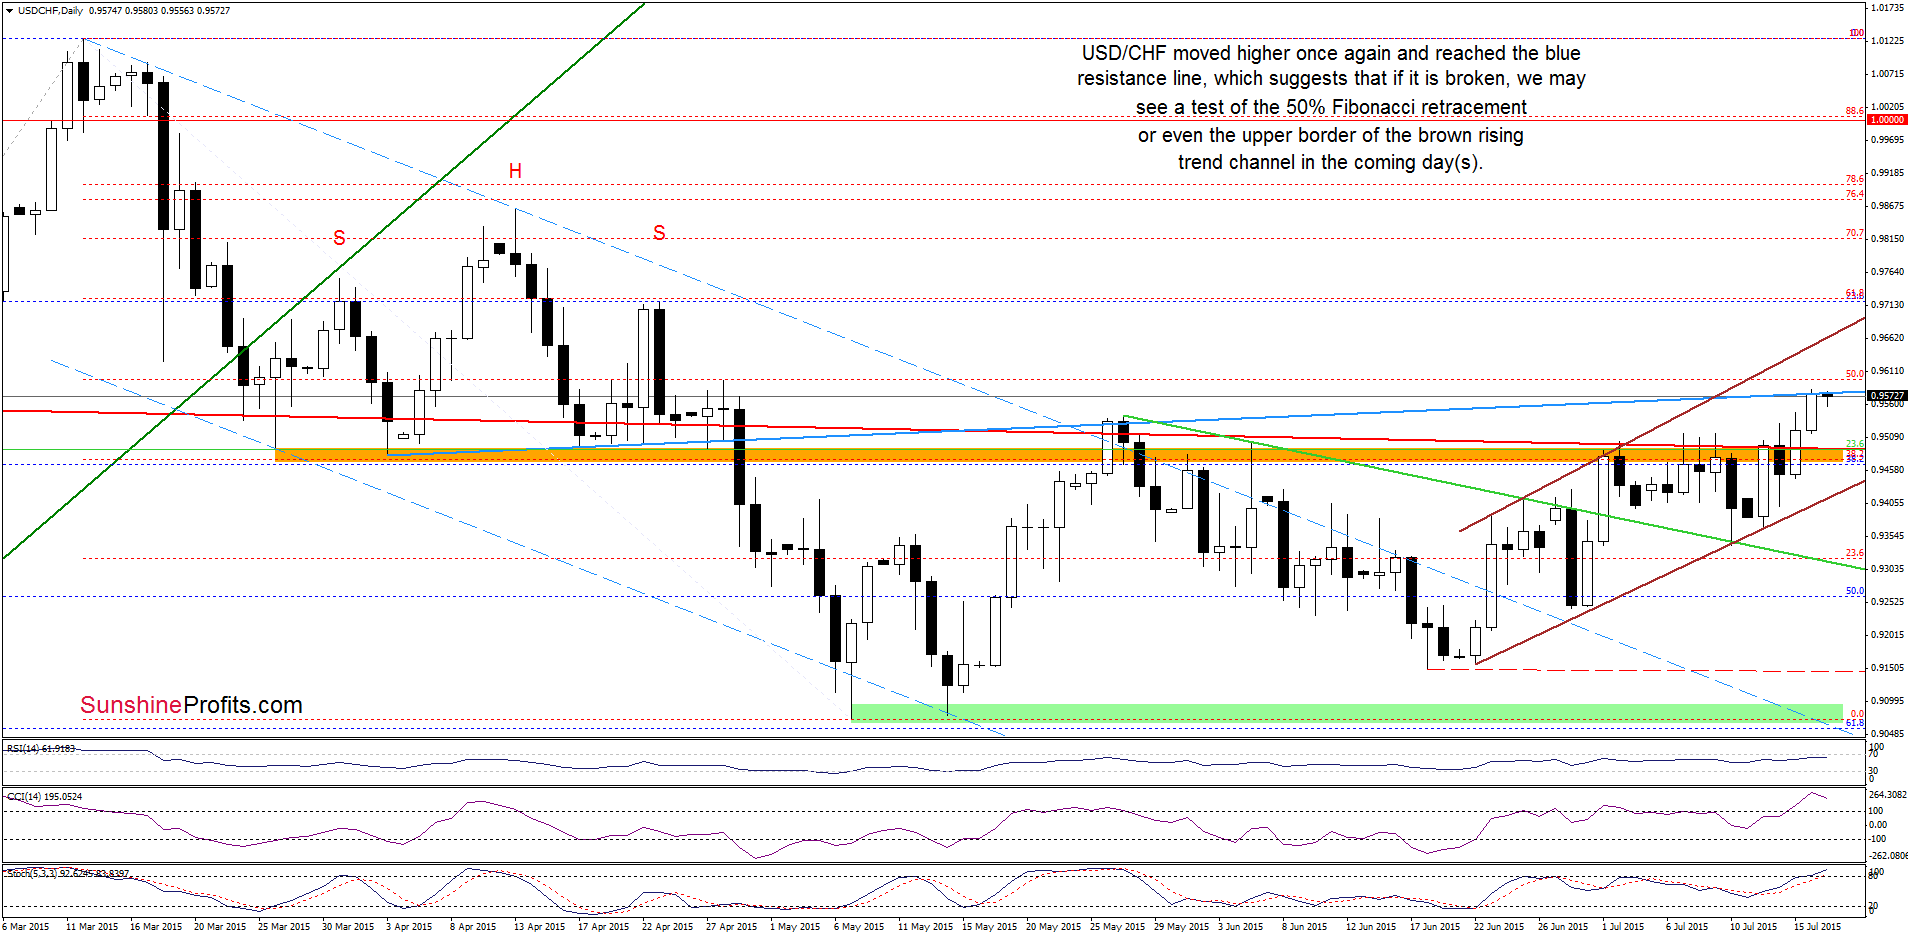
Looking at the daily chart we see that USD/CHF moved higher once again and reached the blue line (the previously-broken neck line of the head and shoulders formation). Although this resistance (in combination with the proximity to the 50% Fibonacci retracement ) could stop further improvement, it seems that as long as there are no sell signals generated by the indicators another attempt to move higher is likely. If this is the case, and the pair increases from here, we may see an upswing to around 0.9627 (the 100% Fibonacci price projection marked with blue on the weekly chart) or even to the upper border of the rising trend channel (currently around 0.9662) in the coming days.
Very short-term outlook: mixed with bullish bias
Short-term outlook: mixed with bullish bias
MT outlook: mixed
LT outlook: mixed
Trading position (short-term; our opinion): No positions are justified from the risk/reward perspective at the moment. We will keep you informed should anything change, or should we see a confirmation/invalidation of the above.
AUD/USD
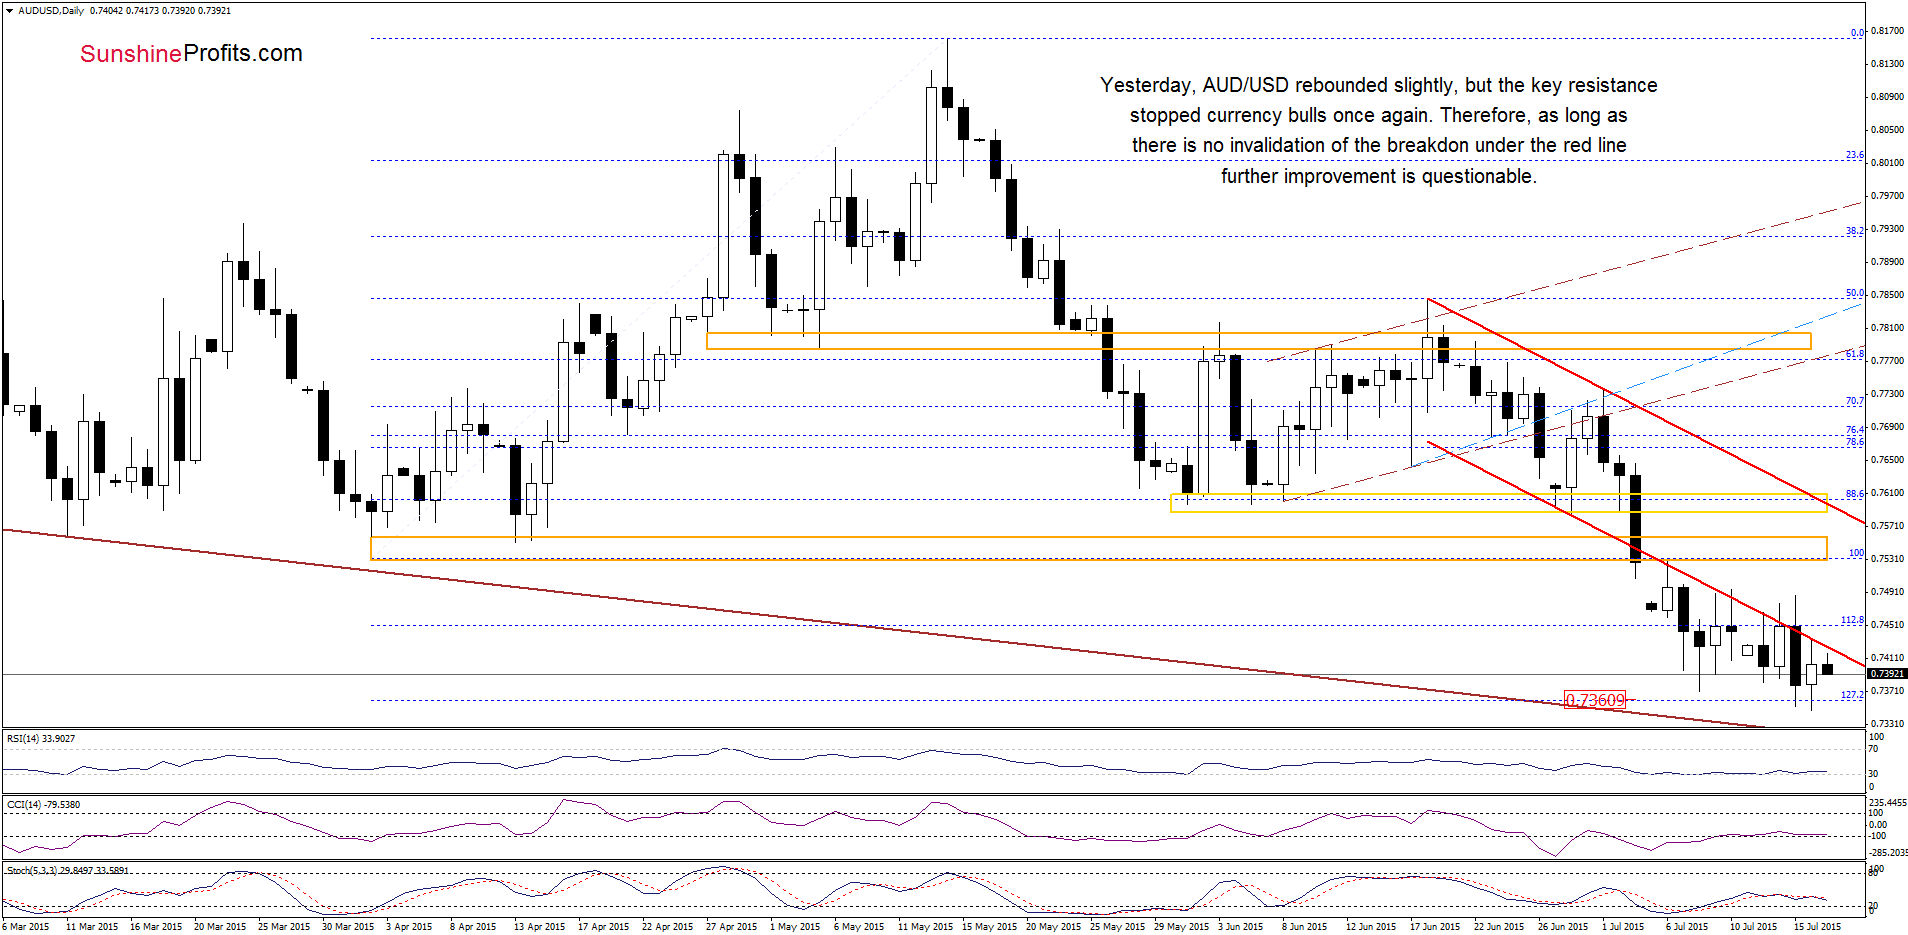
Looking at the daily chart, we see that although AUD/USD moved higher yesterday, currency bulls didn’t manage to push the pair above the major resistance line. As a result, the exchange rate reversed and declined earlier today, which means that yesterday’s upswing could be nothing more than another verification of the breakdown. Therefore, we believe that what we wrote yesterday is up-to-date also today:
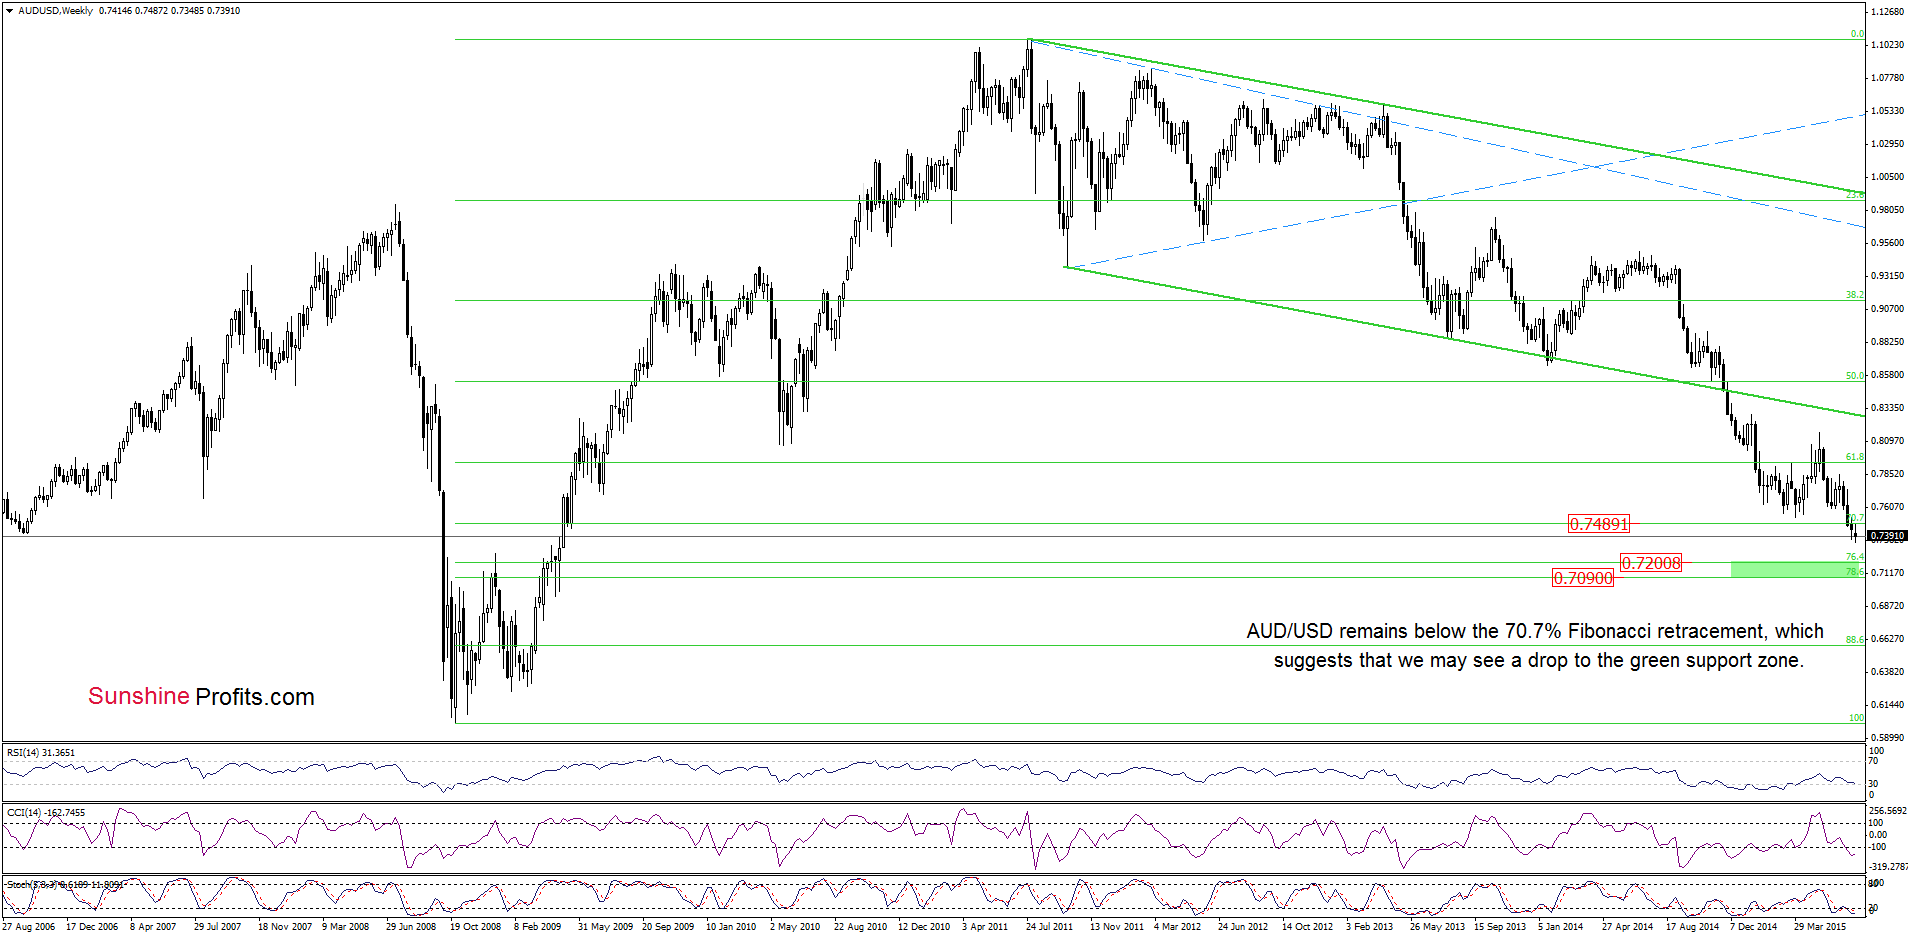
(…) we maintain our assumption that as long as there is no invalidation of the breakdown below the red declining resistance line another pullback is likely. How low could the pair go? If today’s low is broken, the next target would be around 0.7320 where the brown support line is. However if currency bears manage to push the exchange rate lower, we may see a decline even to (around 0.7097-0.7200, where the green support zone based on the 76.4% and 78.6% Fibonacci retracement levels (marked on the weekly chart) is.
Very short-term outlook: mixed with bearish bias
Short-term outlook: mixed
MT outlook: mixed
LT outlook: mixed
Trading position (short-term; our opinion): No positions are justified from the risk/reward perspective at the moment. We will keep you informed should anything change, or should we see a confirmation/invalidation of the above.
Thank you.
Nadia Simmons
Forex & Oil Trading Strategist
Przemyslaw Radomski, CFA
Founder, Editor-in-chief
Gold & Silver Trading Alerts
Forex Trading Alerts
Oil Investment Updates
Oil Trading Alerts

