

Earlier today, the Office for National Statistics reported that the U.K. unemployment rate unexpectedly rose in May (the first increase since early 2013), which pushed the pound lower against the greenback. As a result, the exchange rate slipped below the medium-term resistance line, but is it enough to trigger a reversal?
In our opinion the following forex trading positions are justified - summary:
EUR/USD
The situation in the medium term hasn’t changed much as EUR/USD is trading in the consolidation under the previously-broken long-term red declining line. Today, we’ll focus on the very short-term picture.
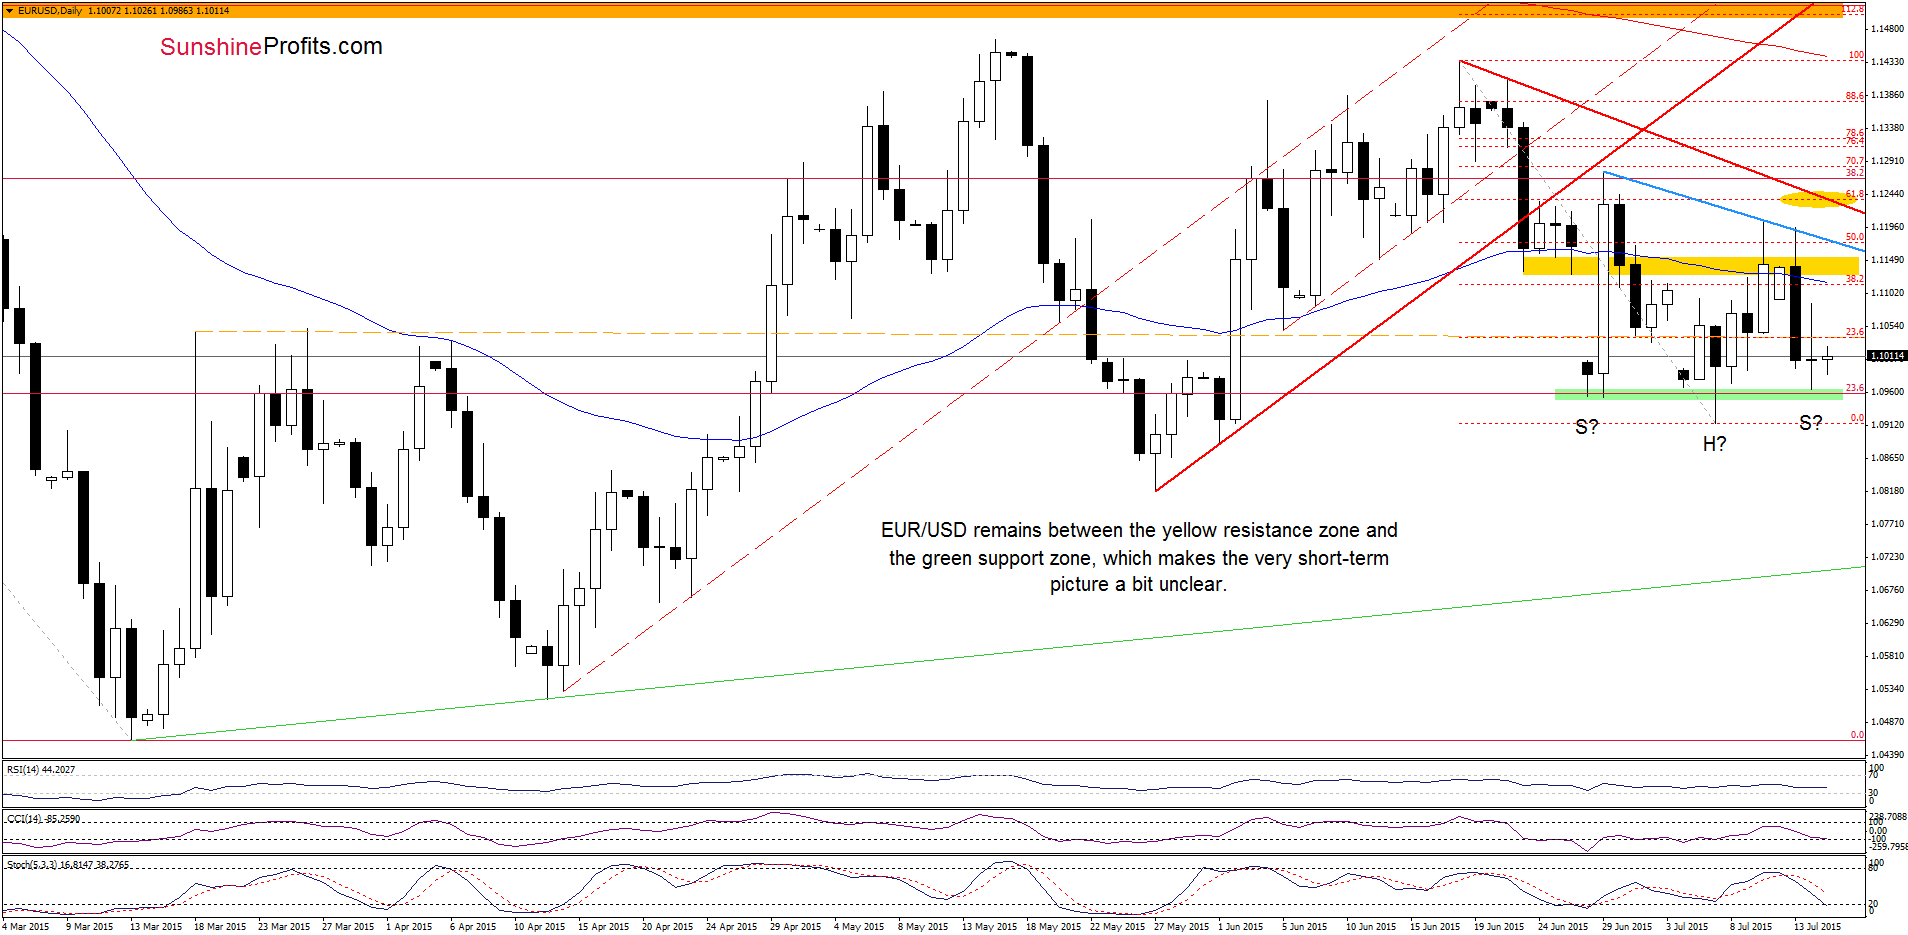
On the daily chart, we see that although EUR/USD moved higher, yesterday’s upswing didn’t change much and the exchange rate remains between the yellow resistance zone and the green support area. Therefore, what we wrote in our previous Forex Trading Alert is up-o-date also today:
(…) this area triggered a small rebound, which may be the beginning of the right shoulder of the reverse head and shoulders formation. Nevertheless, this assumption will bring a bigger upward move, only if we see a breakout above the blue line (the neck line of the formation) and the key resistance line marked on the weekly chart.
Very short-term outlook: mixed
Short-term outlook: mixed
MT outlook: mixed
LT outlook: mixed
Trading position (short-term; our opinion): No positions are justified from the risk/reward perspective at the moment. We will keep you informed should anything change, or should we see a confirmation/invalidation of the above.
GBP/USD
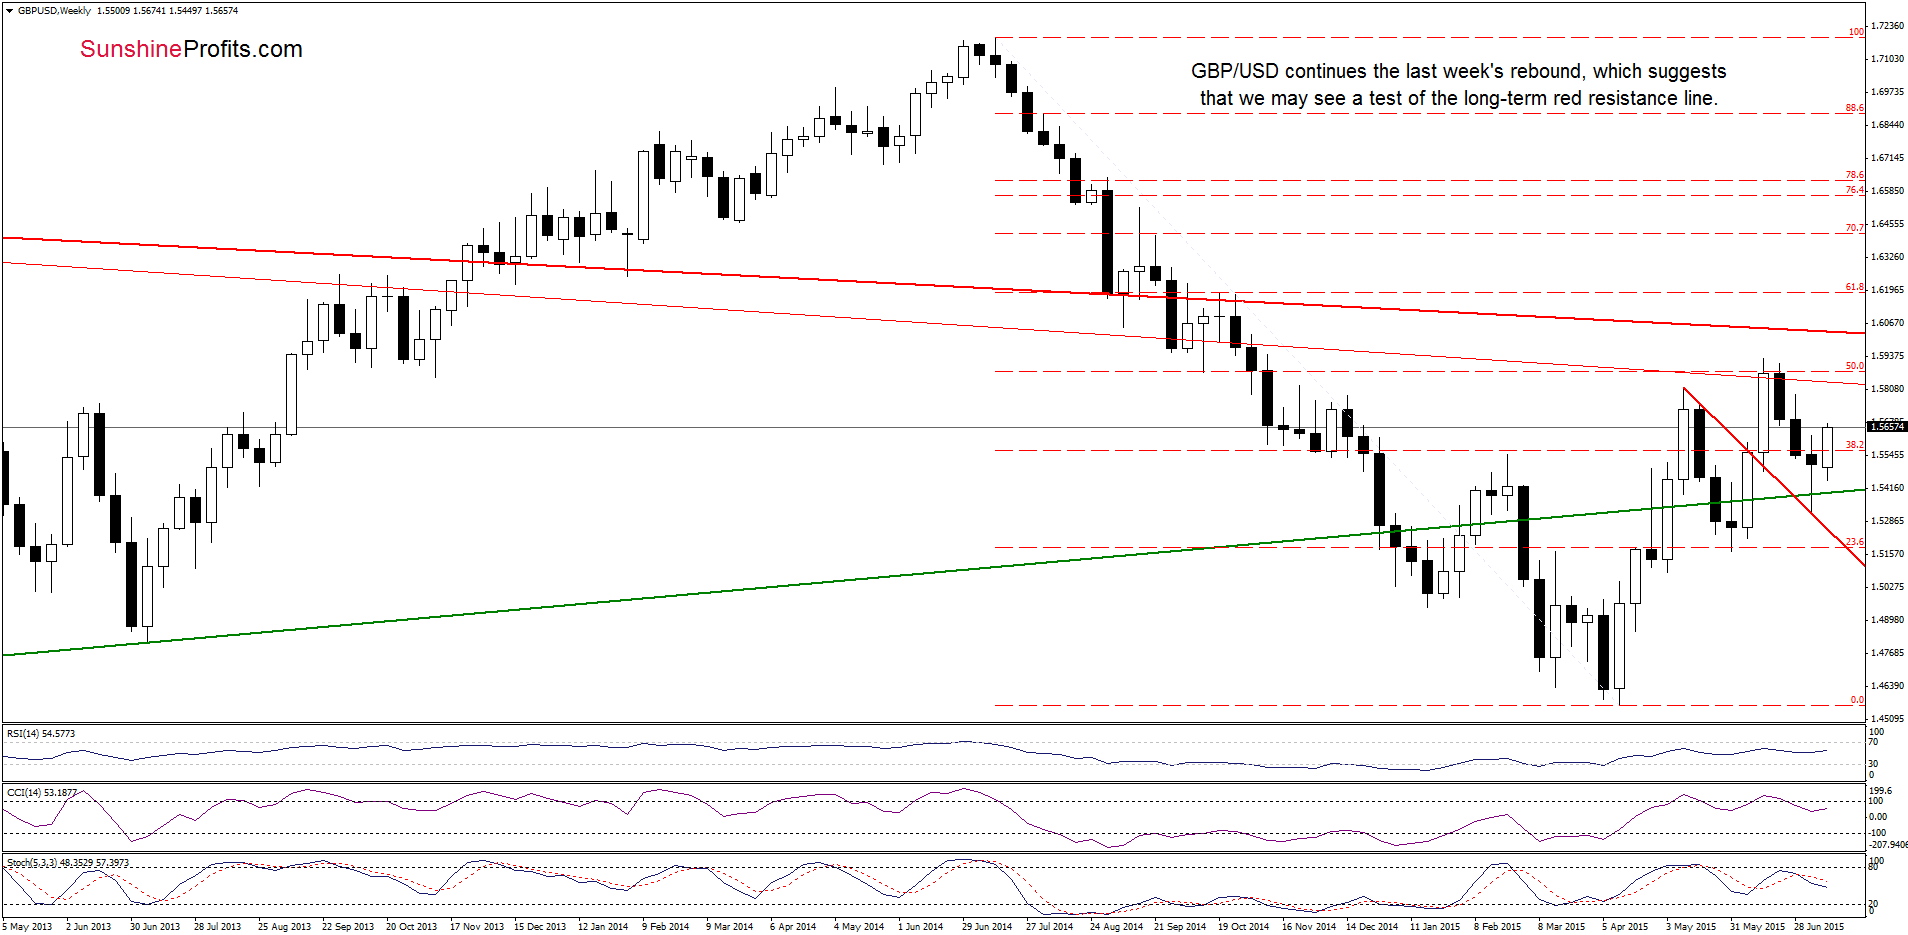
On the weekly chart, we see that GBP/USD continues the last week’s rebound, but will we see further rally? Let’s take a closer look at the daily chart and find out.
On Friday, we wrote the following:
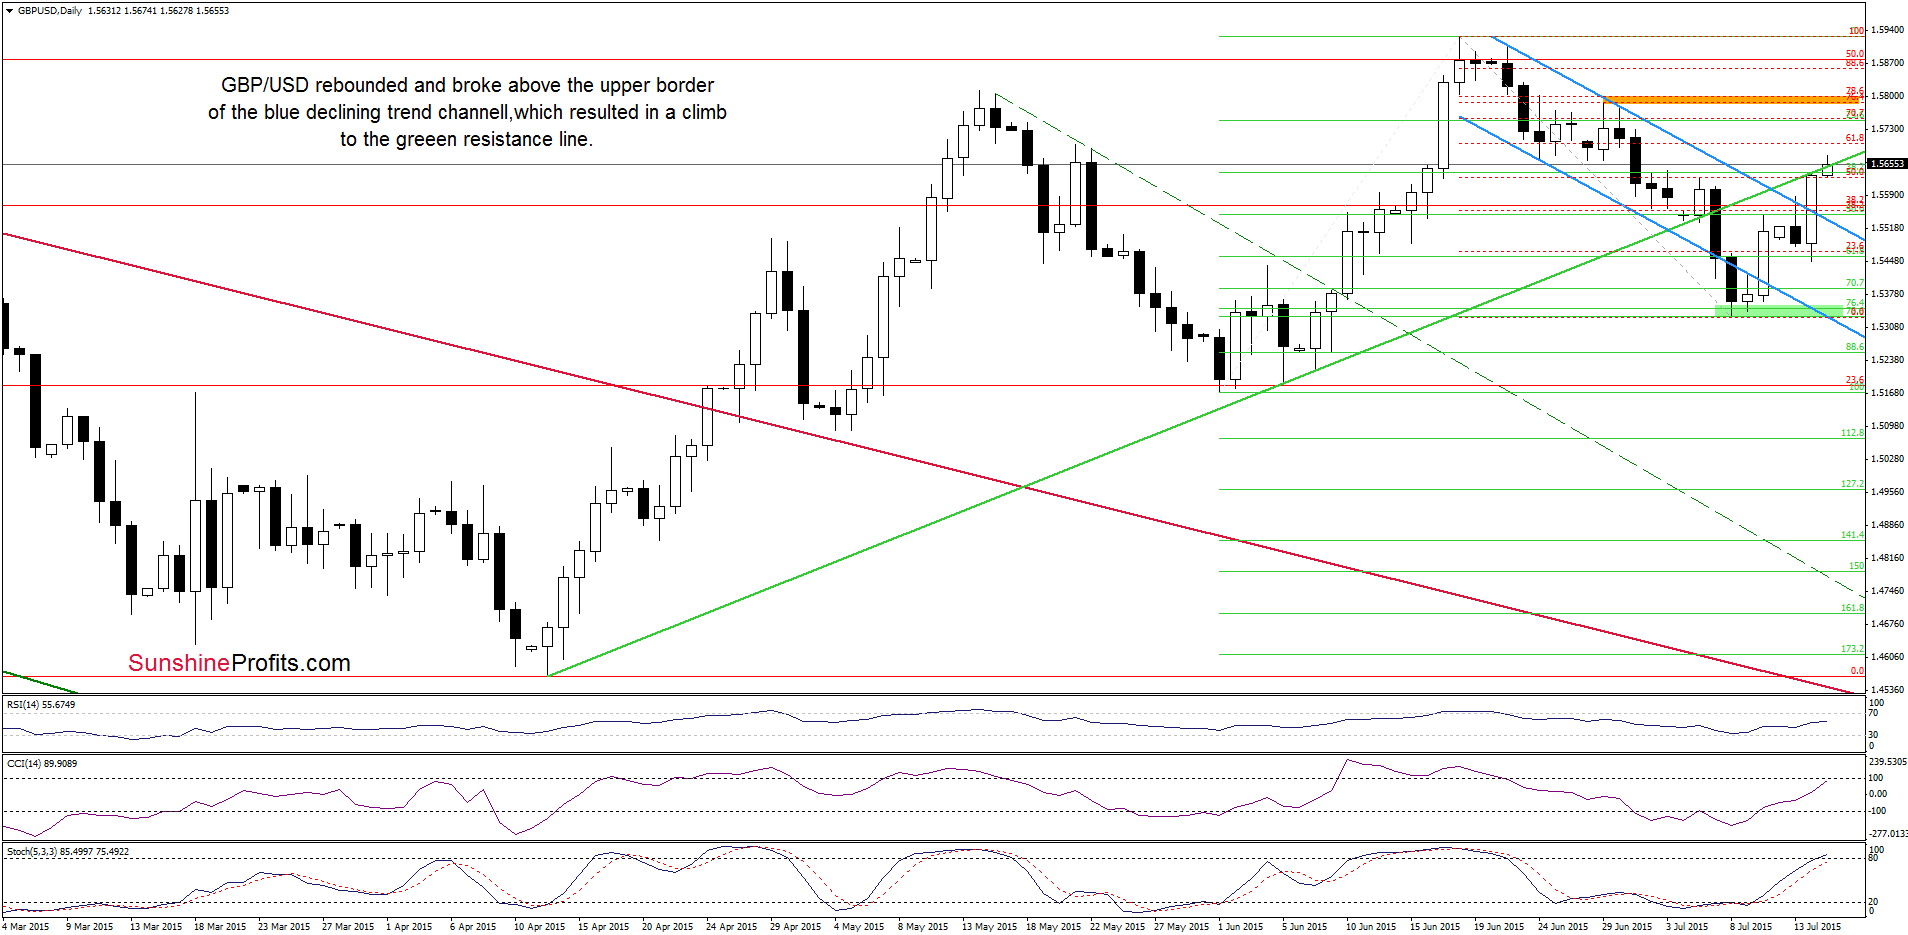
(…) the exchange rate invalidated earlier breakdown under the lower border of the blue declining trend channel, which is a positive signal that suggests further improvement. How high could the pair go? In our opinion, the initial upside target would be around 1.5593-1.5613
Looking at the daily chart, we see that the situation developed in line with the above scenario and the exchange rate reached our upside target yesterday. With this upswing, GBP/USD broke above the upper line of the trend channel and climbed to the medium-term green line (it serves as resistance now), which could stop further rally. However, taking into account the position of the indicators (buy signals remain in play) it seems that currency bulls will try to push the exchange rate higher. Nevertheless, in our opinion, further improvement will be more likely only if we see a breakout above the 61.8% Fibonacci retracement (around 1.5700). If we see such price action and GBP/USD moves higher from here, the upside target would be around 1.5784-1.5800, where the orange resistance zone (created by the 76.4% and 78.6% Fibonacci retracement levels and the Jun 29 high) is.
Very short-term outlook: mixed with bullish bias
Short-term outlook: mixed
MT outlook: mixed
LT outlook: mixed
Trading position (short-term; our opinion): No positions are justified from the risk/reward perspective at the moment. We will keep you informed should anything change, or should we see a confirmation/invalidation of the above.
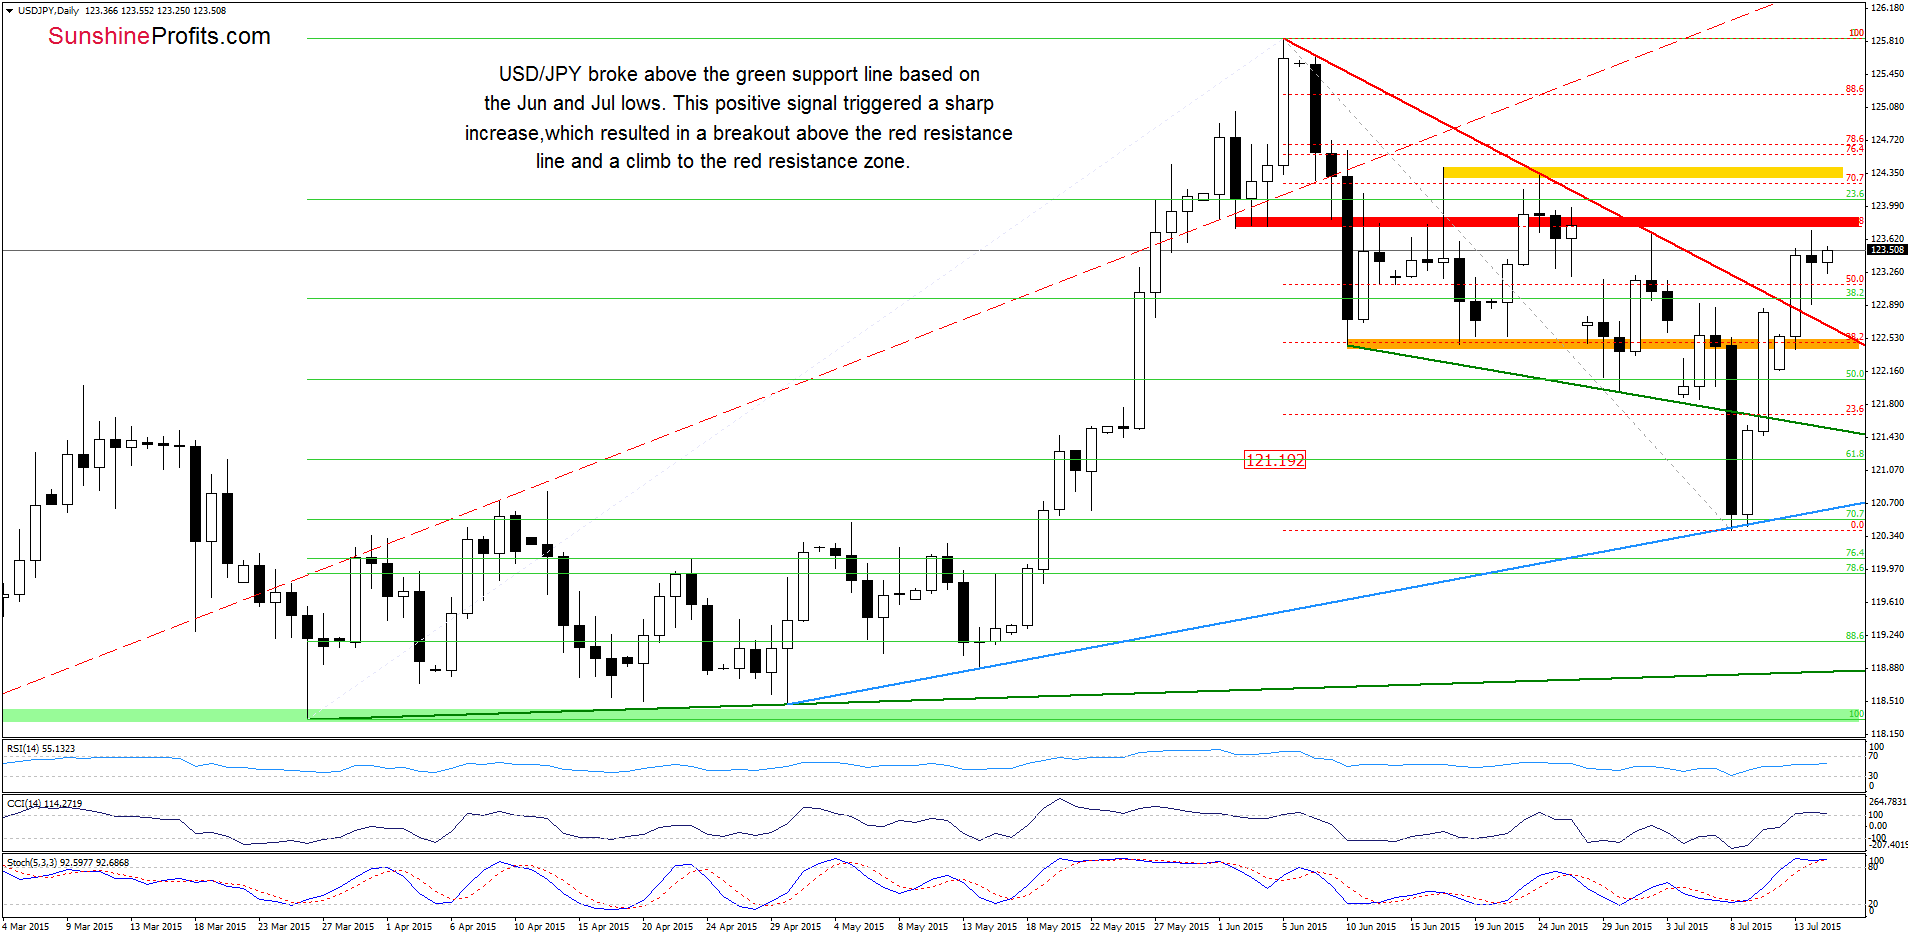
USD/JPY
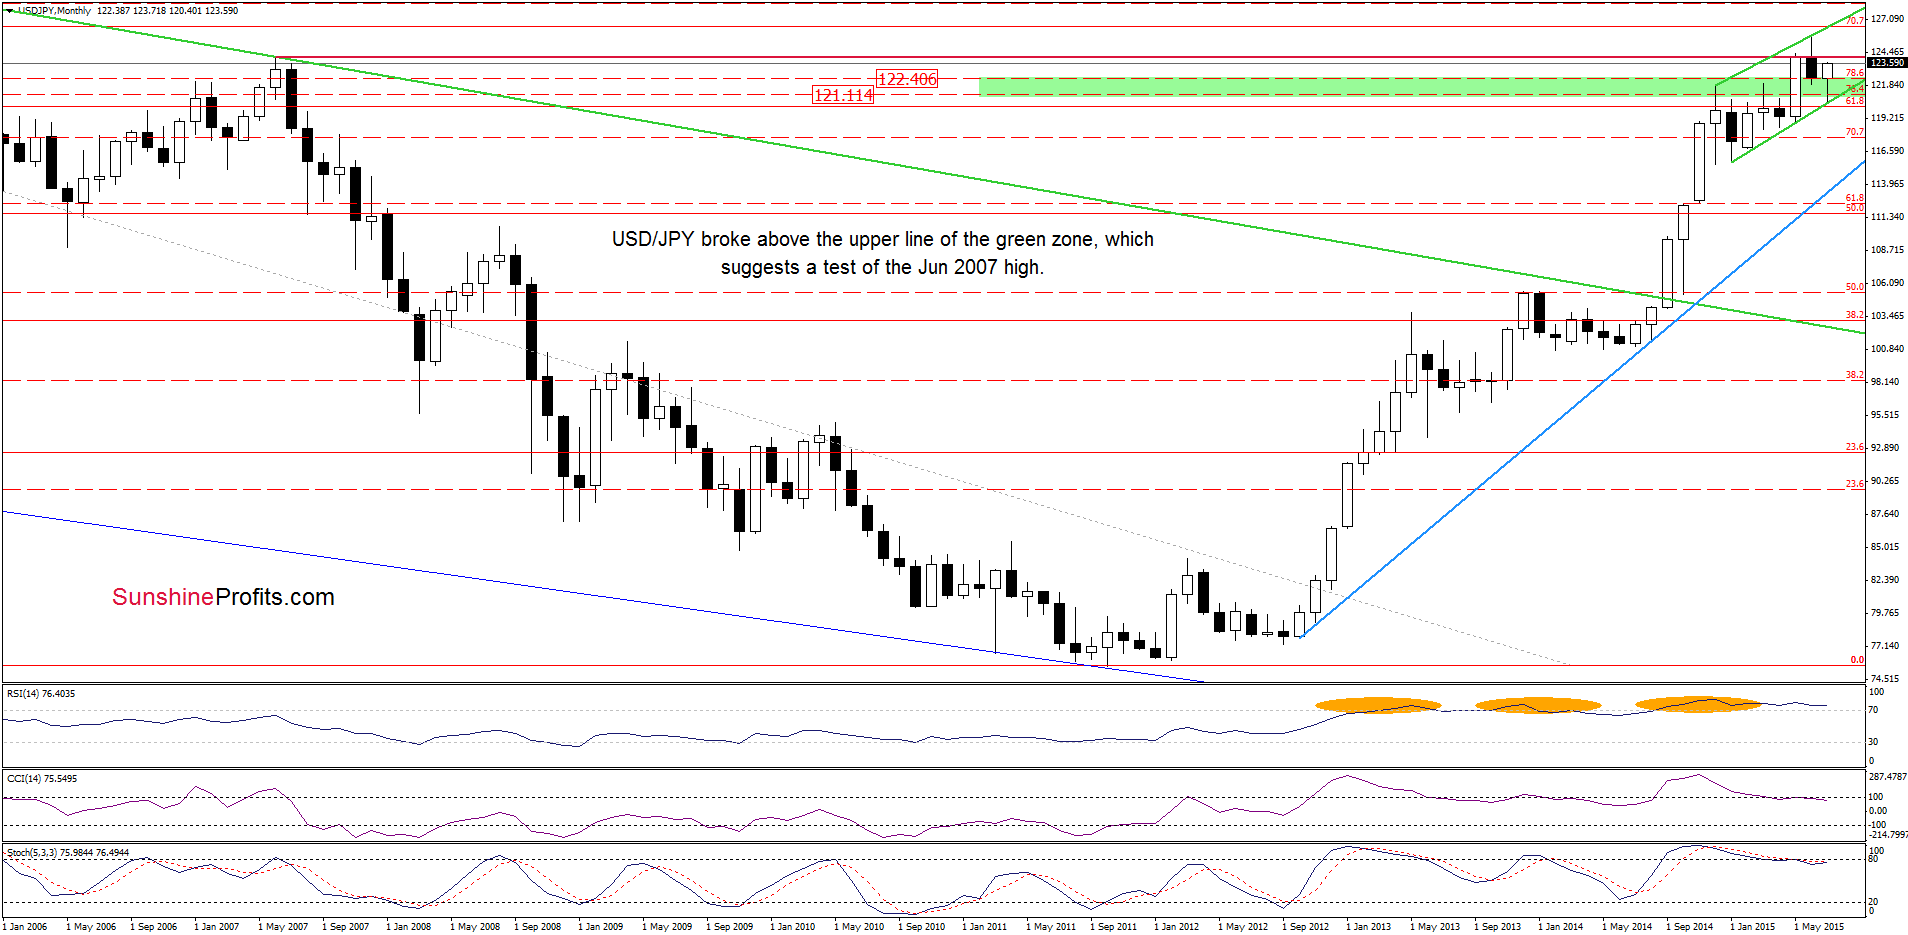
From today’s point of view we see that USD/JPY extended gains and broke above the upper line of the green zone, which suggests that we’ll likely see a test of the June 2007 high of 124.13 in the coming week.
Having said that, let’s focus on the very short-term changes.
Quoting our previous commentary on this currency pair:
(…) the exchange rate extended rally and invalidated the breakdown under the green support line based on the Jun and Jul lows. Taking this fact into account, and combining it with buy signals generated by the daily indicators, we think that (…) the next target would be the red declining resistance line, which stopped the rally in the previous week.
As you see on the daily chart, currency bulls not only took the exchange rate to the above-mentioned upside target, but also managed to push USD/JPY above it. This positive signal triggered further improvement and an increase to the red zone. At this point, it is worth noting that in mid-June and also at the beginning of July, this solid resistance area was strong enough to stop all attempts to move higher (there as only one daily close above it since June 10), which means that as long as here is no successful breakout above it further improvement is not likely to be seen. Taking this fact into account, and combining it with the proximity to the medium-term resistance level (the Jun 2007 high of 124.13) and the position of daily indicators (the CCI and Stochastic Oscillator are overbought and close to generating sell signals), it seems that reversal is just around the corner (please note that the red resistance area is currently reinforced by the 61.8% Fibonacci retracement based on the Jun-Jul decline).
Very short-term outlook: mixed with bearish bias
Short-term outlook: mixed
MT outlook: mixed
LT outlook: bullish
Trading position (short-term; our opinion): No positions are justified from the risk/reward perspective at the moment. We will keep you informed should anything change, or should we see a confirmation/invalidation of the above.
Thank you.
Nadia Simmons
Forex & Oil Trading Strategist
Przemyslaw Radomski, CFA
Founder, Editor-in-chief
Gold & Silver Trading Alerts
Forex Trading Alerts
Oil Investment Updates
Oil Trading Alerts

