

Earlier today, the USD Index extended yesterday’s gains as initial jobless claims report continued to support the U.S. currency. Will today’s U.S. nonfarm payrolls report give the greenback an additional support? Before we know the answer to this question, let’s take a closer look at the current picture of our six currency pairs.
In our opinion the following forex trading positions are justified - summary:
- EUR/USD: Short positions (stop-loss order at 1.1667)
- GBP/USD: Short positions (stop-loss order at 1.5913)
- USD/JPY: none
- USD/CAD: Long positions (stop-loss order at 1.1706)
- USD/CHF: none
- AUD/USD: Short positions (stop-loss order at 0.8194)
EUR/USD
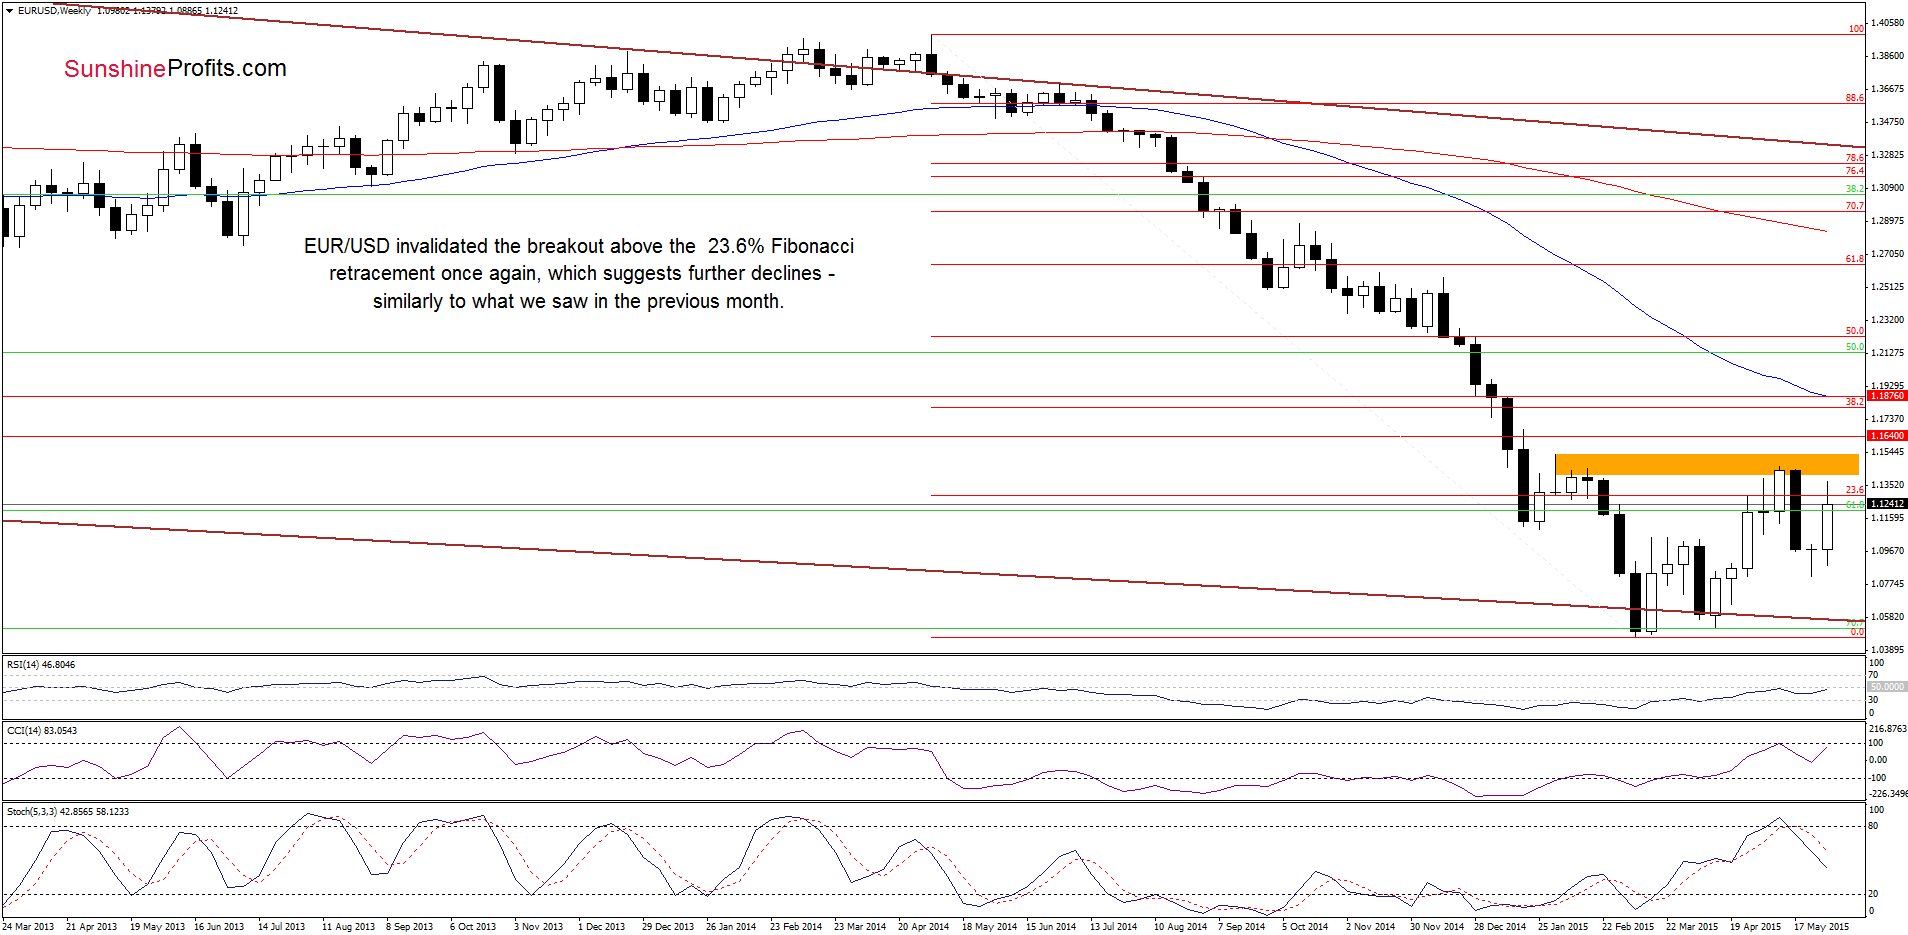
EUR/USD invalidated the breakout above the 23.6% Fibonacci retracement once again, which in combination with sell signals generated by the indicators suggests further declines – similarly to what we saw in the previous month.
Are there any short-term factors that could hinder the realization of this scenario? Let’s examine the daily chart and find out.
Yesterday, we wrote the following:
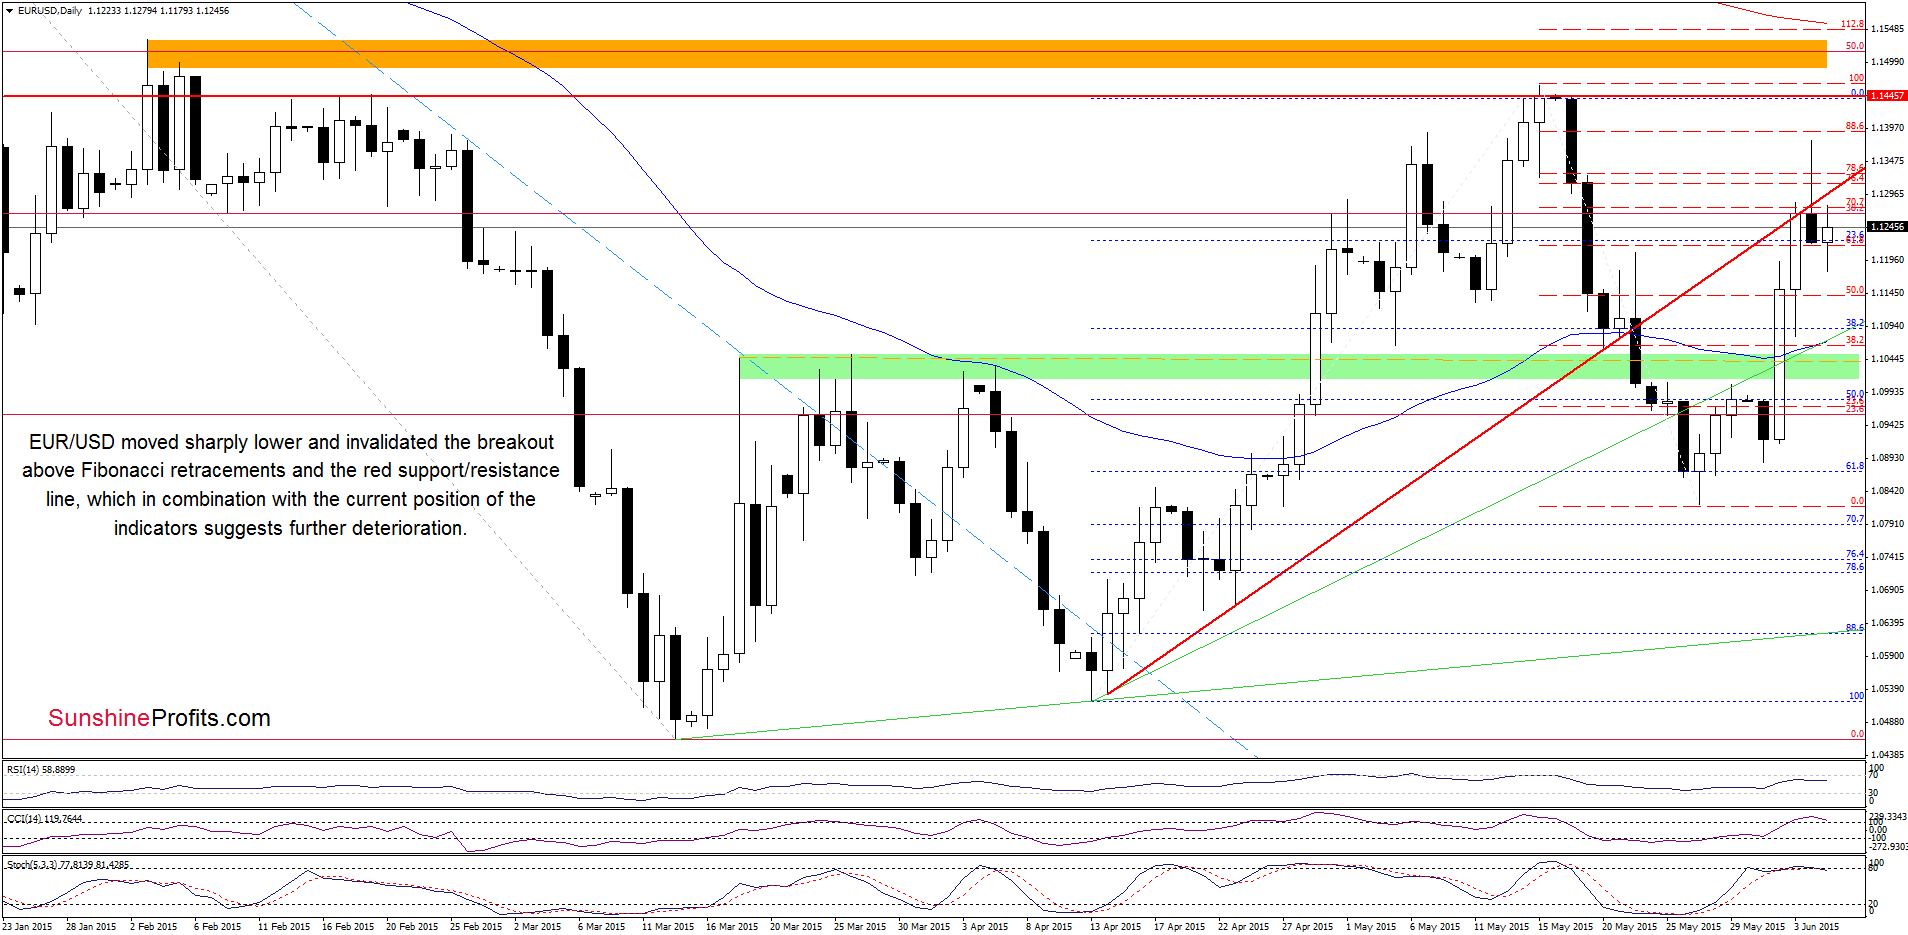
(…) the exchange rate broke above the 76.4% and 78.6% Fibonacci retracements, approaching the 88.6% retracement. Despite this improvement, the pair reversed and declined, invalidating earlier breakouts, which is a bearish signal (which will be even more bearish if EUR/USD closes the day below the red line) that suggests further deterioration.
As you see on the daily chart, the situation developed in line with the above scenario and EUR/USD closed yesterday’s session under previously-broken levels. Taking this fact into account, and combining it with the current position of the indicators (the CCI and Stochastic Oscillator are very close to generating sell signals), we think that further deterioration is just around the corner. If this is the case, and the exchange rate declines from here, we’ll see a drop to (at least) around 1.1078, where the Wednesday’s low, the 50-day moving average and the green support line are.
Very short-term outlook: bearish
Short-term outlook: mixed with bearish bias
MT outlook: mixed
LT outlook: mixed
Trading position (short-term; our opinion): Short positions (which are profitable) with a stop-loss order at 1.1667 are justified from the risk/reward perspective at the moment. We will keep you informed should anything change, or should we see a confirmation/invalidation of the above.
GBP/USD
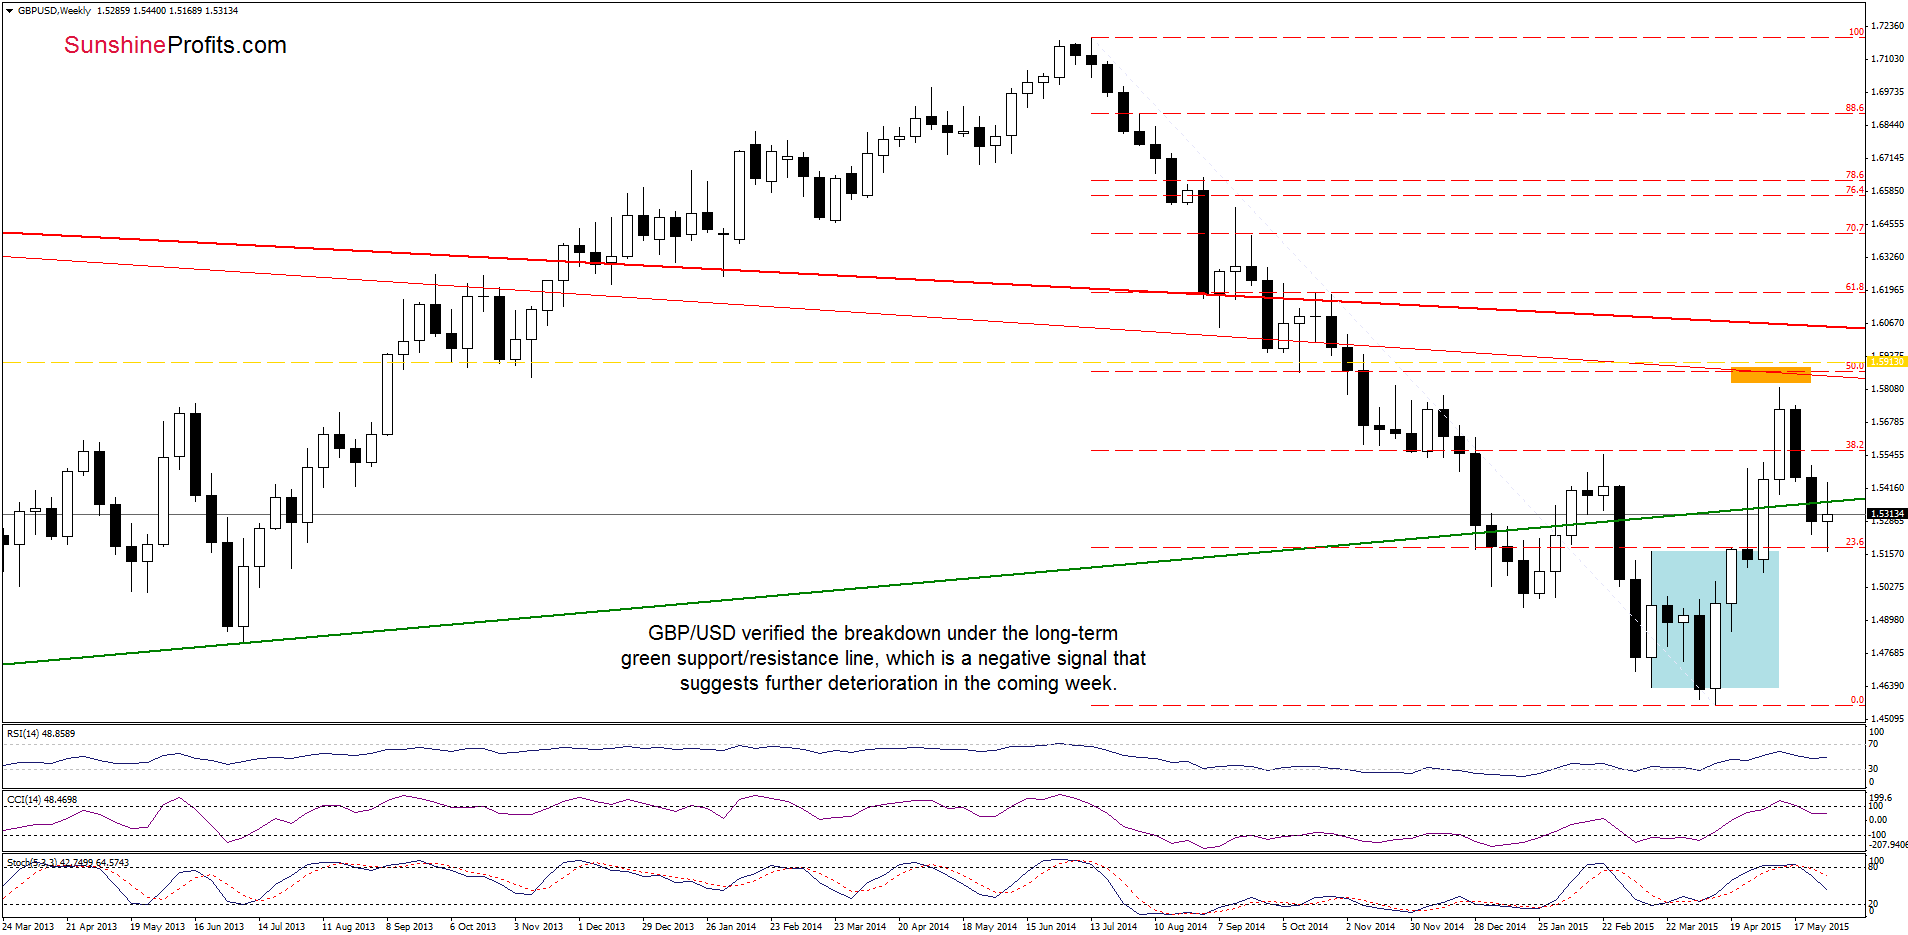
On the weekly chart we see that GBP/USD verified the breakdown under the long-term green support/resistance line, which is a negative signal that suggests further deterioration (especially when we factor in sell signals generated by the indicators).
How low could the pair go in the coming days? Let’s take a closer look at the daily chart and find out.
Quoting our last commentary on this currency pair:
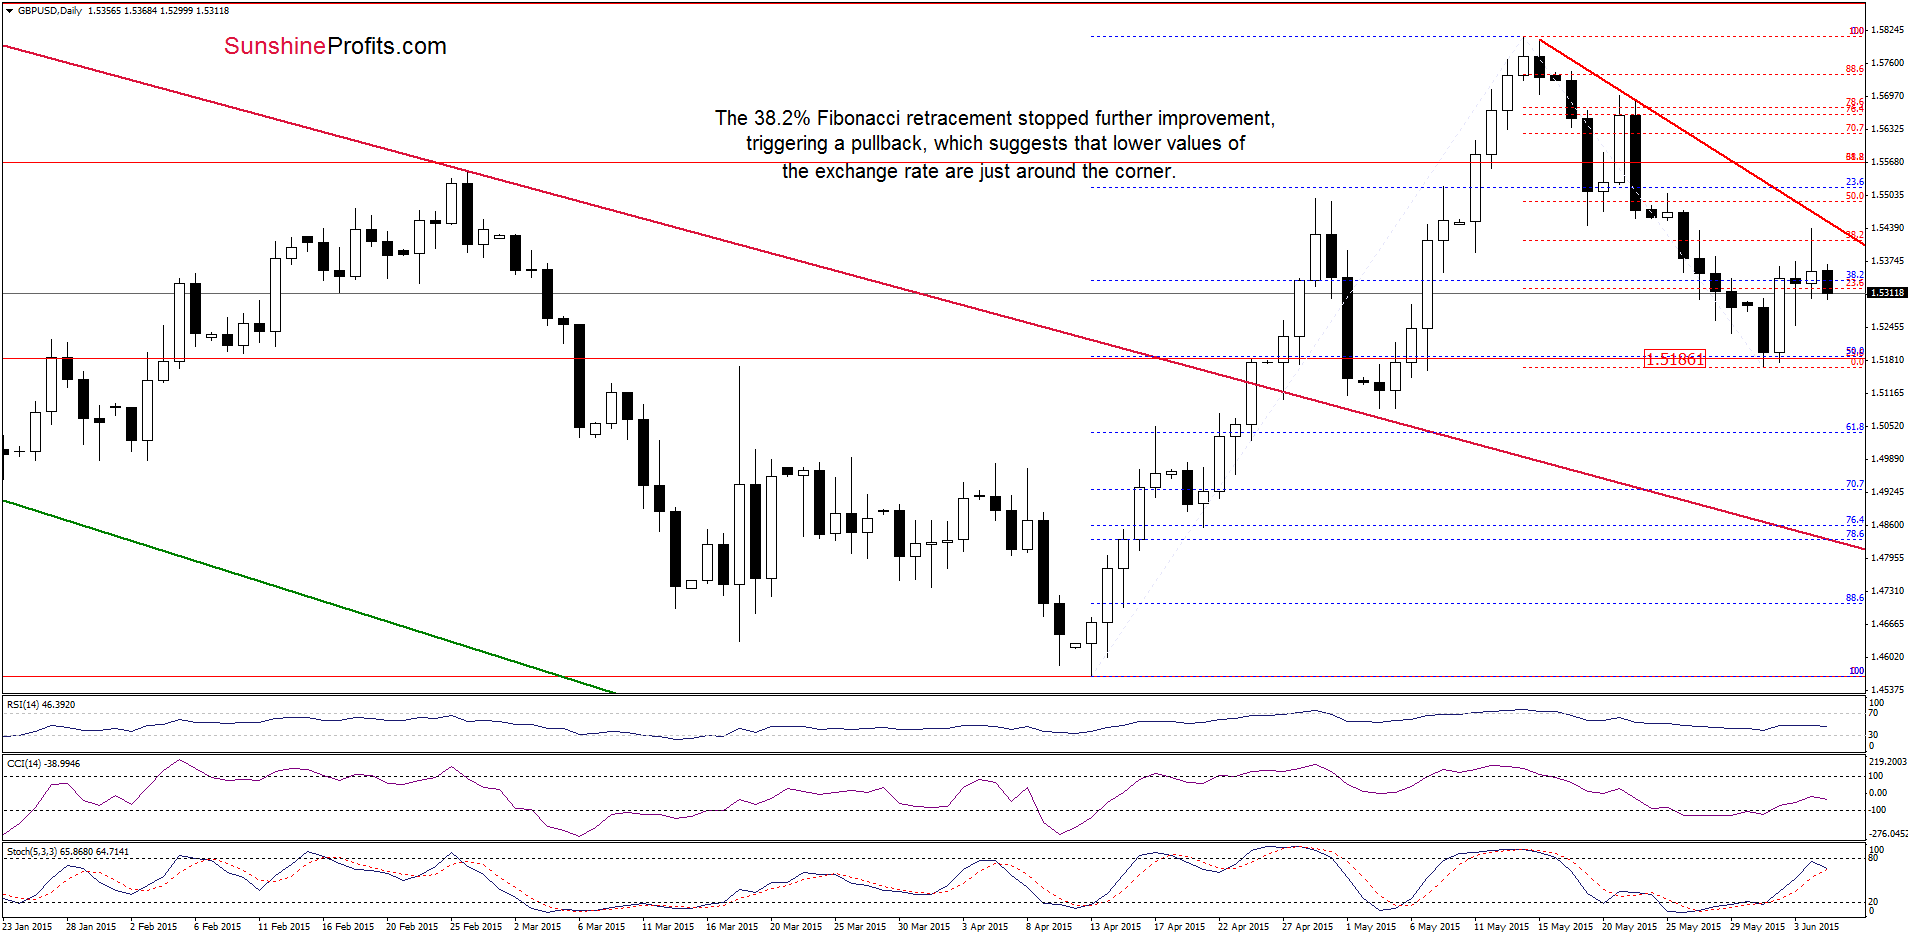
(…) the upswing didn’t even reach the 38.2% Fibonacci retracement (based on the recent declines), which means that the very short-term outlook remains bearish and further drops are just around the corner.
Looking at the daily chart, we see that GBP/USD reversed and declined as we expected. This means that what we wrote on Wednesday is up-to-date also today:
(...) If (…) the pair declines from here, the initial downside target would be around 1.5190, where the recent low is. If it is broken, we might see a downward move even to 1.5088-1.5122, where the bottom of the previous correction (at the beginning of May) is.
Very short-term outlook: bearish
Short-term outlook: mixed with bearish bias
MT outlook: mixed
LT outlook: mixed
Trading position (short-term; our opinion): Short positions (which are profitable) with a stop-loss order at 1.5913 are justified from the risk/reward perspective at the moment. We will keep you informed should anything change, or should we see a confirmation/invalidation of the above.
USD/JPY
Yesterday, we wrote the following:
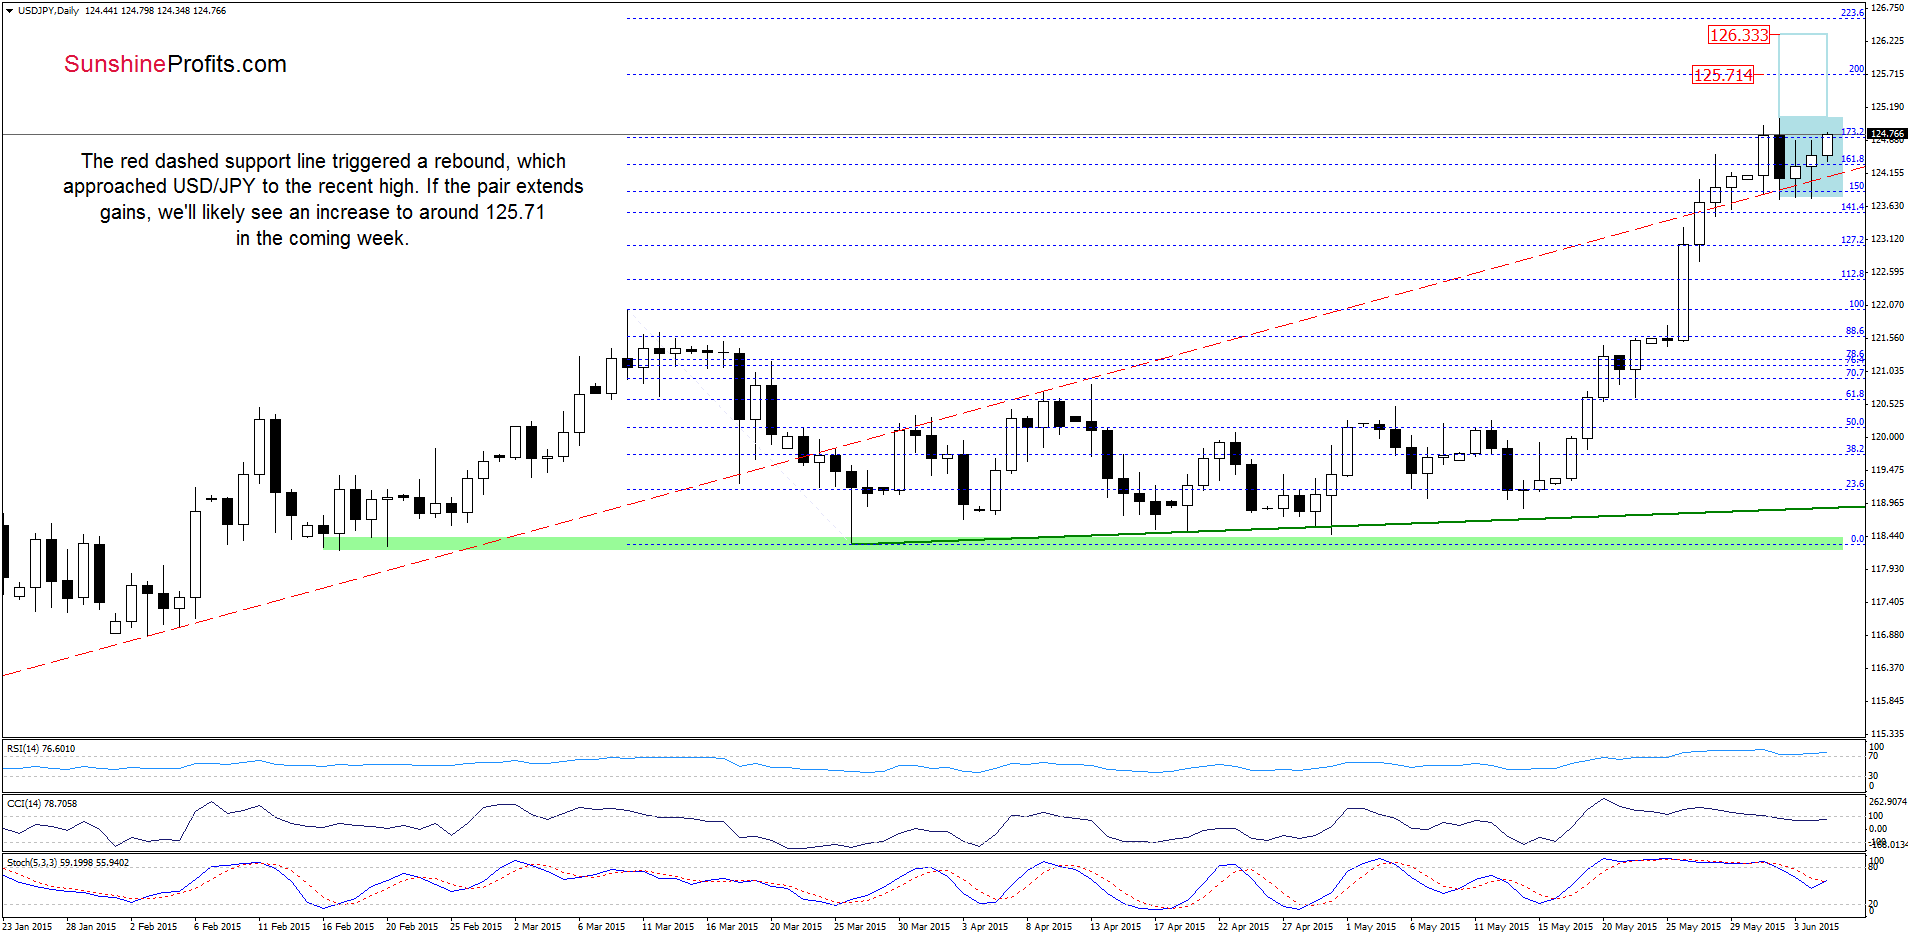
(…) the exchange rate re-tested the strength of the red dashed support line, but despite several attempts to move lower currency bears failed. As a result, the pair bounced off the lower border of the consolidation (marked with blue) and invalidated small breakdown under the red line. This is a positive signal, which suggests a test of the recent high in the coming day(s).
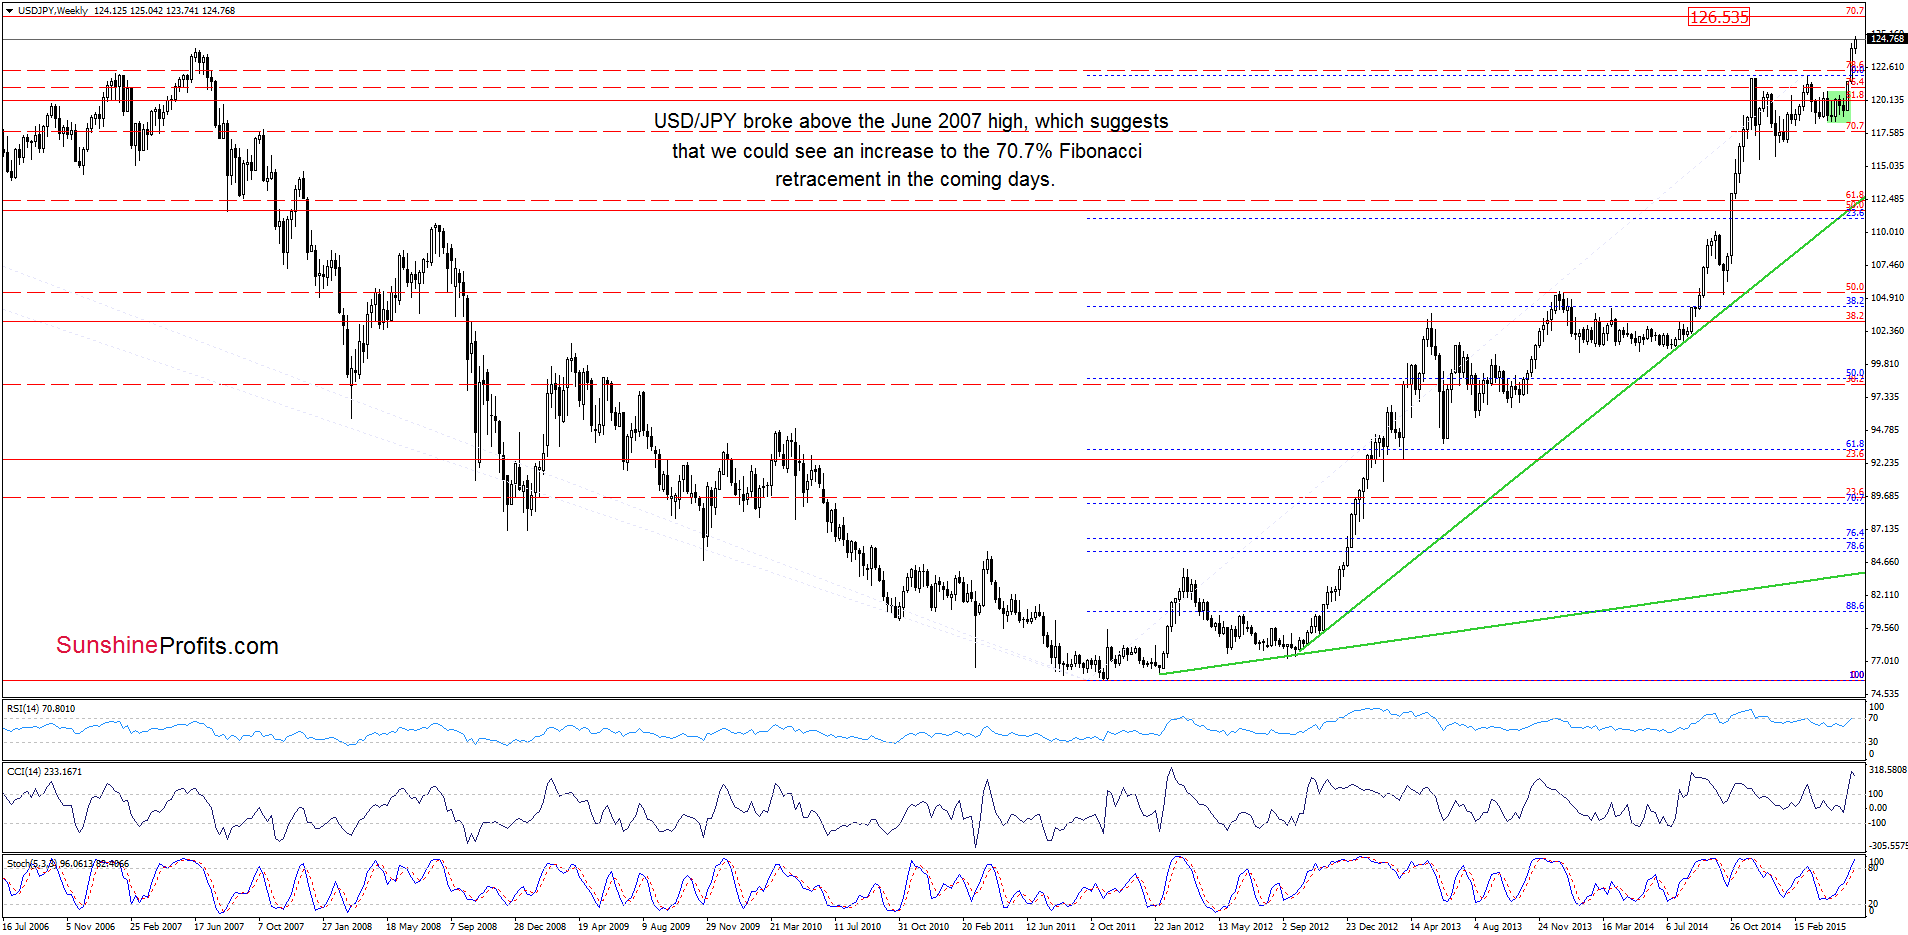
Earlier today, USD/JPY extended gains, which means that our initial upside will be in play in the near future. If the exchange rate breaks above the June high of 125.04, we’ll likely see an increase to around 125.71 (the 200% Fibonacci extension) or even to 126.33, where the size of the upward move will correspond to the height of the consolidation (marked with blue). At this point, it is worth noting that buy signals generated by the weekly remain in place, suggesting that we might see a ally even to 126.53, where the 70.7% Fibonacci retracement (marked on the weekly chart) is.
Very short-term outlook: mixed with bullish bias
Short-term outlook: mixed
MT outlook: mixed
LT outlook: bullish
Trading position (short-term; our opinion): No positions are justified from the risk/reward perspective at the moment. We will keep you informed should anything change, or should we see a confirmation/invalidation of the above.
USD/CAD
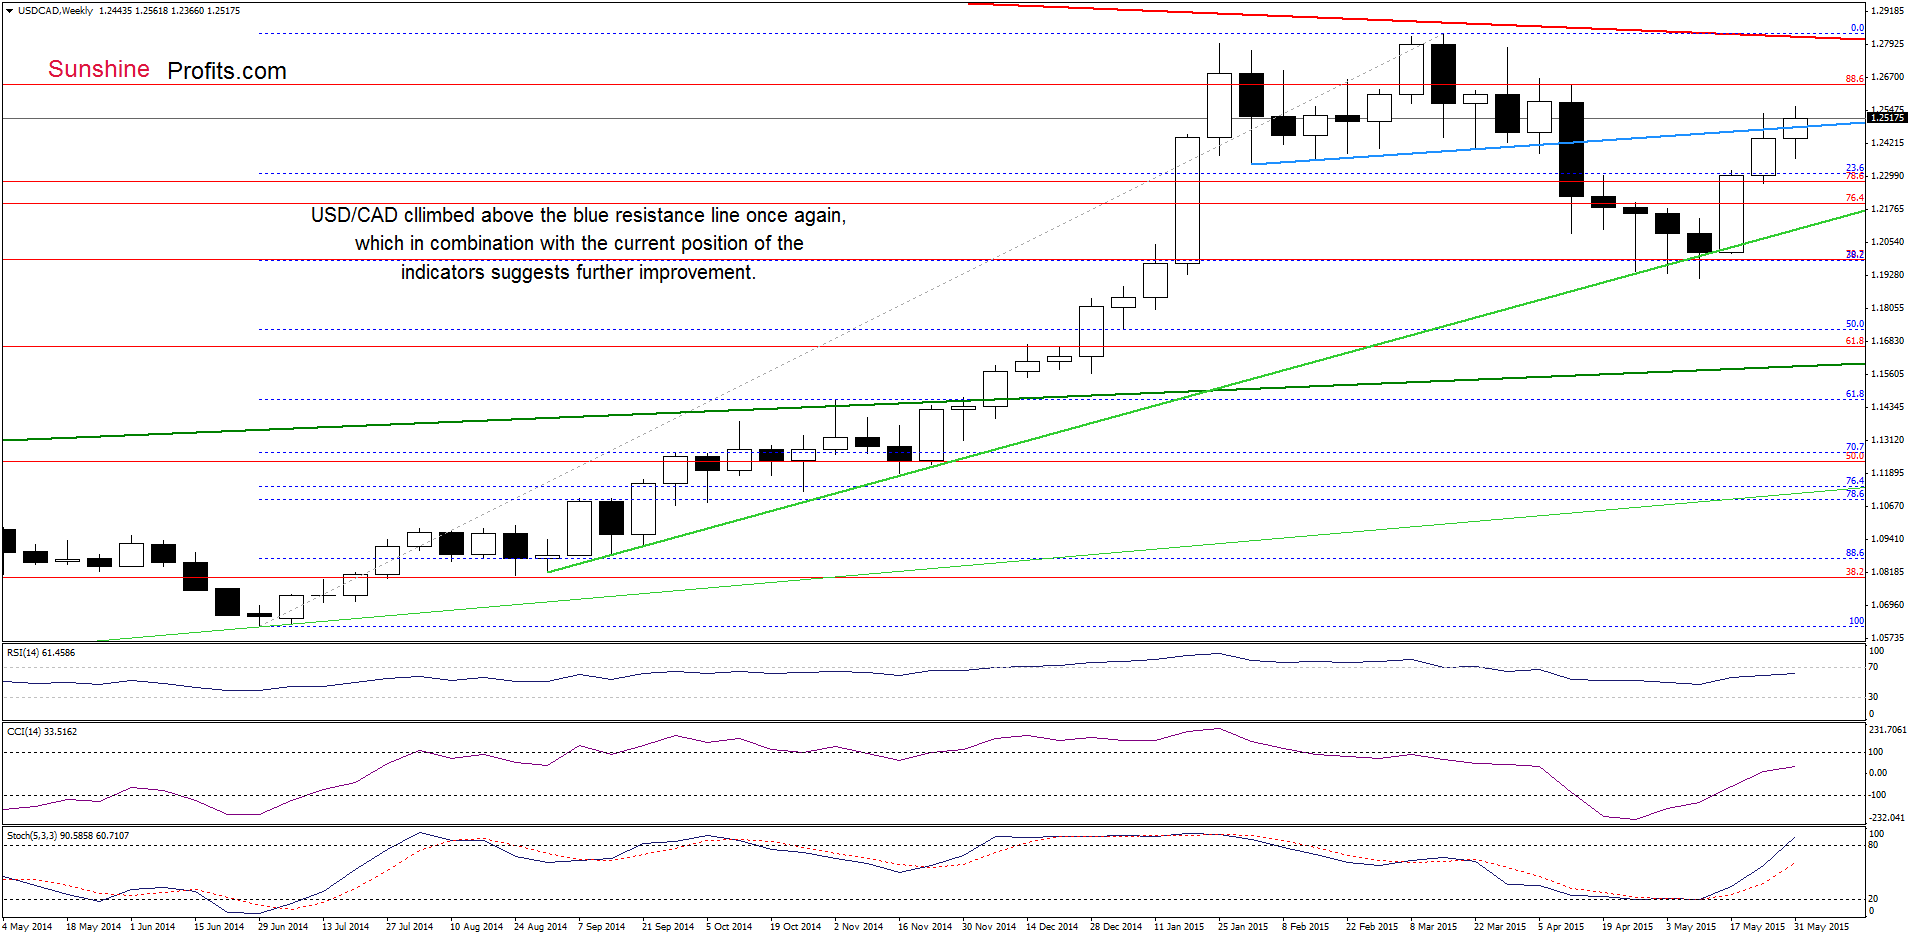
Looking at the weekly chart, we see that USD/CAD climbed above the blue support/resistance line once again, which in combination with buy signals generated by the indicators supports further improvement.
Having said that, let’s focus on the very short-term changes.
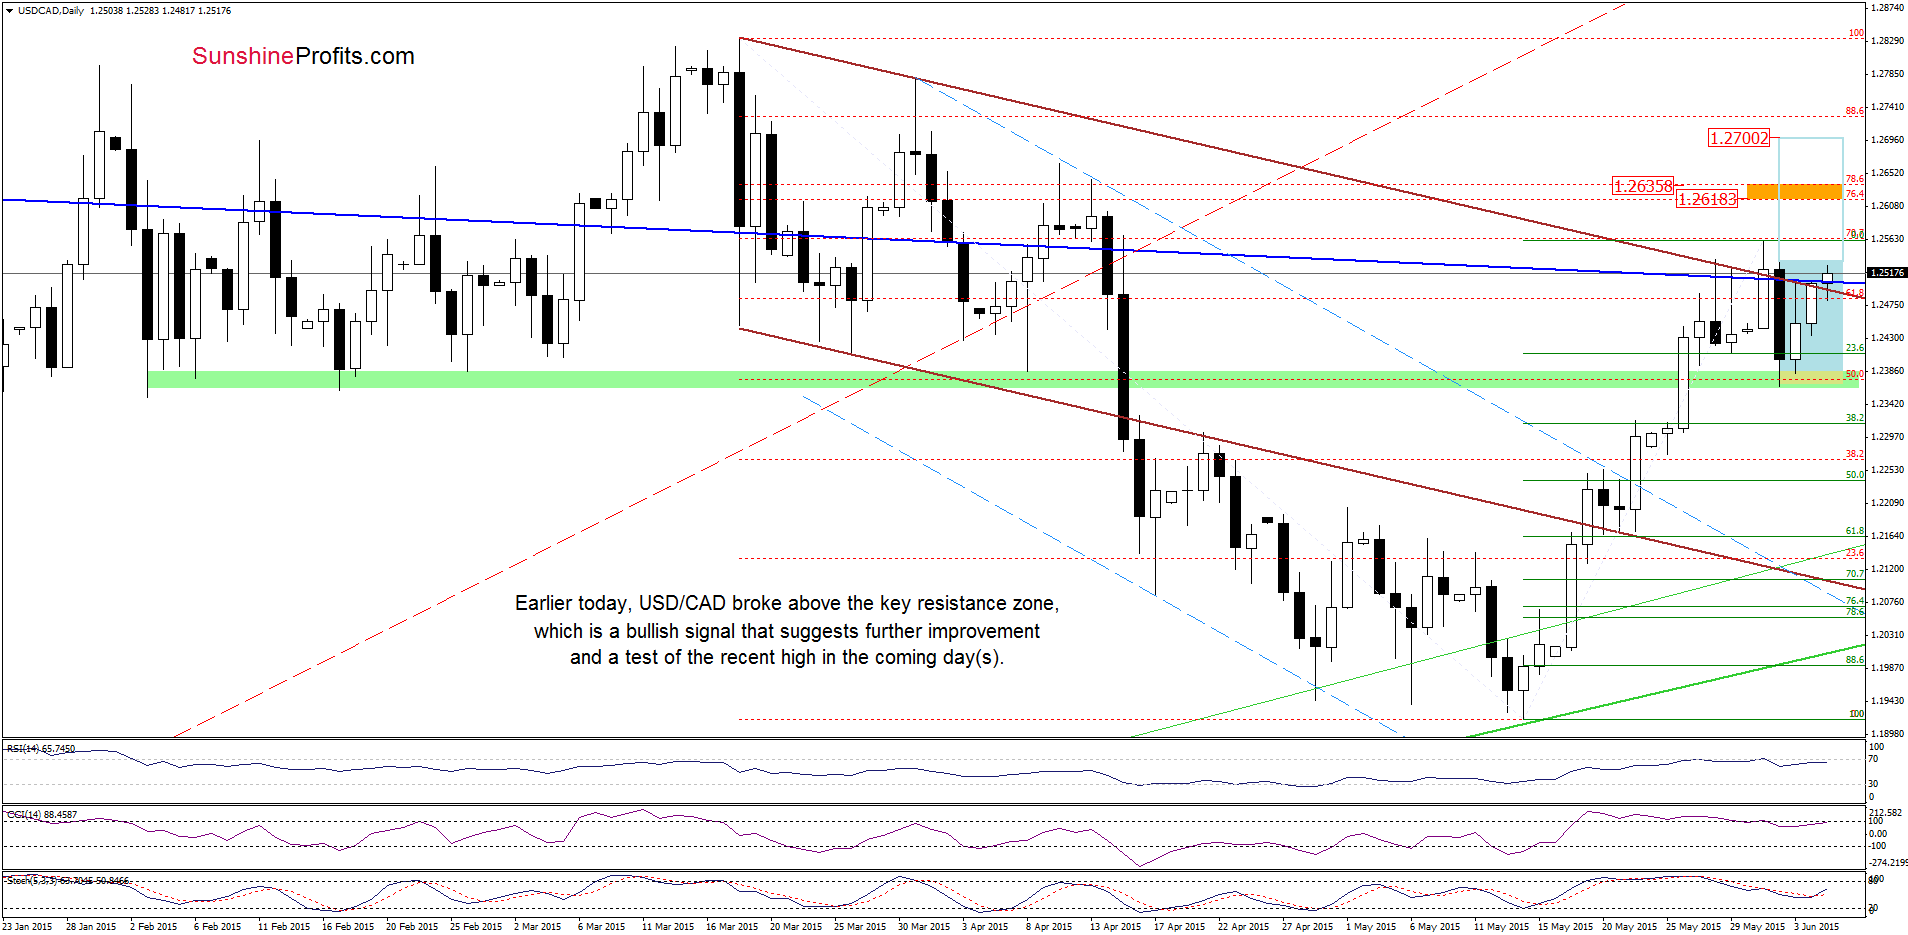
Earlier today, USD/CAD broke above the key resistance zone (created by the upper border of the brown declining trend channel and the long-term blue resistance line), which is a positive signal. Nevertheless, we think that this event will be more reliable if the exchange rate closes today’s session above this area (the situation will be even more bullish if we see a breakout above the recent high). If we see such price action, the pair will test the recent high. If this resistance level is broken, we might see a rally to the orange resistance zone (created by the 76.4% and 78.% Fibonacci retracement levels) in the coming days. On the other hand, if currency bulls fail, USD/CAD will likely test yesterday’s low or even the green support zone in the coming week.
Very short-term outlook: bullish
Short-term outlook: mixed with bullish bias
MT outlook: mixed
LT outlook: mixed
Trading position (short-term; our opinion): Long positions (which are profitable) with a stop-loss order at 1.1706 are justified from the risk/reward perspective at the moment. We will keep you informed should anything change, or should we see a confirmation/invalidation of the above.
USD/CHF
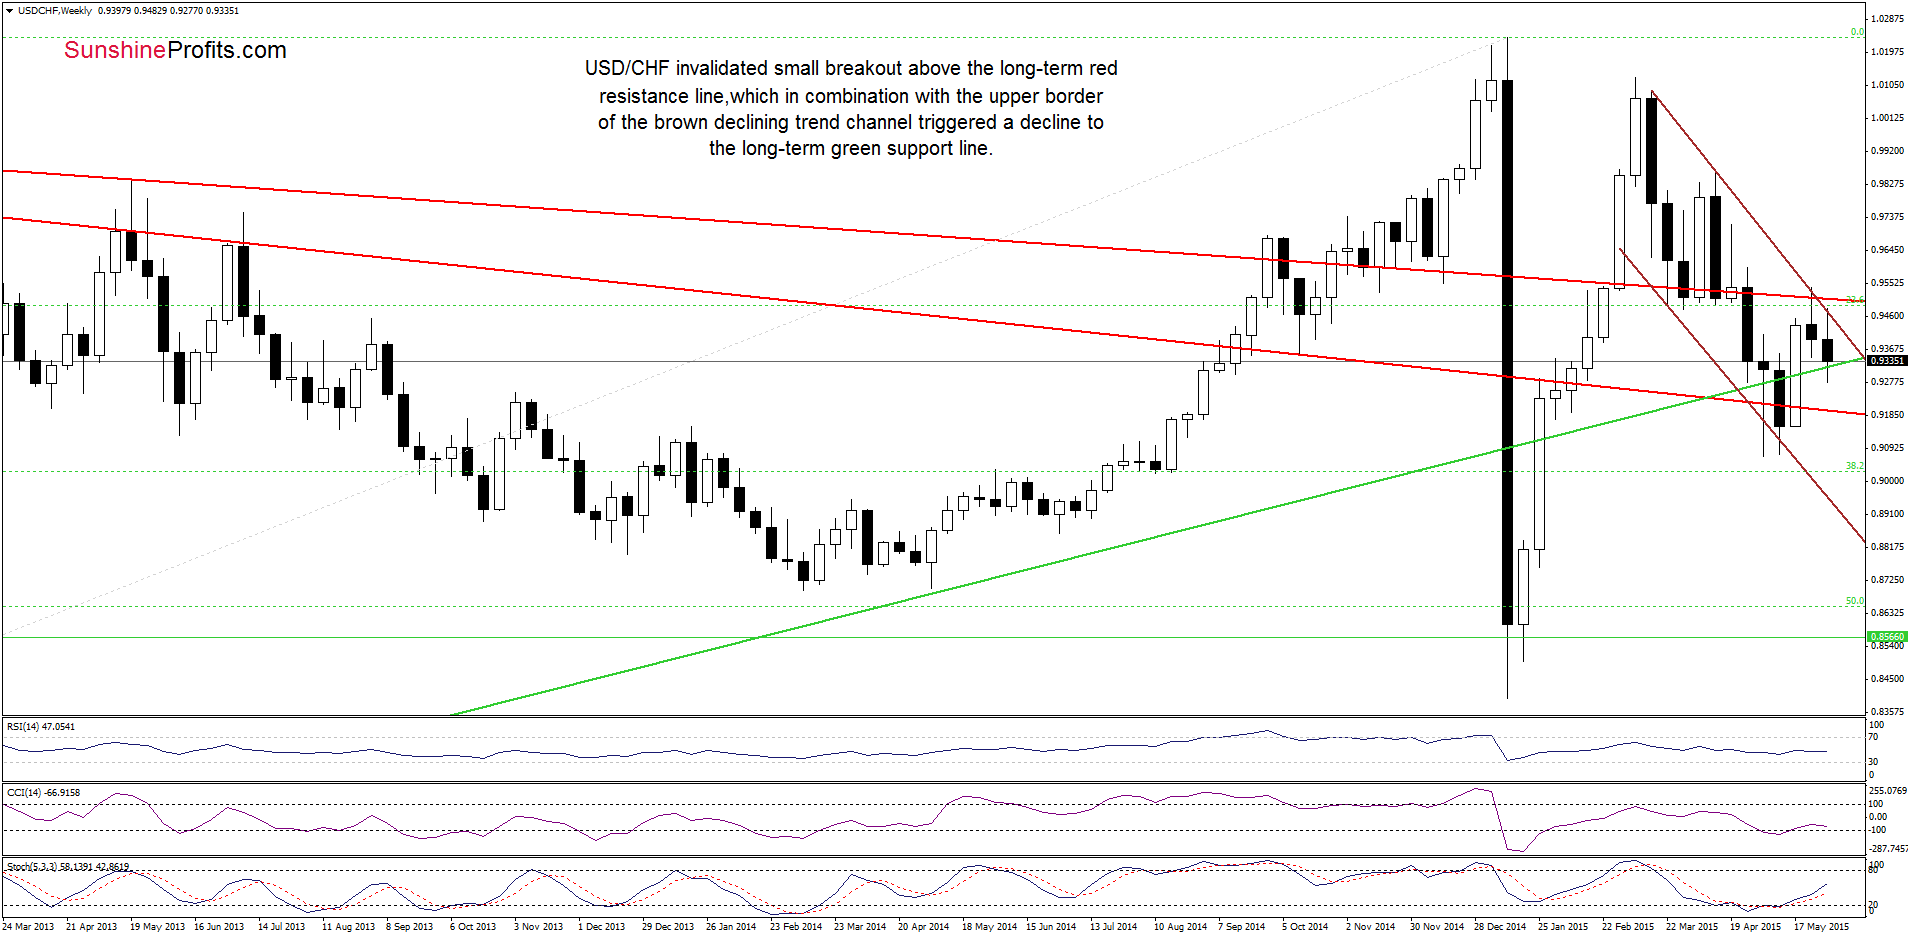
Looking at the weekly chart, we see that USD/CHF invalidated a small breakout above the long-term red resistance line, which in combination with the upper border of the brown declining trend channel triggered a decline to the long-term green support line.
Will it withstand the selling pressure in the coming week? Let’s focus on the daily chart and look for more clues about future moves.
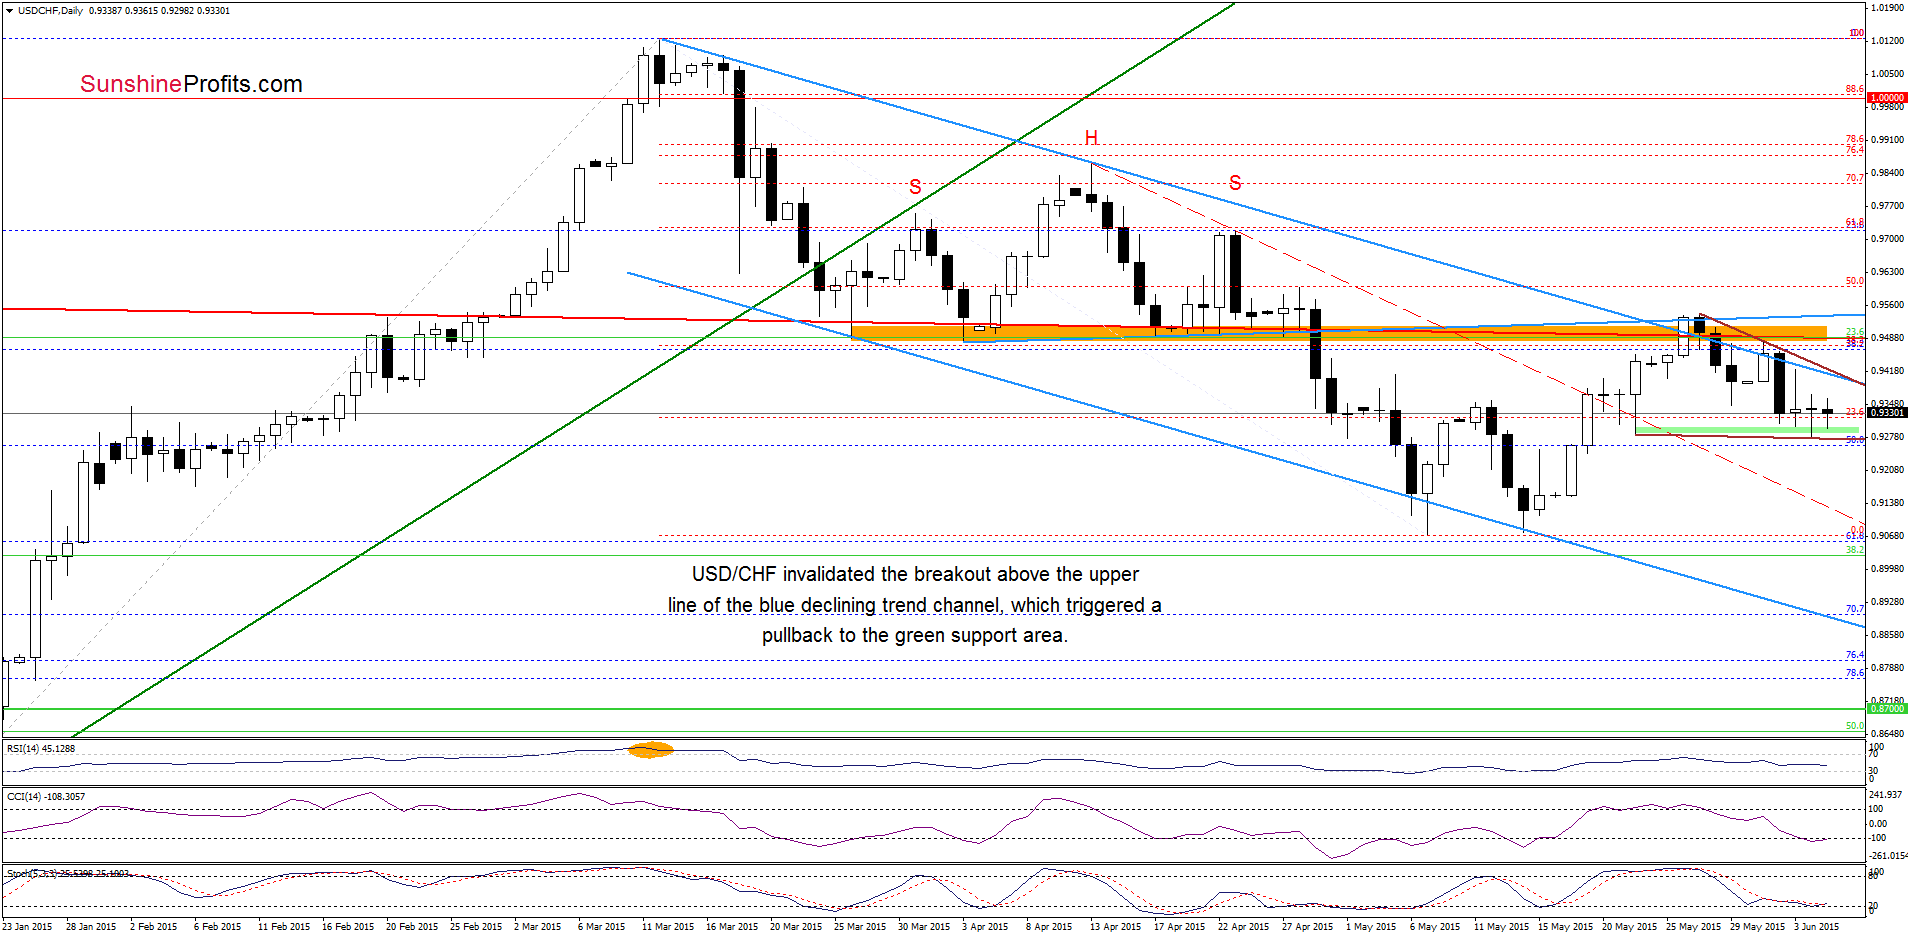
A week ago, we wrote the following:
(…) USD/CHF invalidated the breakout above the orange resistance zone (creted by the long-term red resistance line, the neck line of the head and shoulders formation and the upper border of the declining trend channel), which is a bearish signal signal that suggests move to the downside from here in the coming days. If this is the case, the initial downside target would be around 0.9290, where the May 22 low is.
On the daily chart, we see that the situation developed in line with the above scenario and the exchange rate reached the green support zone. Taking into account the medium-term picture and the current position of the indicators (the CCI and Stochastic Oscillator are very close to generating buy signals) it seems that USD/CHF will rebound from here in the coming day(s). If we see such price action, the initial upside target would be the brown (upper border of the triangle) and blue (the upper line of the declining trend channel) lines – currently around 0.9420.
Very short-term outlook: mixed
Short-term outlook: mixed
MT outlook: mixed
LT outlook: bearish
Trading position (short-term; our opinion): No positions are justified from the risk/reward perspective at the moment. We will keep you informed should anything change, or should we see a confirmation/invalidation of the above.
AUD/USD
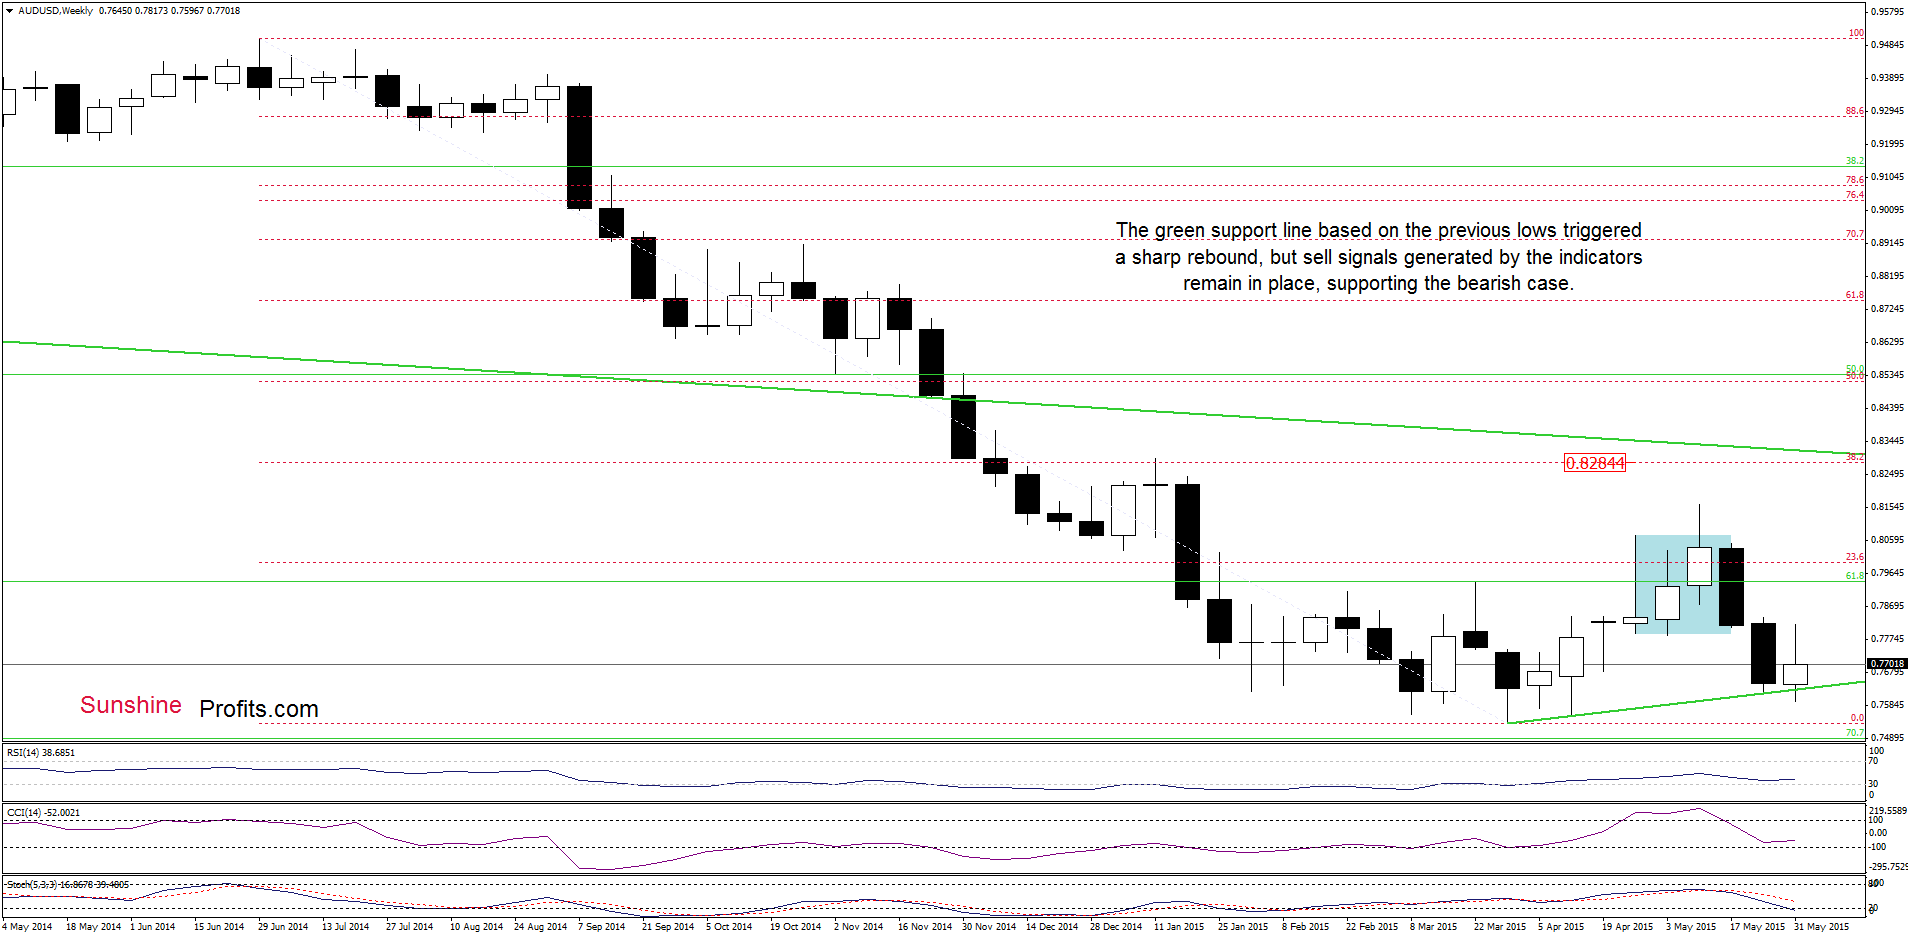
Although AUD/USD moved lower earlier this week, the pair remains above the green support line based on the Mar and Apr lows, while sell signals generated by the indicators support the bearish case.
Will we see another test of this support line in the coming days? Let’s examine the daily chart and find out.
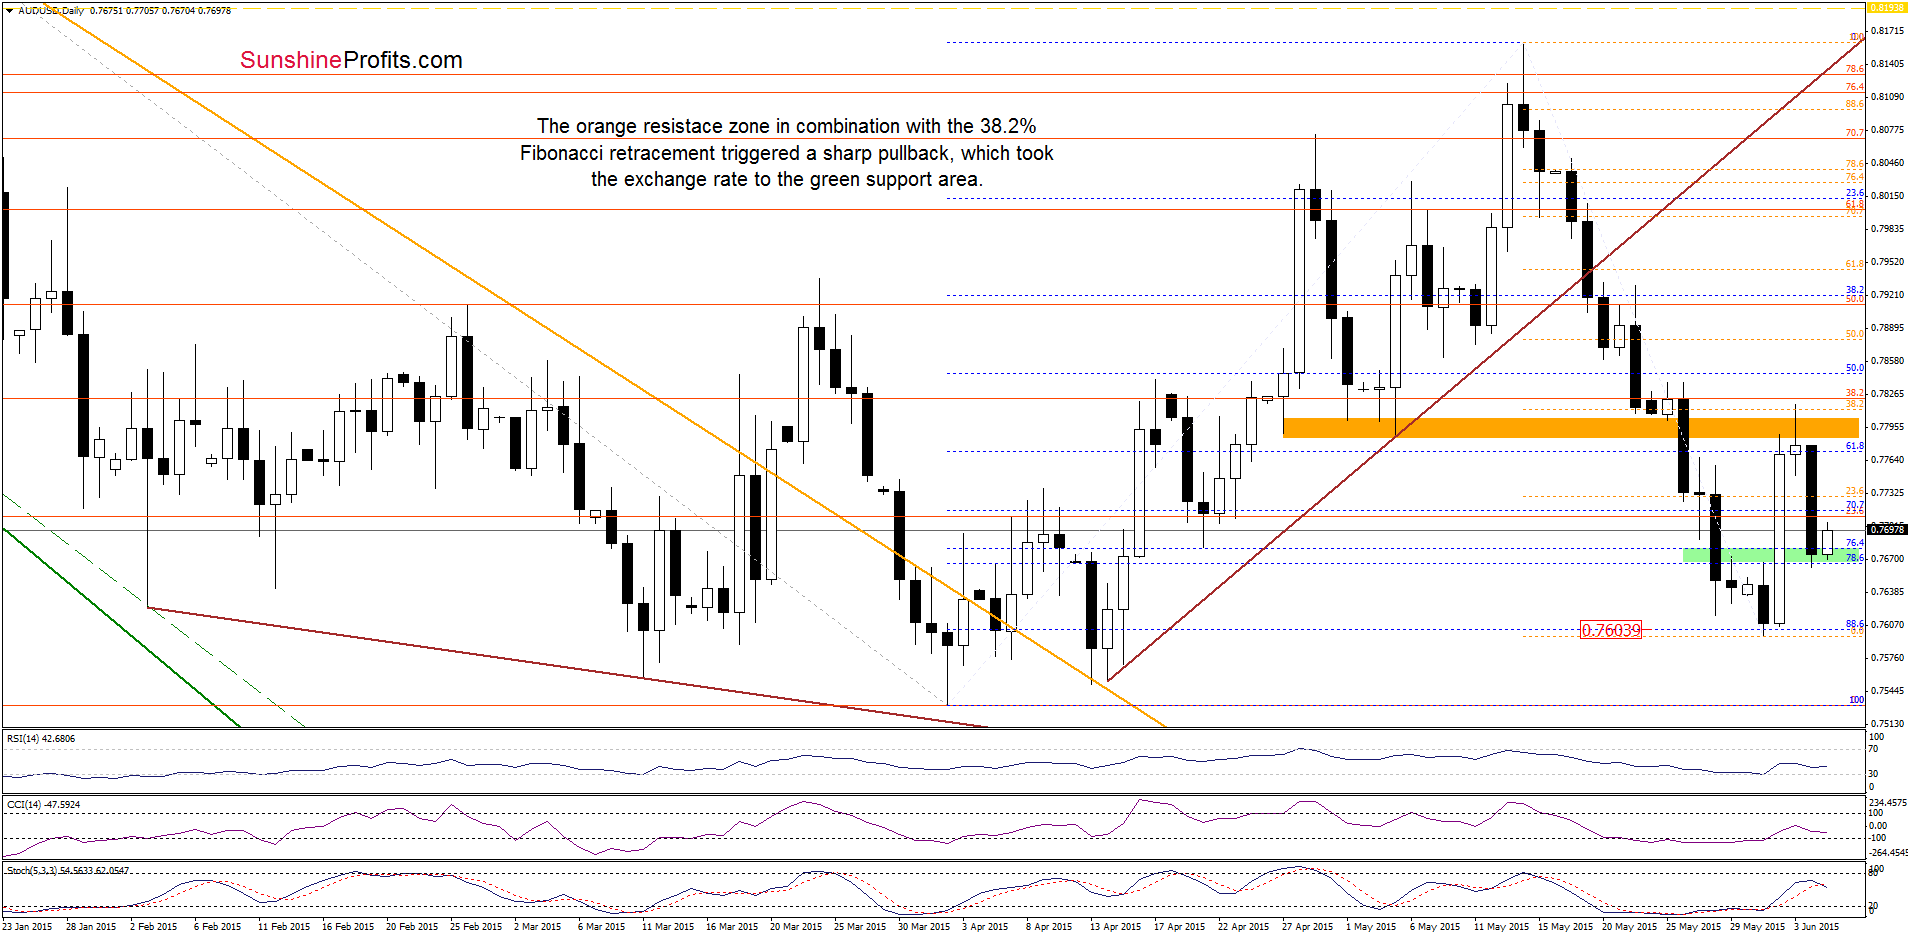
Quoting out Forex Trading Alert posted on Wednesday:
(…) yesterday’s rally took the exchange rate to the orange area (created by the Apr 27 and May lows and reinforced by the 38.2% Fibonacci retracement based on the entire recent decline), which will likely trigger a pullback from here in the coming day(s). If this is the case, we’ll see a drop to around 0.7681, where the Apr 21 low is.
From today’s point of view we see that currency bears pushed the pair lower (as we expected) and AUD/USD reached our downside target yesterday. Earlier today, the pair rebounded slightly, but taking into account the current position of the Stochastic Oscillator (very close to generating a sell signal), it seems that another pullback is just around the corner.
Very short-term outlook: bearish
Short-term outlook: mixed with bearish bias
MT outlook: mixed
LT outlook: mixed
Trading position (short-term; our opinion): Short positions (which are profitable) with a stop-loss order at 0.8194 are justified from the risk/reward perspective at the moment. We will keep you informed should anything change, or should we see a confirmation/invalidation of the above.
Thank you.
Nadia Simmons
Forex & Oil Trading Strategist
Przemyslaw Radomski, CFA
Founder, Editor-in-chief
Gold & Silver Trading Alerts
Forex Trading Alerts
Oil Investment Updates
Oil Trading Alerts

