

Earlier today, the Australian Bureau of Statistics showed that gross domestic product increased by 0.9% in the first quarter, beating expectations for a growth of 0.7%. Additionally, on a year-on-year basis, the GDP rose 2.3%, also above expectations for an increase of 2.1%. Thanks to these solid numbers, AUD/USD extended gains and climbed above 0.7800. Will we see further improvement in the coming days?
In our opinion, the following forex trading positions are justified – summary:
- EUR/USD: Short positions (stop-loss order at 1.1667)
- GBP/USD: Short positions (stop-loss order at 1.5913)
- USD/JPY: none
- USD/CAD: Long positions (stop-loss order at 1.1706)
- USD/CHF: none
- AUD/USD: Short positions (stop-loss order at 0.8194)
EUR/USD
The situation in the medium term hasn’t changed much as EUR/USD remains under the 23.6% Fibonacci retracement and sell signals generated by the indicators support further deterioration.
Where will the pair head next? Let’s examine the daily chart and find out.
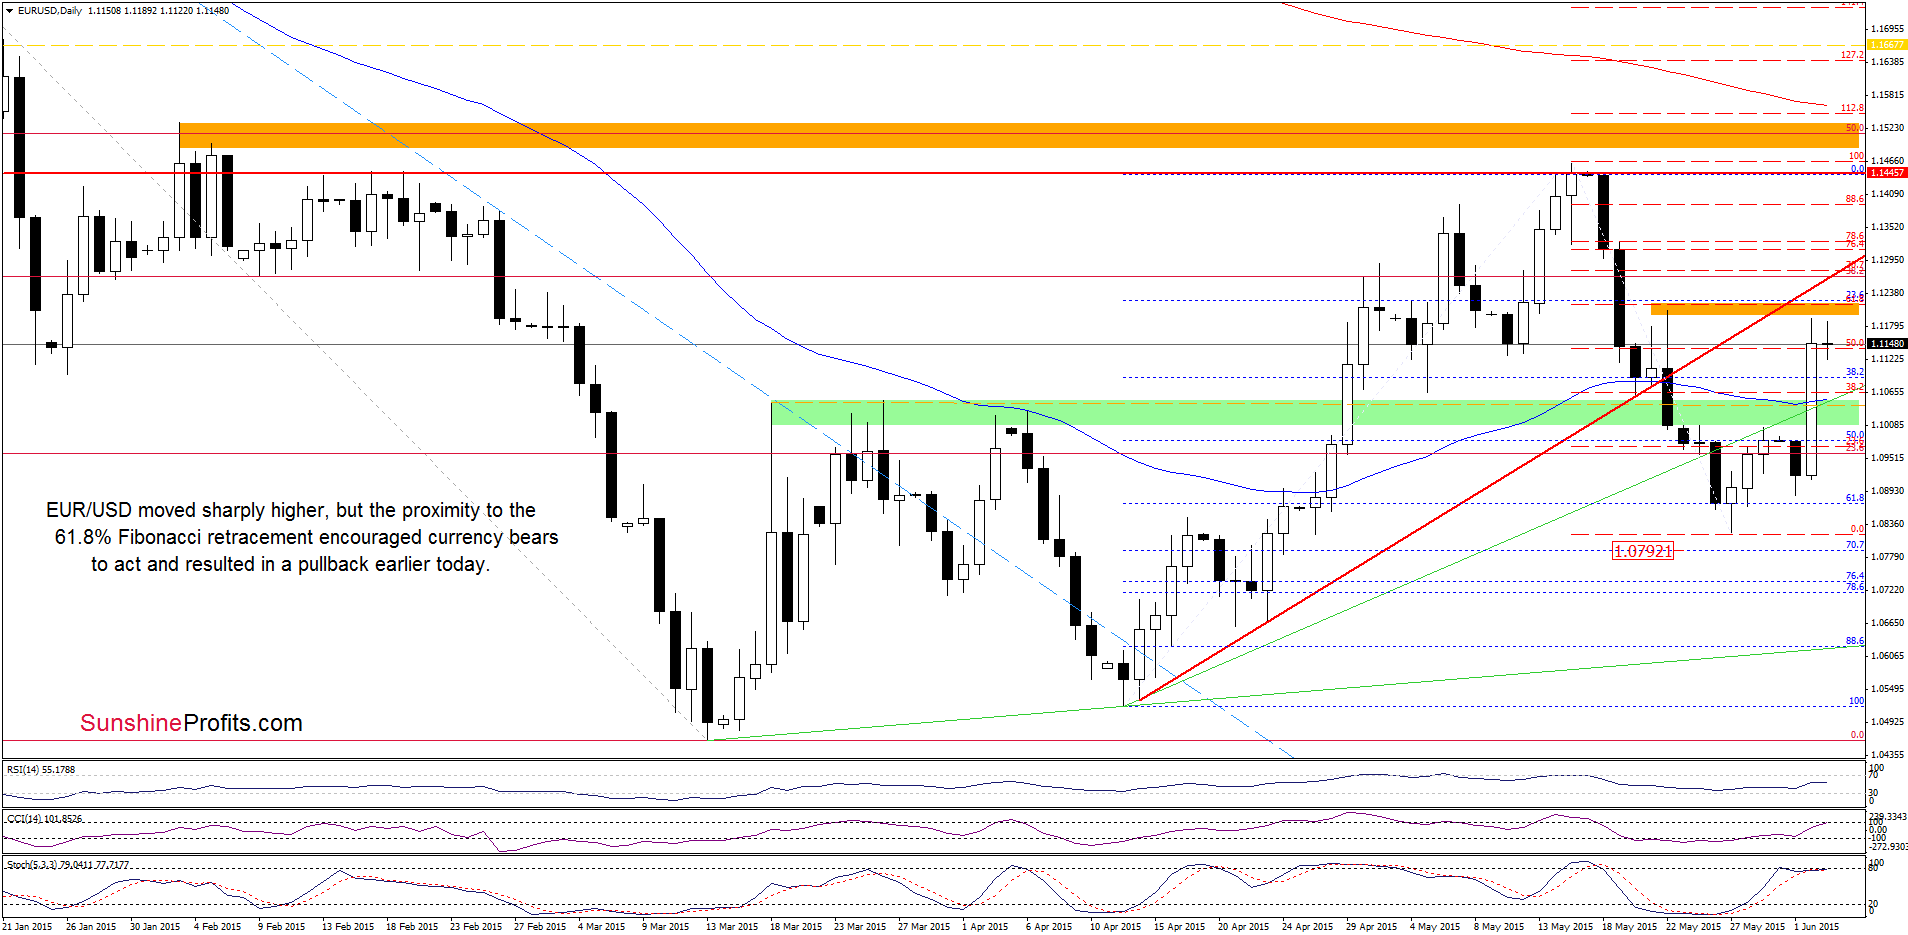
Looking at the above chart, we see that EUR/USD reversed and rebounded sharply, invalidating the breakdown under the green zone and the 50-day moving average. With yesterday’s upswing, the pair approached the orange resistance zone (created by the May 22 high and the 61.8% Fibonacci retracement based on the recent declines), which triggered a pullback earlier today. Taking this fact into account and combining it with the medium-term picture, we think that further deterioration is just around the corner. If this is the case, and the pair declines from here, the initial downside target would be around 1.1050, where the green zone is.
Very short-term outlook: bearish
Short-term outlook: mixed with bearish bias
MT outlook: mixed
LT outlook: mixed
Trading position (short-term; our opinion): Short positions (which are profitable) with a stop-loss order at 1.1667 are justified from the risk/reward perspective at the moment. We will keep you informed should anything change, or should we see a confirmation/invalidation of the above.
GBP/USD
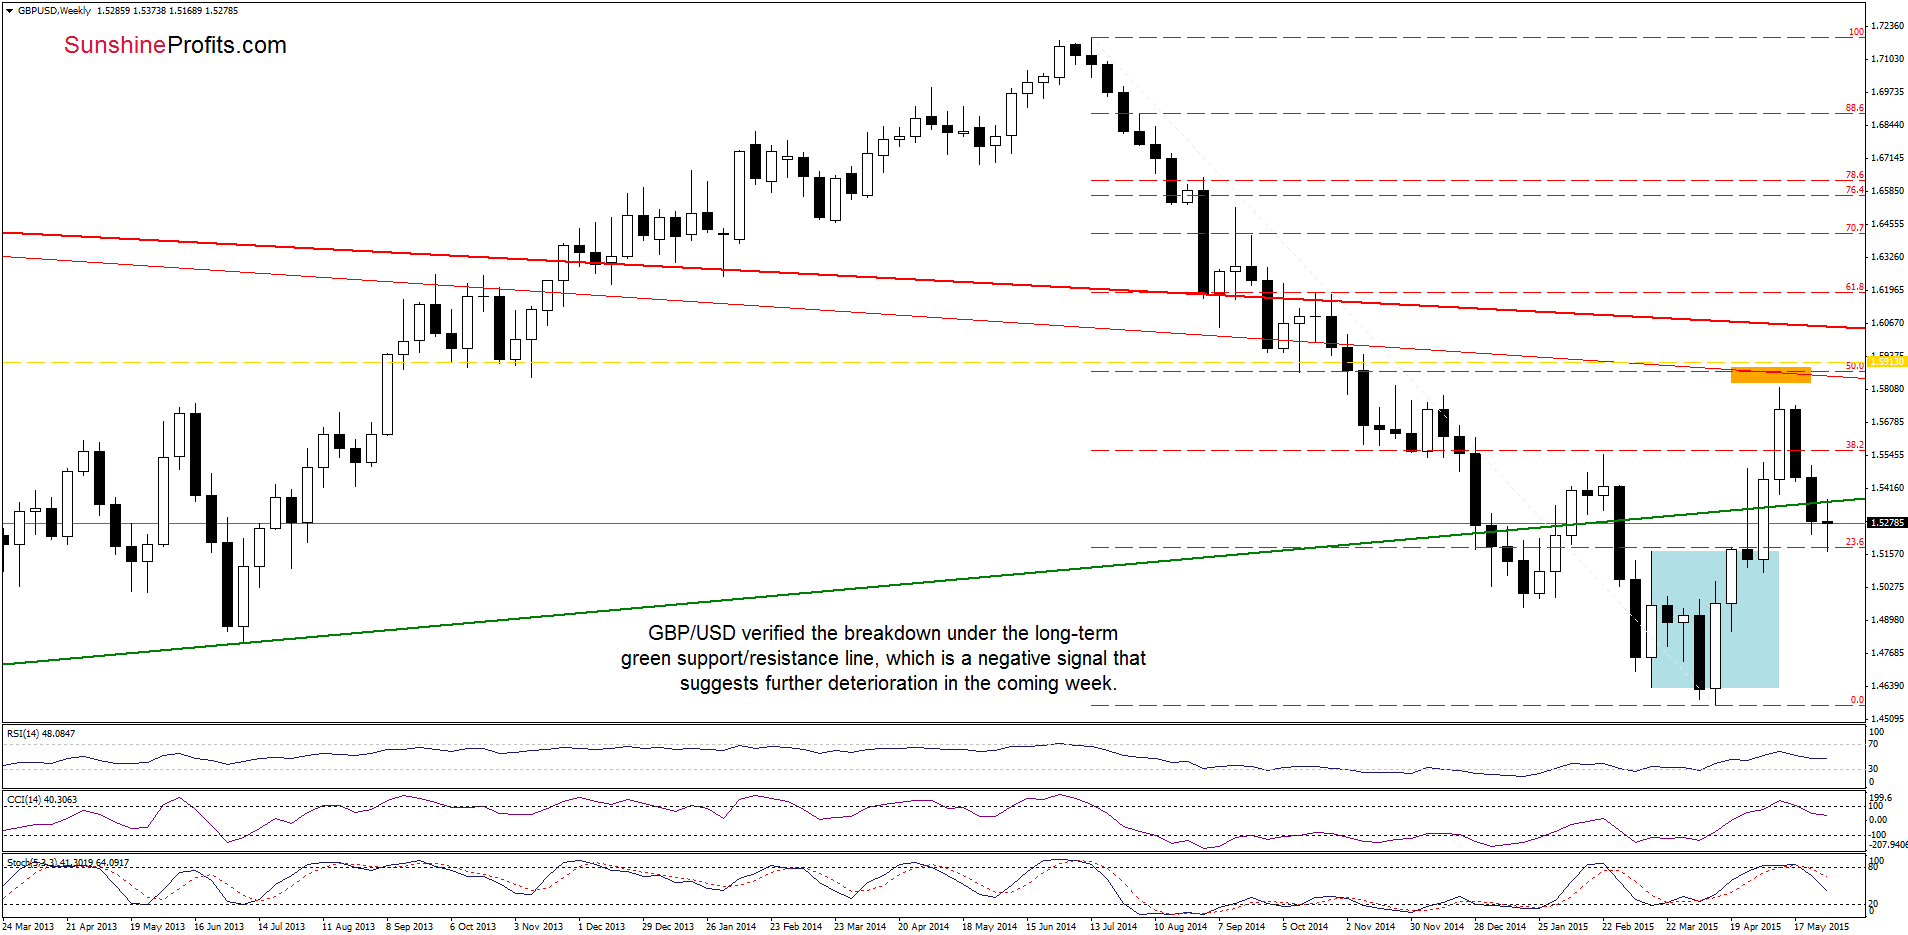
On the weekly chart we see that GBP/USD verified the breakdown under the long-term green support/resistance line, which is a negative signal that suggests further deterioration (especially when we factor in sell signals generated by the indicators).
How low could the pair go in the coming days? Let’s take a closer look at the daily chart and find out.
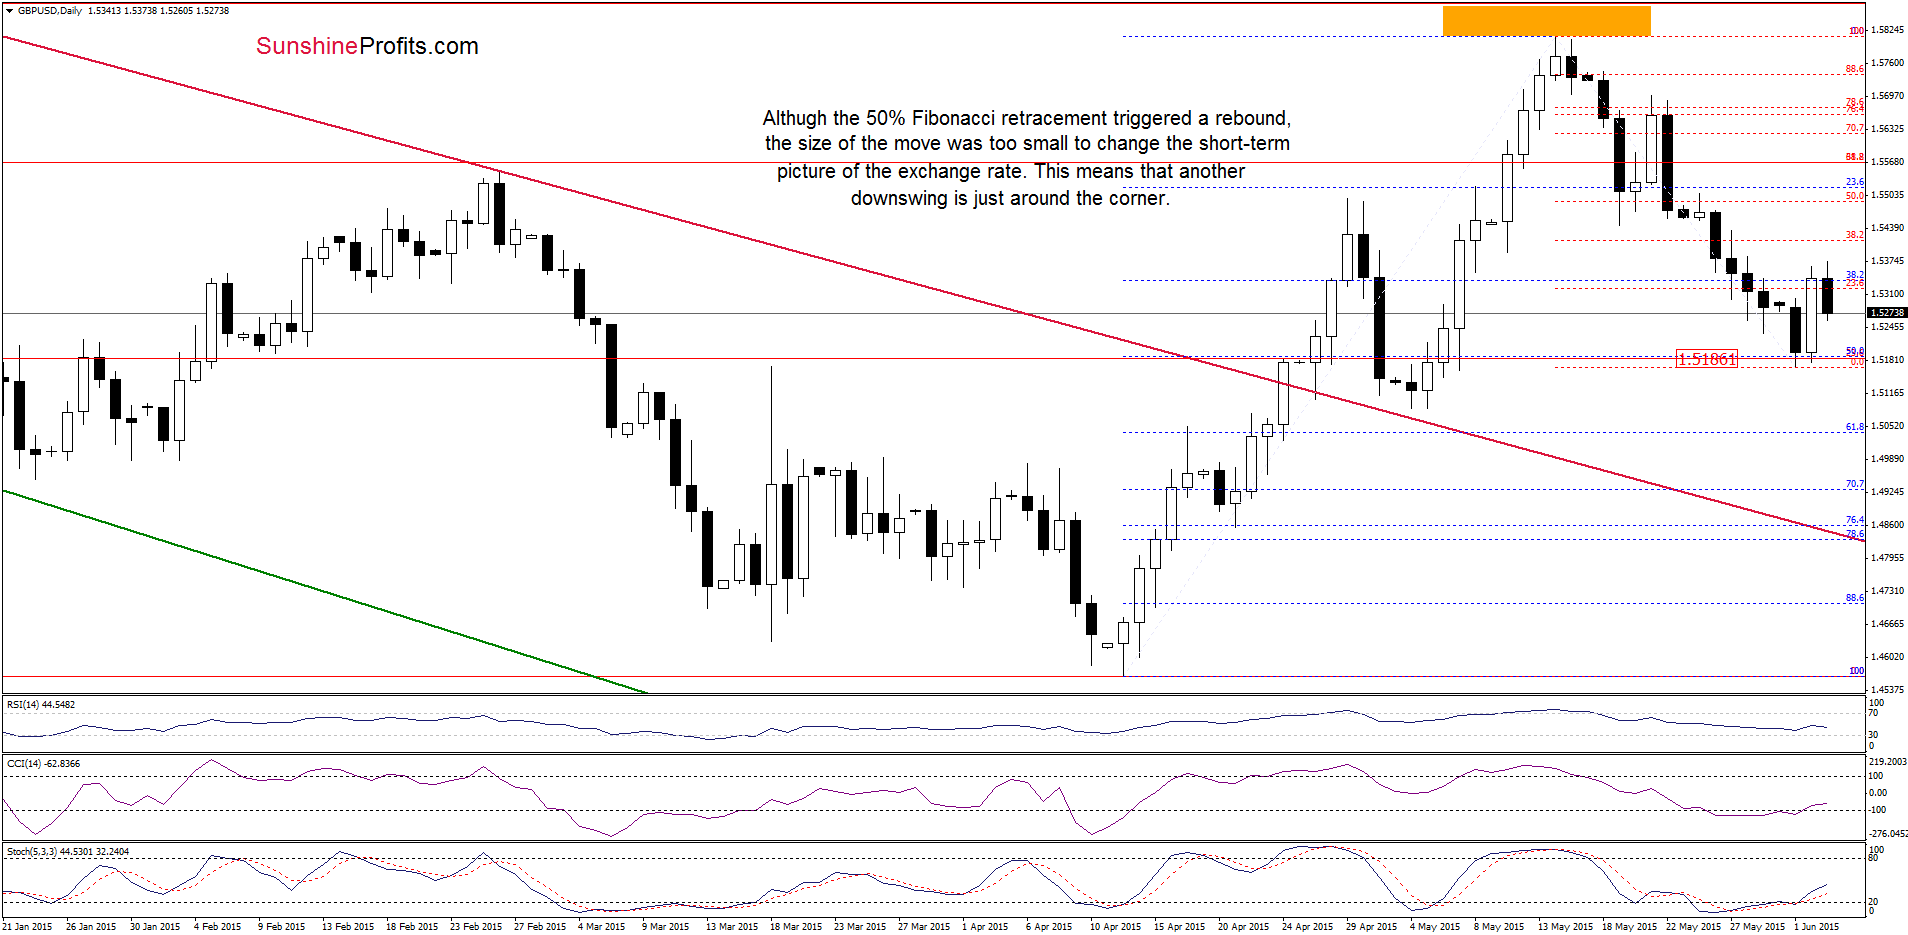
Quoting our last commentary on this currency pair:
(…) GBP/USD reversed and declined once again, slipping under the Friday’s low, which suggests that we’ll see (at least) a test of the 50% retracement (around 1.5190) in the coming days.
From today’s point of view we see that the situation developed in line with the above scenario and GBP/USD reached our downside target. Yesterday, this support level triggered a rebound, but the upswing didn’t even reach the 38.2% Fibonacci retracement (based on the recent declines), which means that the very short-term outlook remains bearish and further drops are just around the corner. If this is the case, and the pair declines from here, the initial downside target would be around 1.5190, where the recent low is. If it is broken, we might see a downward move even to 1.5088-1.5122, where the bottom of the previous correction (at the beginning of May) is.
Very short-term outlook: bearish
Short-term outlook: mixed with bearish bias
MT outlook: mixed
LT outlook: mixed
Trading position (short-term; our opinion): Short positions (which are profitable) with a stop-loss order at 1.5913 are justified from the risk/reward perspective at the moment. We will keep you informed should anything change, or should we see a confirmation/invalidation of the above.
AUD/USD
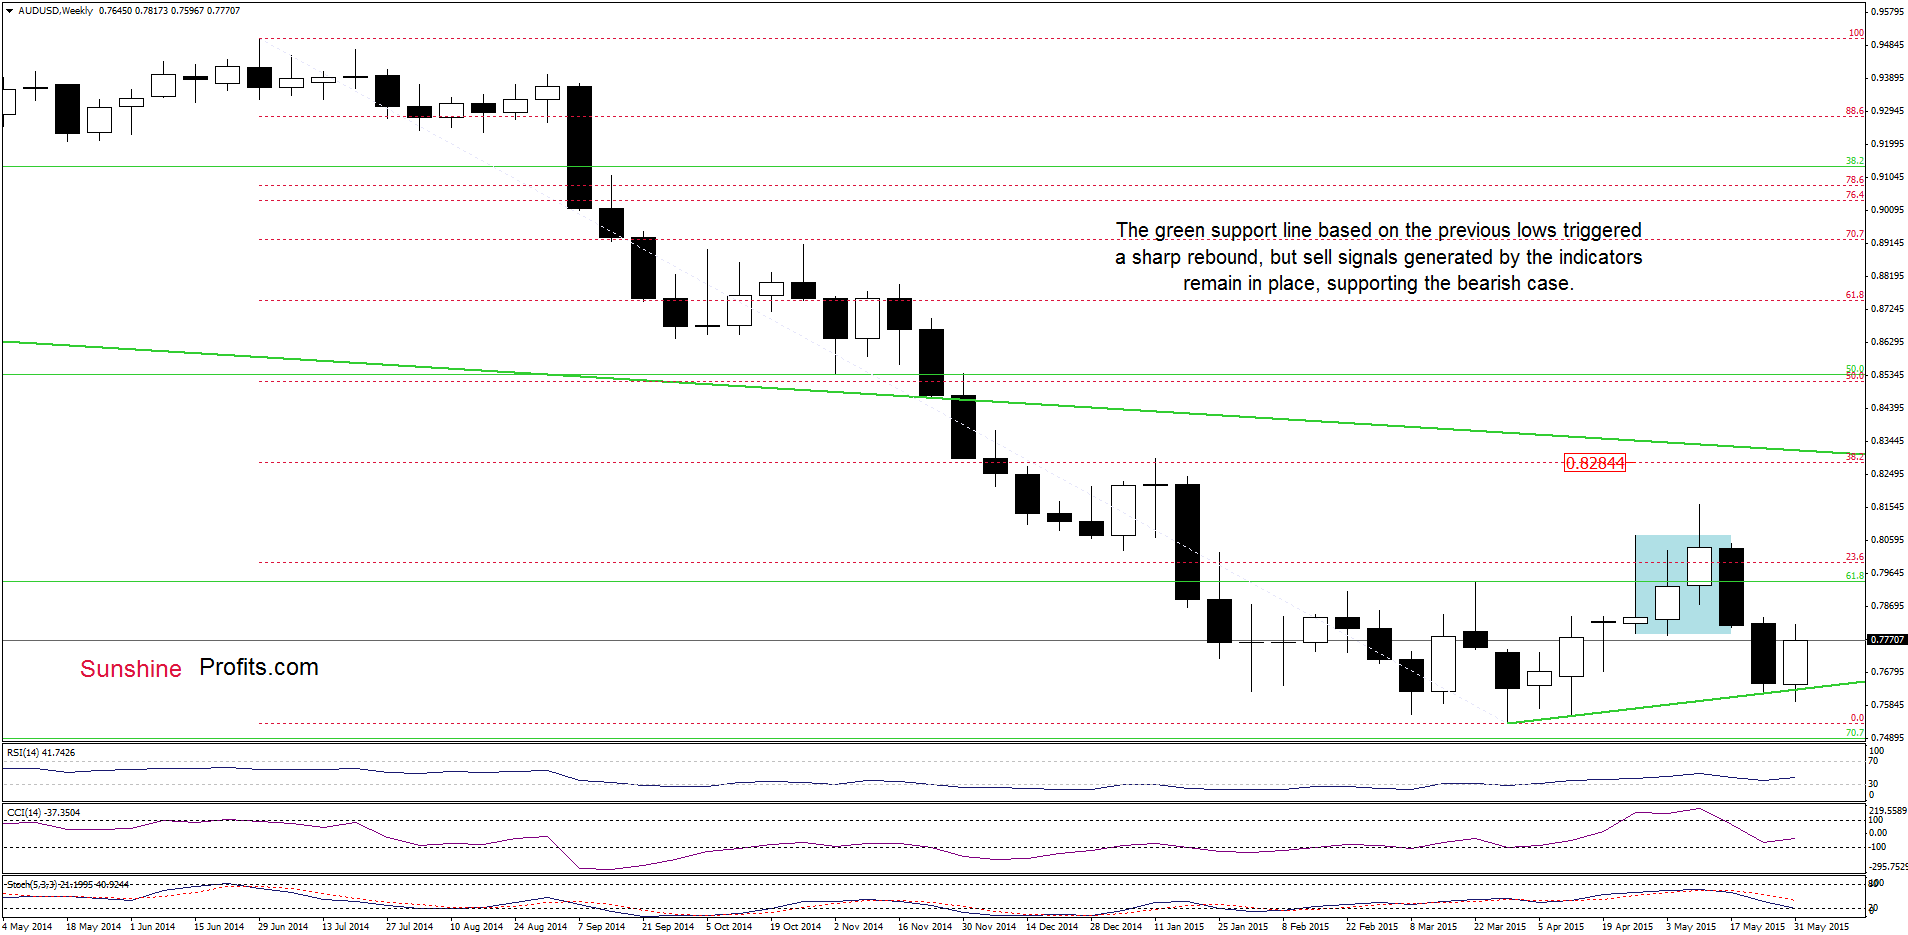
As you see on the weekly chart, the support line based on the Mar and Apr lows triggered a sharp rebound, which approached the exchange rate to the last week’s low. But did this move change the very short-term picture?
Let’s examine the daily chart and find out.
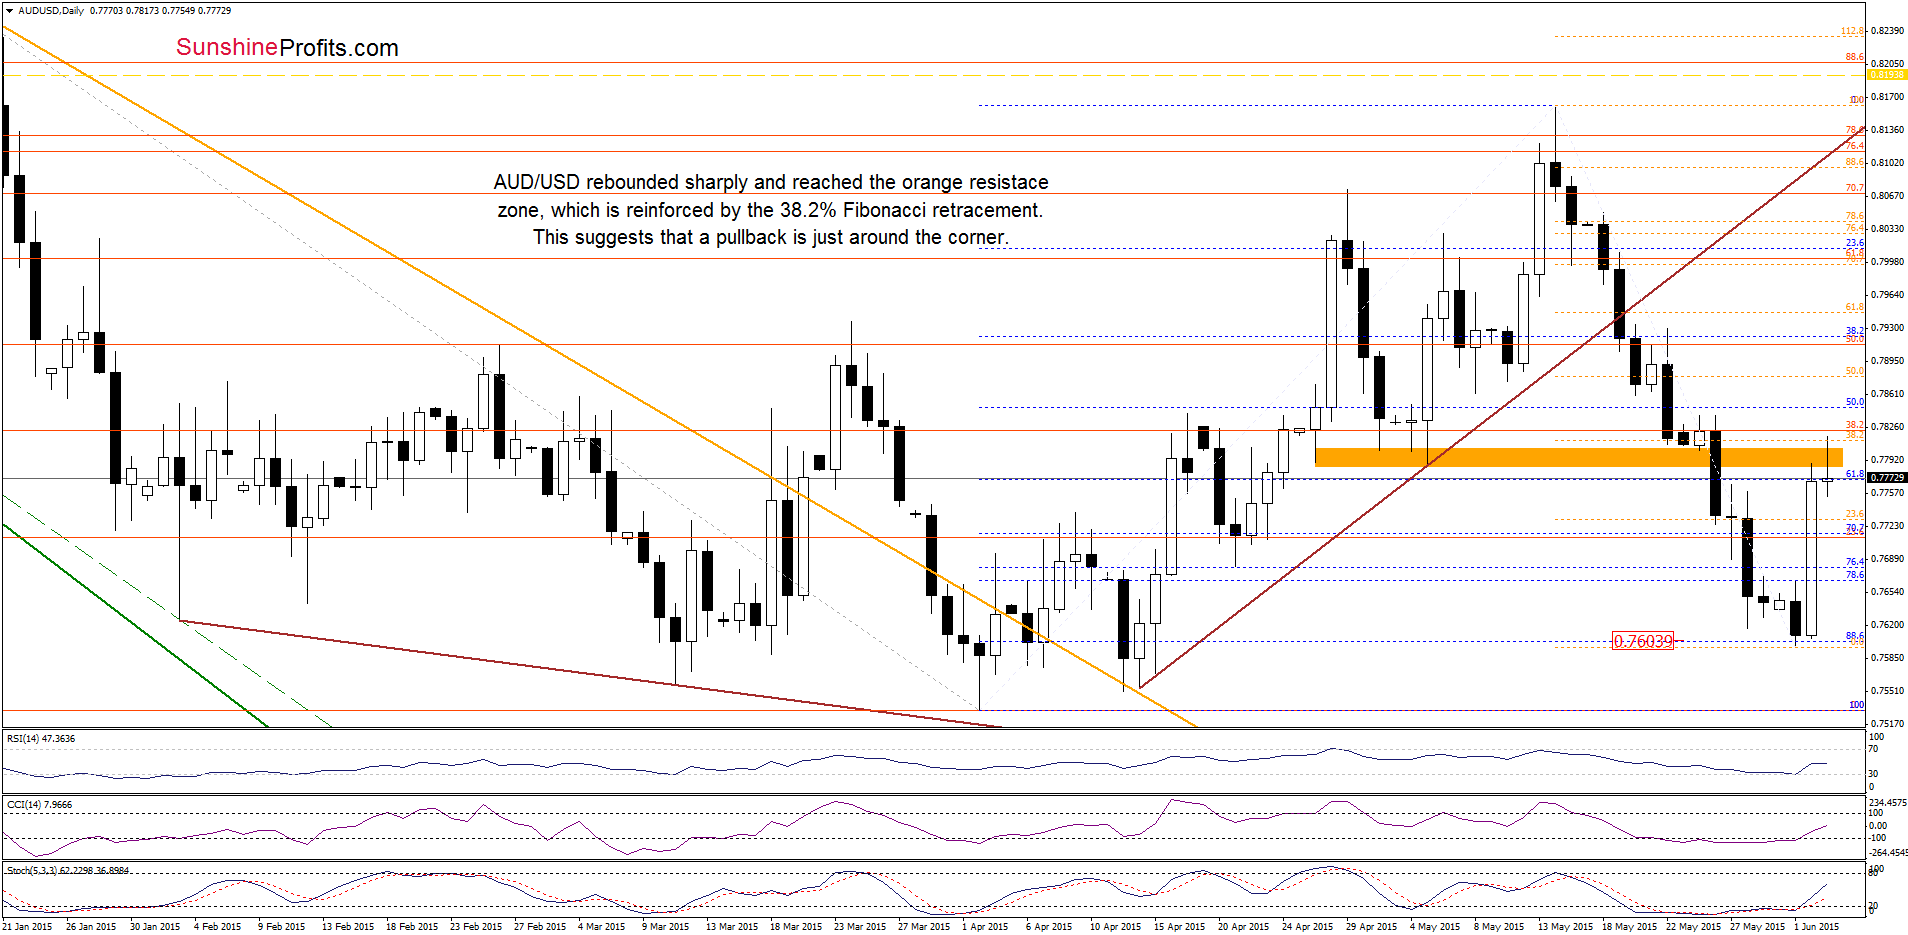
On the daily chart we see that the 88.6% Fibonacci retracement triggered a sharp rebound, which took the pair above the Apr 21 low and the 76.4% and 78.6% Fibonacci retracements, invalidating earlier breakdown. Although this is a positive signal, we should keep in mind that yesterday’s rally took the exchange rate to the orange area (created by the Apr 27 and May lows and reinforced by the 38.2% Fibonacci retracement based on the entire recent decline), which will likely trigger a pullback from here in the coming day(s). If this is the case, we’ll see a drop to around 0.7681, where the Apr 21 low is.
Very short-term outlook: bearish
Short-term outlook: mixed with bearish bias
MT outlook: mixed
LT outlook: mixed
Trading position (short-term; our opinion): Short positions (which are profitable) with a stop-loss order at 0.8194 are justified from the risk/reward perspective at the moment. We will keep you informed should anything change, or should we see a confirmation/invalidation of the above.
Thank you.
Nadia Simmons
Forex & Oil Trading Strategist
Forex Trading Alerts
Oil Investment Updates
Oil Trading Alerts

