

Earlier today, the USD Index extended rally and hit a four week high, climbing to 97.49. Although we saw a small pullback, it seems that higher values of the greenback are ahead us. What does it mean for USD/CHF? Will we finally see a successful breakout above the major resistance zone?
In our opinion the following forex trading positions are justified - summary:
- EUR/USD: Short positions (stop-loss order at 1.1667)
- GBP/USD: Short positions (stop-loss order at 1.5913)
- USD/JPY: none
- USD/CAD: Long positions (stop-loss order at 1.1706)
- USD/CHF: none
- AUD/USD: Short positions (stop-loss order at 0.8194)
EUR/USD
Quoting our last commentary on this currency pair:
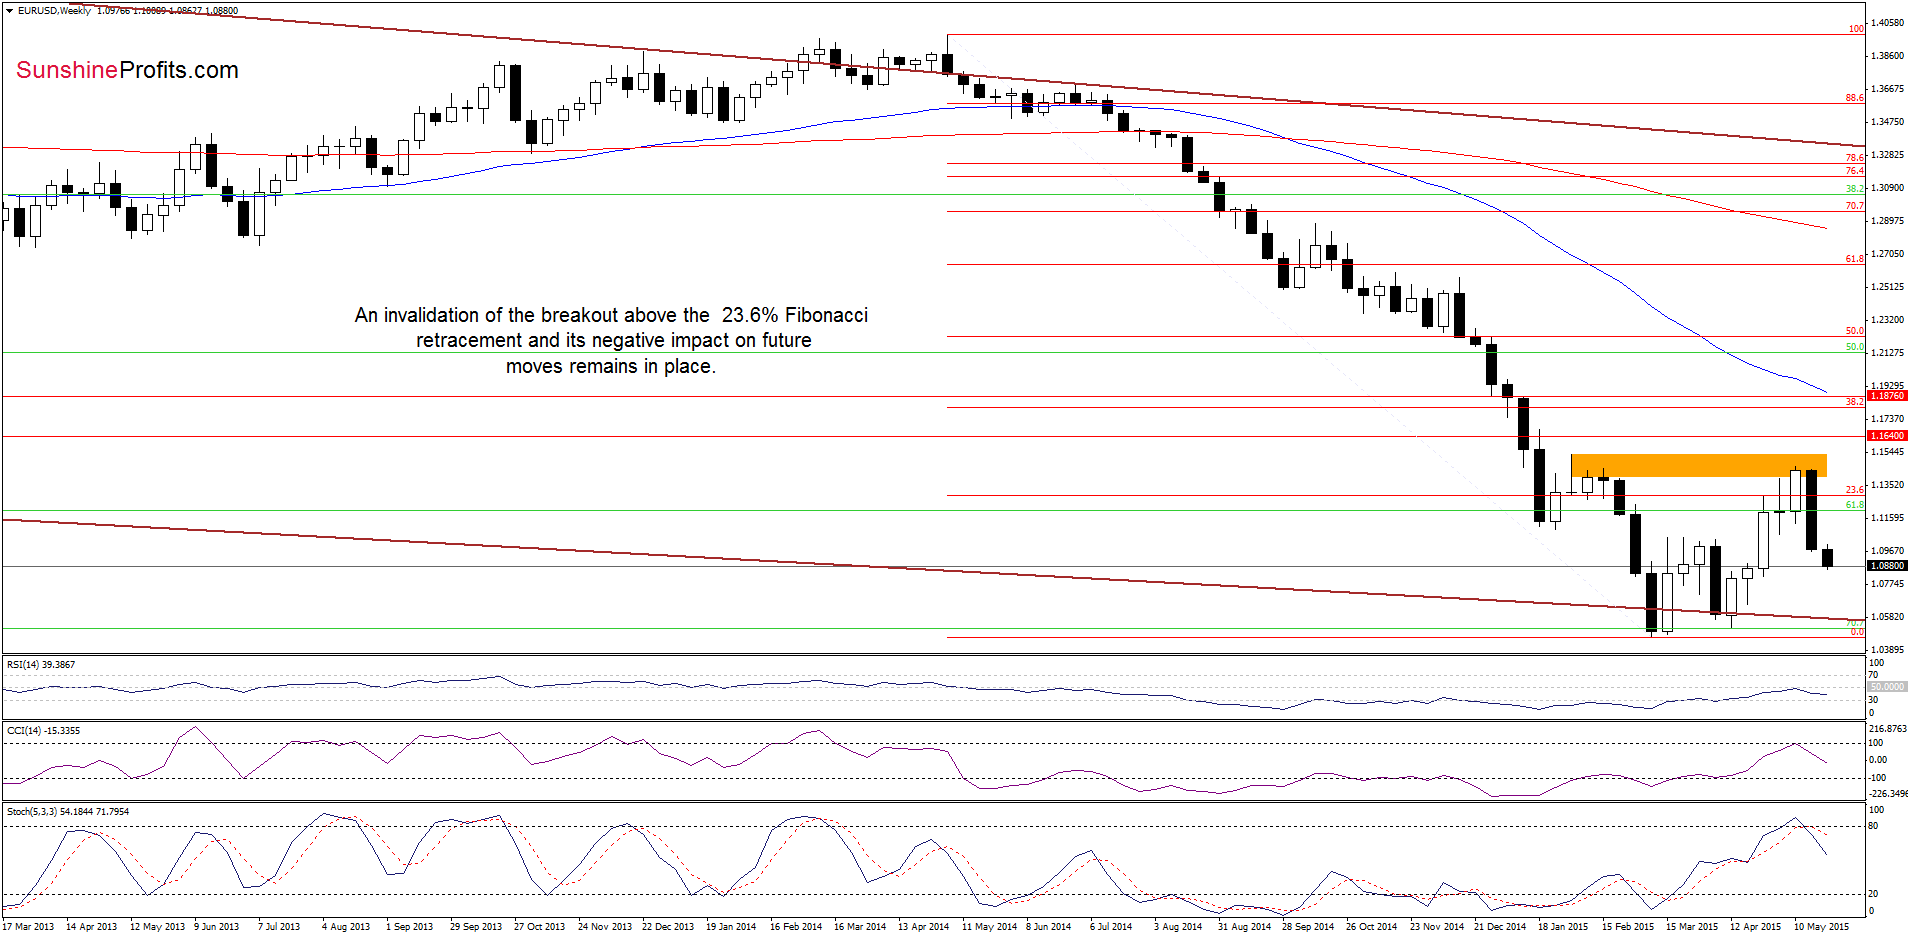
(…) the pair extended losses and declined (…), reaching the 61.8% Fibonacci retracement level (based on the Apr-May rally). Although the exchange rate could rebound from here, we think that as long as there are no buy signals generated by the indicators (and an invalidation of the breakdown under the green dashed line) another downswing is likely. If this is the case, the next target would be around 1.0793, where the 70.7% Fibonacci retracement is.
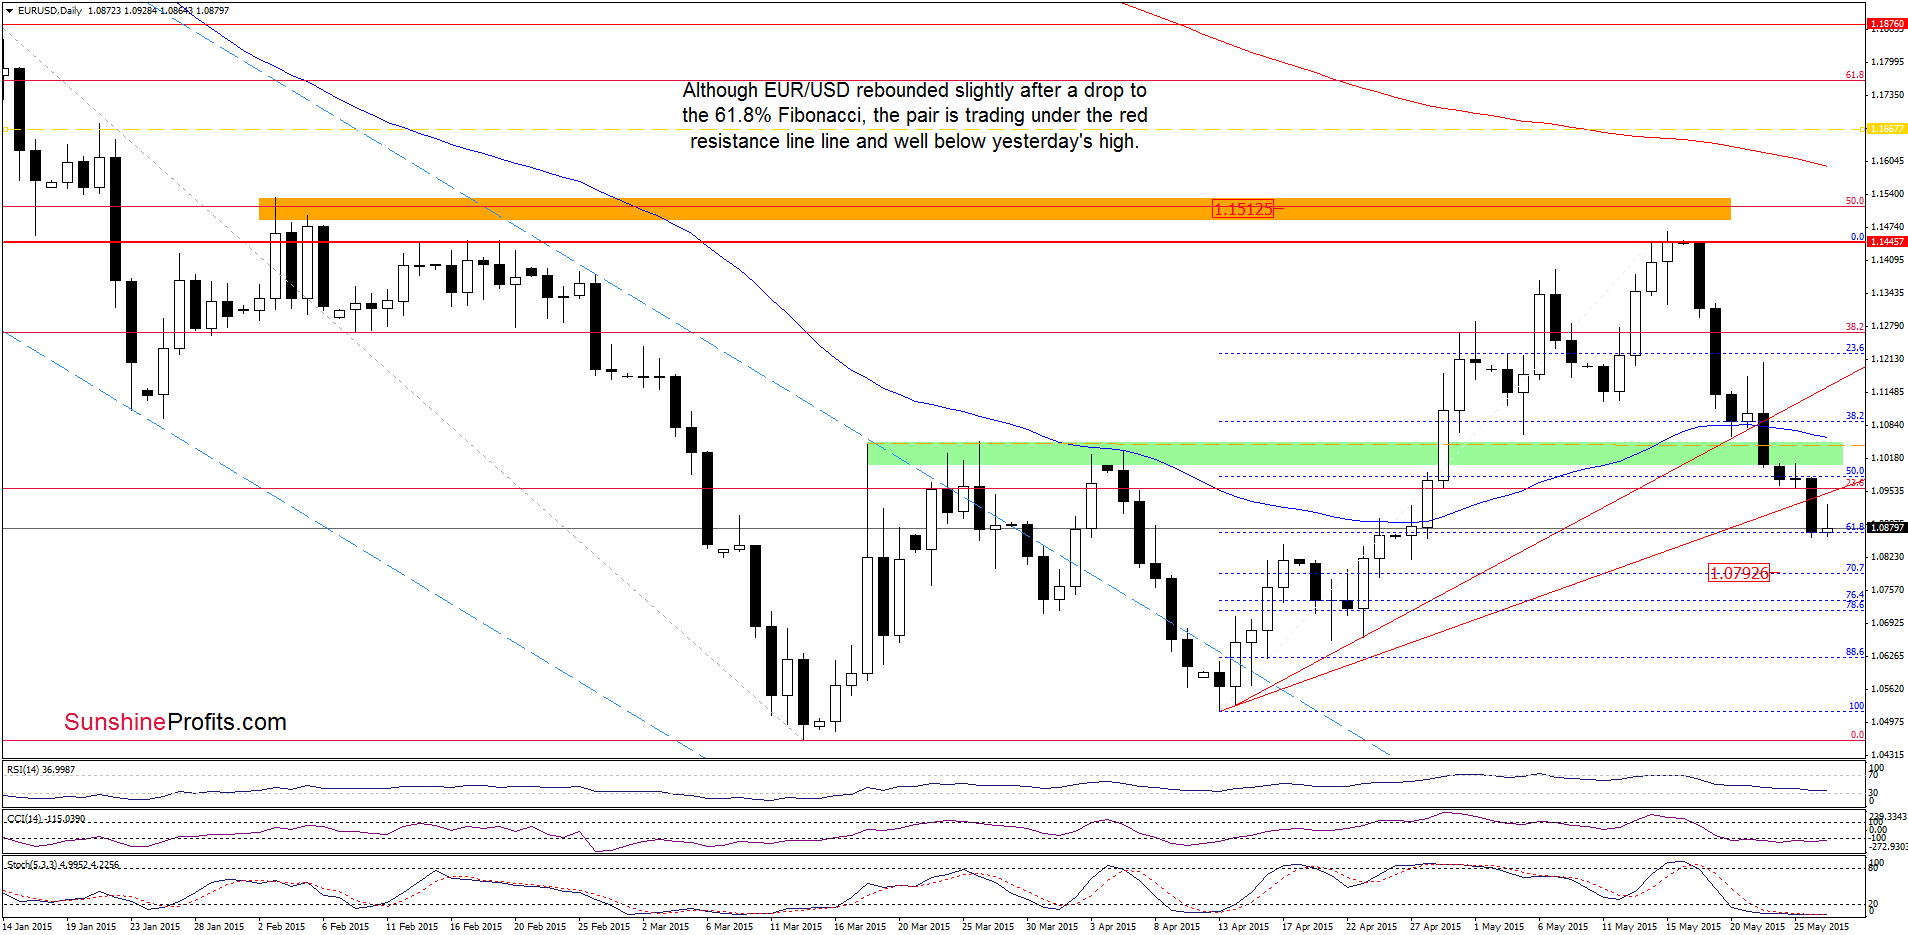
Looking at the daily chart, we see that EUR/USD moved little higher earlier today (as expected). Despite this small rebound, the exchange rate still remains under the red rising resistance line and well below yesterday’s high. Taking the above into account, and combining with the current position of the indicators (the CCI and Stochastic Oscillator are oversold, but there are no buy signals at the moment) and the medium-term picture, we think that lower values of he exchange rate are ahead us. If this is the case, the downside target from our previous commentary (the 70.7% Fibonacci retracement) will be in play.
Very short-term outlook: bearish
Short-term outlook: mixed with bearish bias
MT outlook: mixed
LT outlook: mixed
Trading position (short-term; our opinion): Short positions (which are already profitable) with a stop-loss order at 1.1667 are justified from the risk/reward perspective at the moment. We will keep you informed should anything change, or should we see a confirmation/invalidation of the above.
USD/CHF
In our last commentary on this currency pair, we wrote the following:
(…) the current position of the indicators (the CCI and Stochastic Oscillator are oversolid, while the latter is very close to generating a buy signal) suggests that another upswing is likely just around the corner.
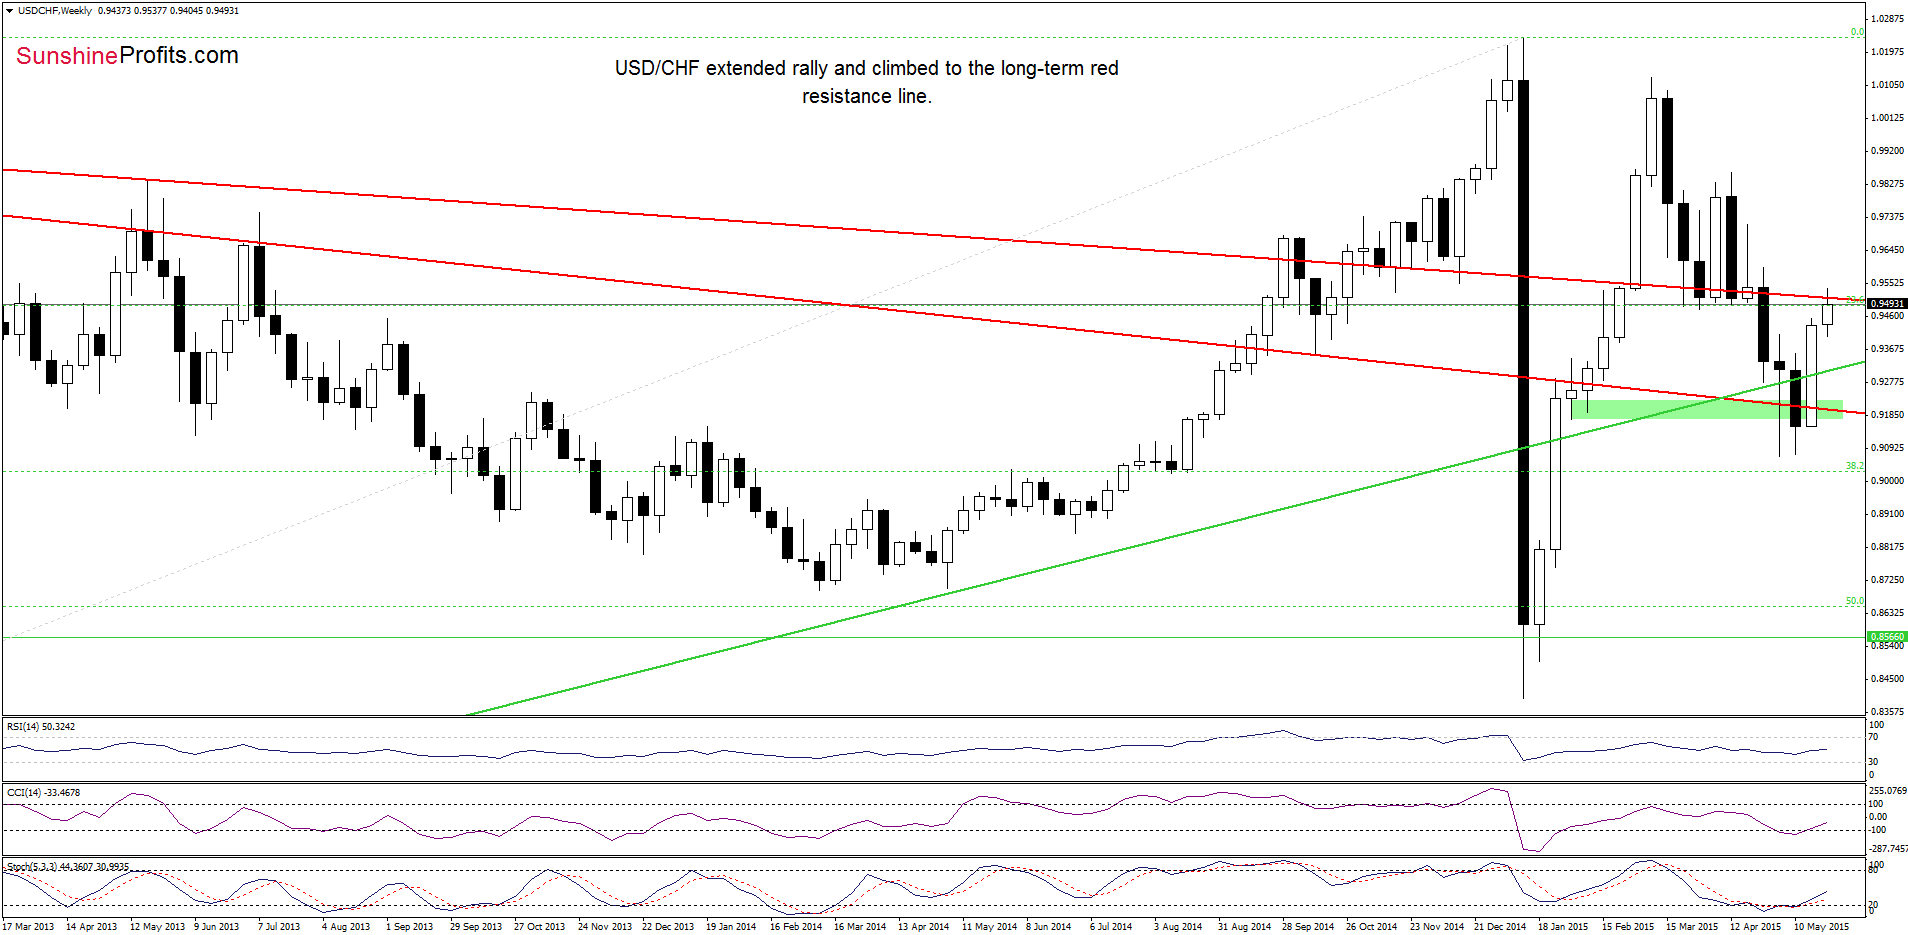
As you see on the weekly chart, the situationn developed in line with the above scenario and currency bulls pushed the exchange rate higher. With this upward move, USD/CHF invalidated earlier breakdown unde the red and green support/resistance lines, which triggered a rally to the long-term red resistance line.
Will we also see a comeback above it? Before we try to answer this question, let’s examine the daily chart and find out what can we infer from it.
Quoting our las commentary on USD/CHF:
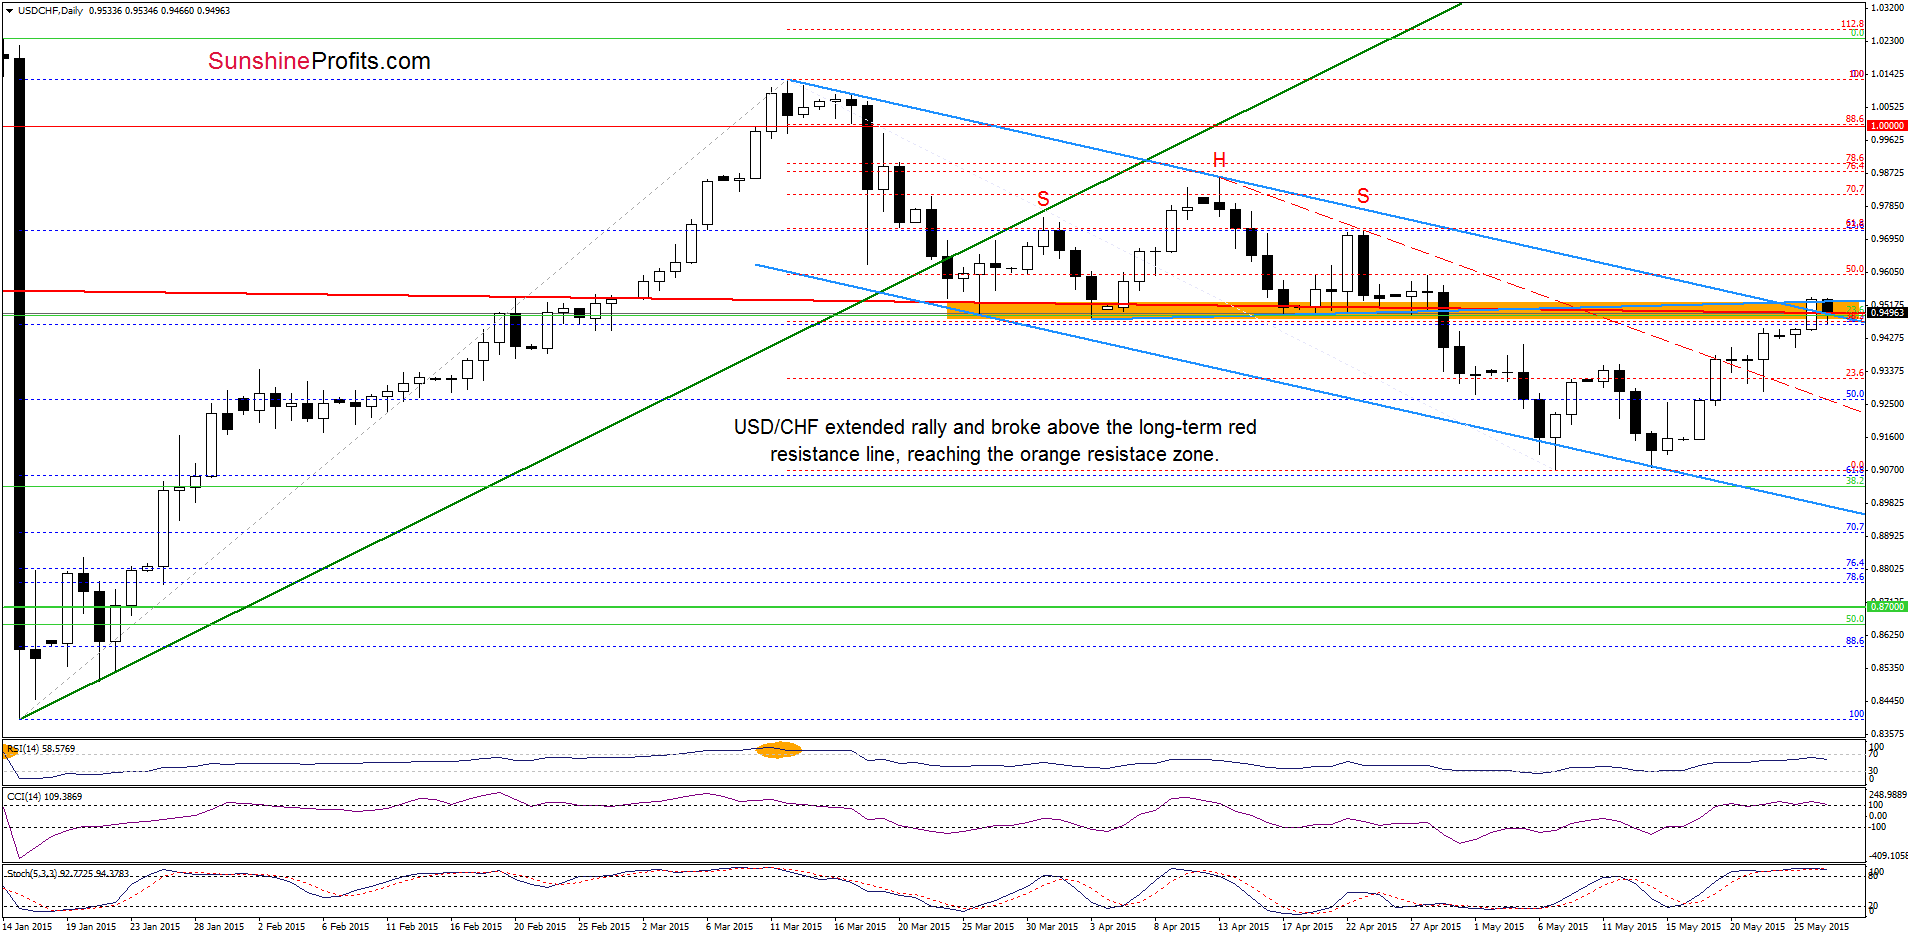
(…) the RSI generated a buy signal, while the CCI is very close to doing the same, which could translate to another upswing in the coming day(s). If this is the case and we see further improvement, the initial upside target would be around 0.9315, where the 23.6% Fibonacci retracement (based on the entire Mar-May declines) is.
From today’s point of view, we see that currency bulls not only took the pair to our initial upside target, but also managed to push it above the red declining dashed line, which resulted in a rally to the orange resistance zone created by the Mar and Apr lows, the long-term red resistance line and the neck line of the head and shoulders formation (marked with blue). Yesterday, we saw a small breakout above this key resistance zone, but it was invalidated earlier today. Despite today’s pullback, the exchange rate is trading very close to yesterday’s high, which suggests another attempt to move higher. At this point, it is worth noting that the CCI and Stochastic Oscillator are overbought, but we think that as long as there are no sell signals another upswing can’t be ruled out. If this is the case, and the pair moves higher from here, the initial upside target would be around 0.9600, where the 50% Fibonacci retracement (based on the entire Mar-May declines) is.
Very short-term outlook: mixed
Short-term outlook: mixed
MT outlook: mixed
LT outlook: bearish
Trading position (short-term; our opinion): No positions are justified from the risk/reward perspective at the moment. We will keep you informed should anything change, or should we see a confirmation/invalidation of the above.
AUD/USD
In our Forex Trading Alert posted on May 18, we wrote the following:
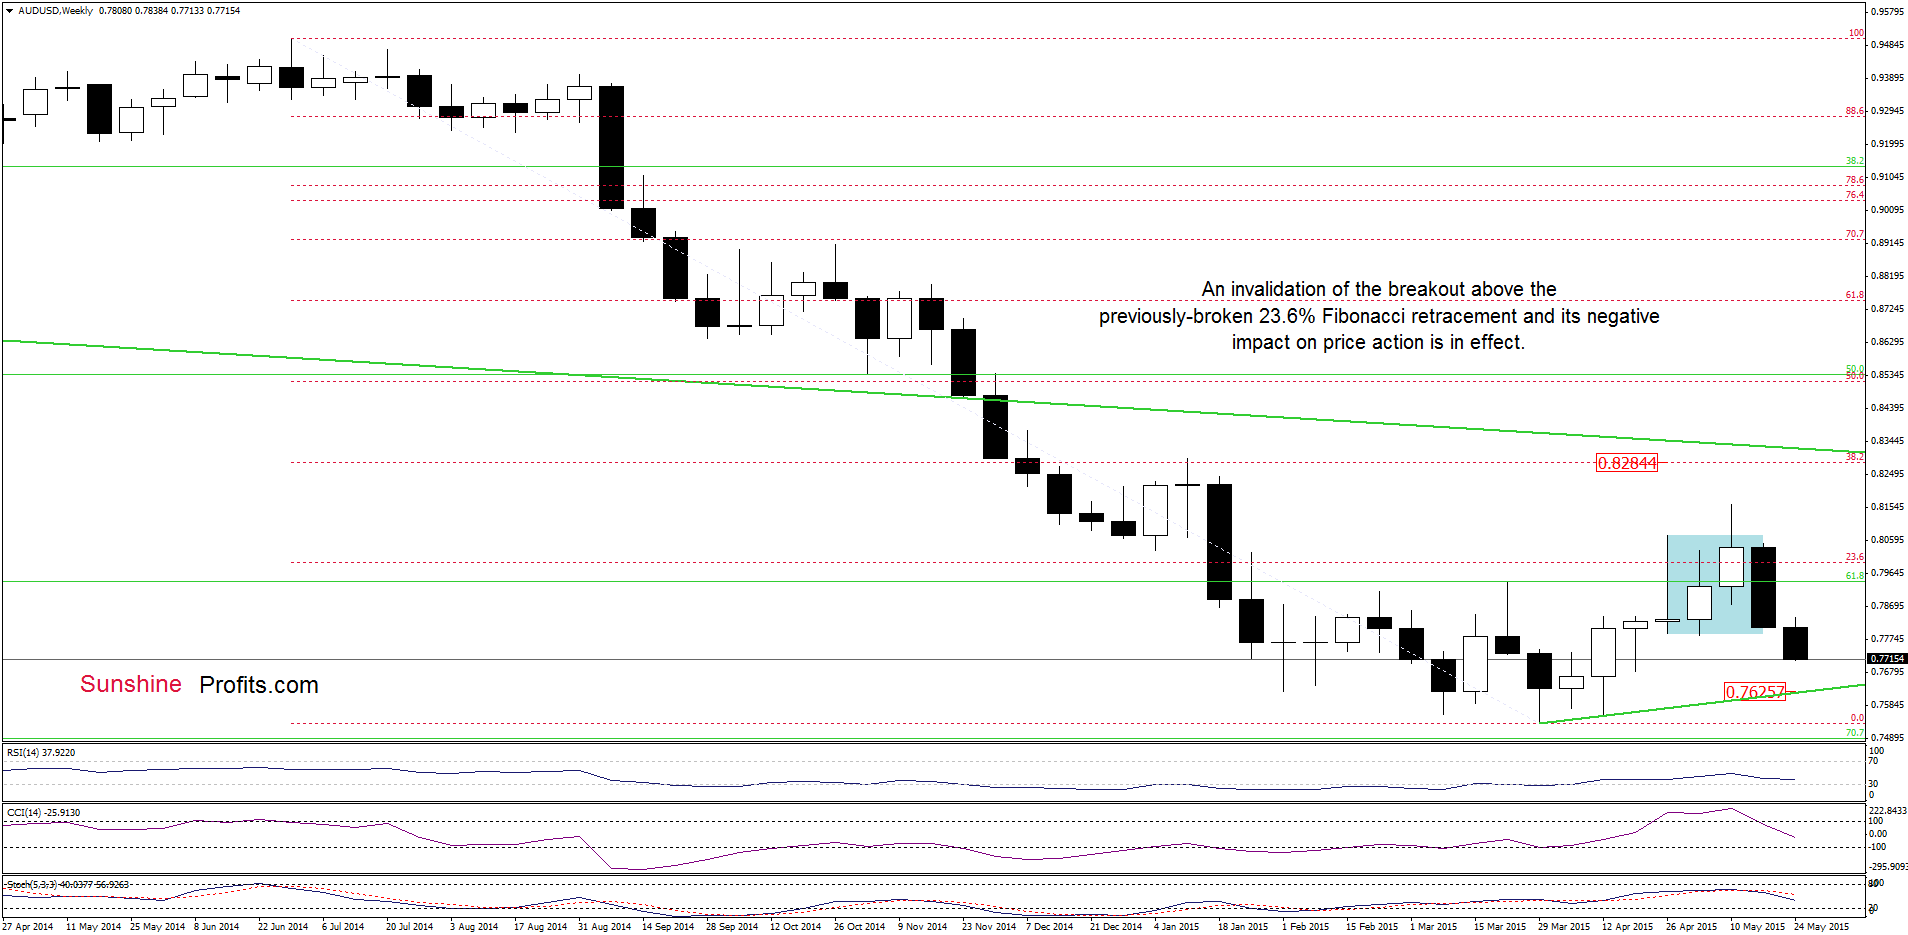
AUD/USD moved lower and slipped to the 23.6% Fibonacci retracement. If the exchange rate invalidates earlier breakout above this level, correction of the recent rally will likely accelerate (especially if weekly indicators generate sell signals in the coming week).
As you see on the weekly chart, the situation developed in line with the above scenario and AUD/USD moved sharply lower, closing the previous week well below the 23.6% Fibonacci retracement. Earlier this week, the exchange rate extended losses, which in combination with sell signals generated by the indicators suggest further declines.
How low could the pair go in the coming days? Let’s examine the daily chart and find out.
Quoting our last commentary on AUD/USD:
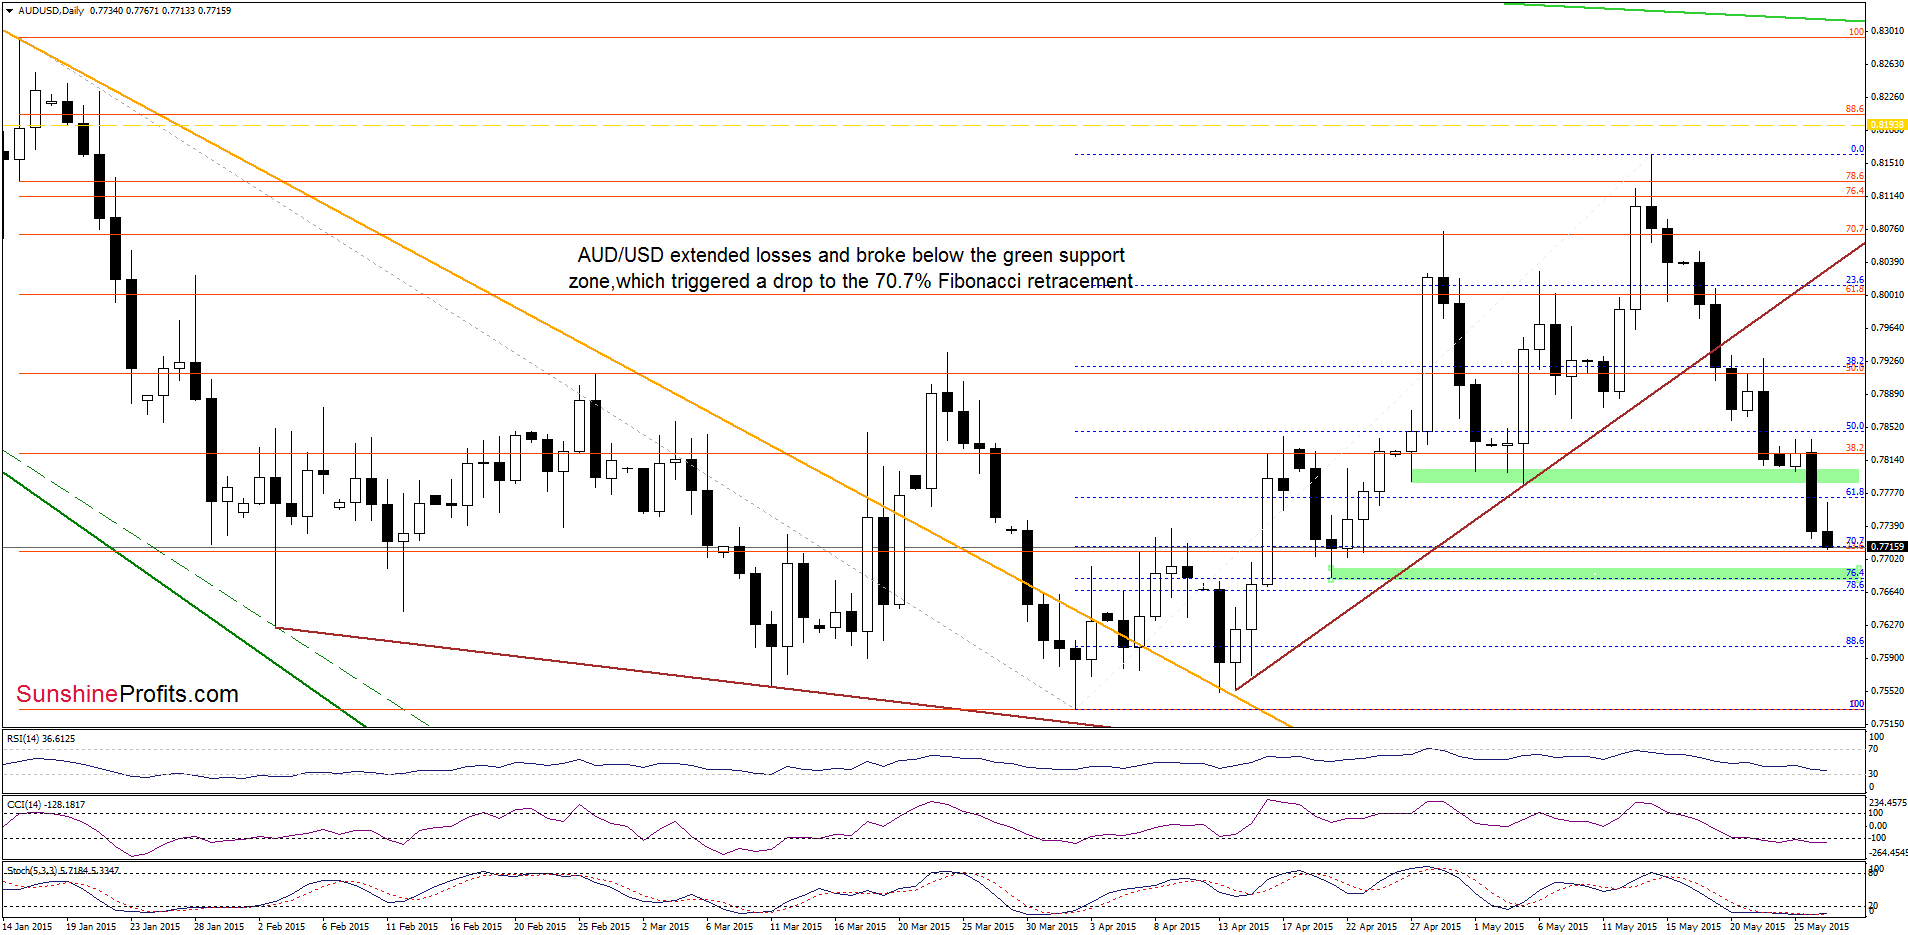
(…) the exchange rate slipped to the recent low, which in combination with the current position of the indicators (sell signals remain in place, supporting the bearish case) suggests that further deterioration is just around the corner. If this is the case, and the pair moves lower from here, the initial downside target would be the brown rising support line (around 0.7931). If it is broken, the next target will be around 0.7920, where the 38.2% Fibonacci retracement levels (based on the entire Apr-May rally) is.
Looking at the daily chart, we see that currency bears not only pushed the exchange rate to our initial downside target, but also took it below the green support zone (based on the Apr 27 and May lows) and the 61.8% Fibonacci retracement. Earlier today, AUD/USD reached the 70.7% Fibonacci retracement, which suggests that we could see a rebound from here. Nevertheless, taking into account earlier breakdowns, the current position of the indicators (the CCI and Stochastic Oscillator are oversold, but there are no buy signals at the moment) and the medium-term picture, we think that another downswing is likely. If this is the case, and the pair moves lower from here, the downside target would be around 0.7682, where the lower green support zone (created by the Apr 24 low and the 76.4% and 78.6% Fibonacci retracements) is.
Very short-term outlook: bearish
Short-term outlook: mixed with bearish bias
MT outlook: mixed
LT outlook: mixed
Trading position (short-term; our opinion): Short positions (which are already profitable) with a stop-loss order at 0.8194 are justified from the risk/reward perspective at the moment. We will keep you informed should anything change, or should we see a confirmation/invalidation of the above.
Thank you.
Nadia Simmons
Forex & Oil Trading Strategist
Przemyslaw Radomski, CFA
Founder, Editor-in-chief
Gold & Silver Trading Alerts
Forex Trading Alerts
Oil Investment Updates
Oil Trading Alerts

