

Although, the Federal Reserve Bank of New York reported that its Empire State manufacturing index rose less-than-expected (to 3.9, missing forecasts for an increase to 5.00), the USD Index extended gains and came back above 94. Will today’s data on U.S. industrial production and consumer sentiment support further improvement? Before we know the answer to this question, let’s take a closer look at current picture of our six currency pairs.
In our opinion the following forex trading positions are justified - summary:
- EUR/USD: Short positions (stop-loss order at 1.1667)
- GBP/USD: Short positions (stop-loss order at 1.5913)
- USD/JPY: none
- USD/CAD: Long positions (stop-loss order at 1.1706)
- USD/CHF: none
- AUD/USD: Short positions (stop-loss order at 0.8194)
EUR/USD
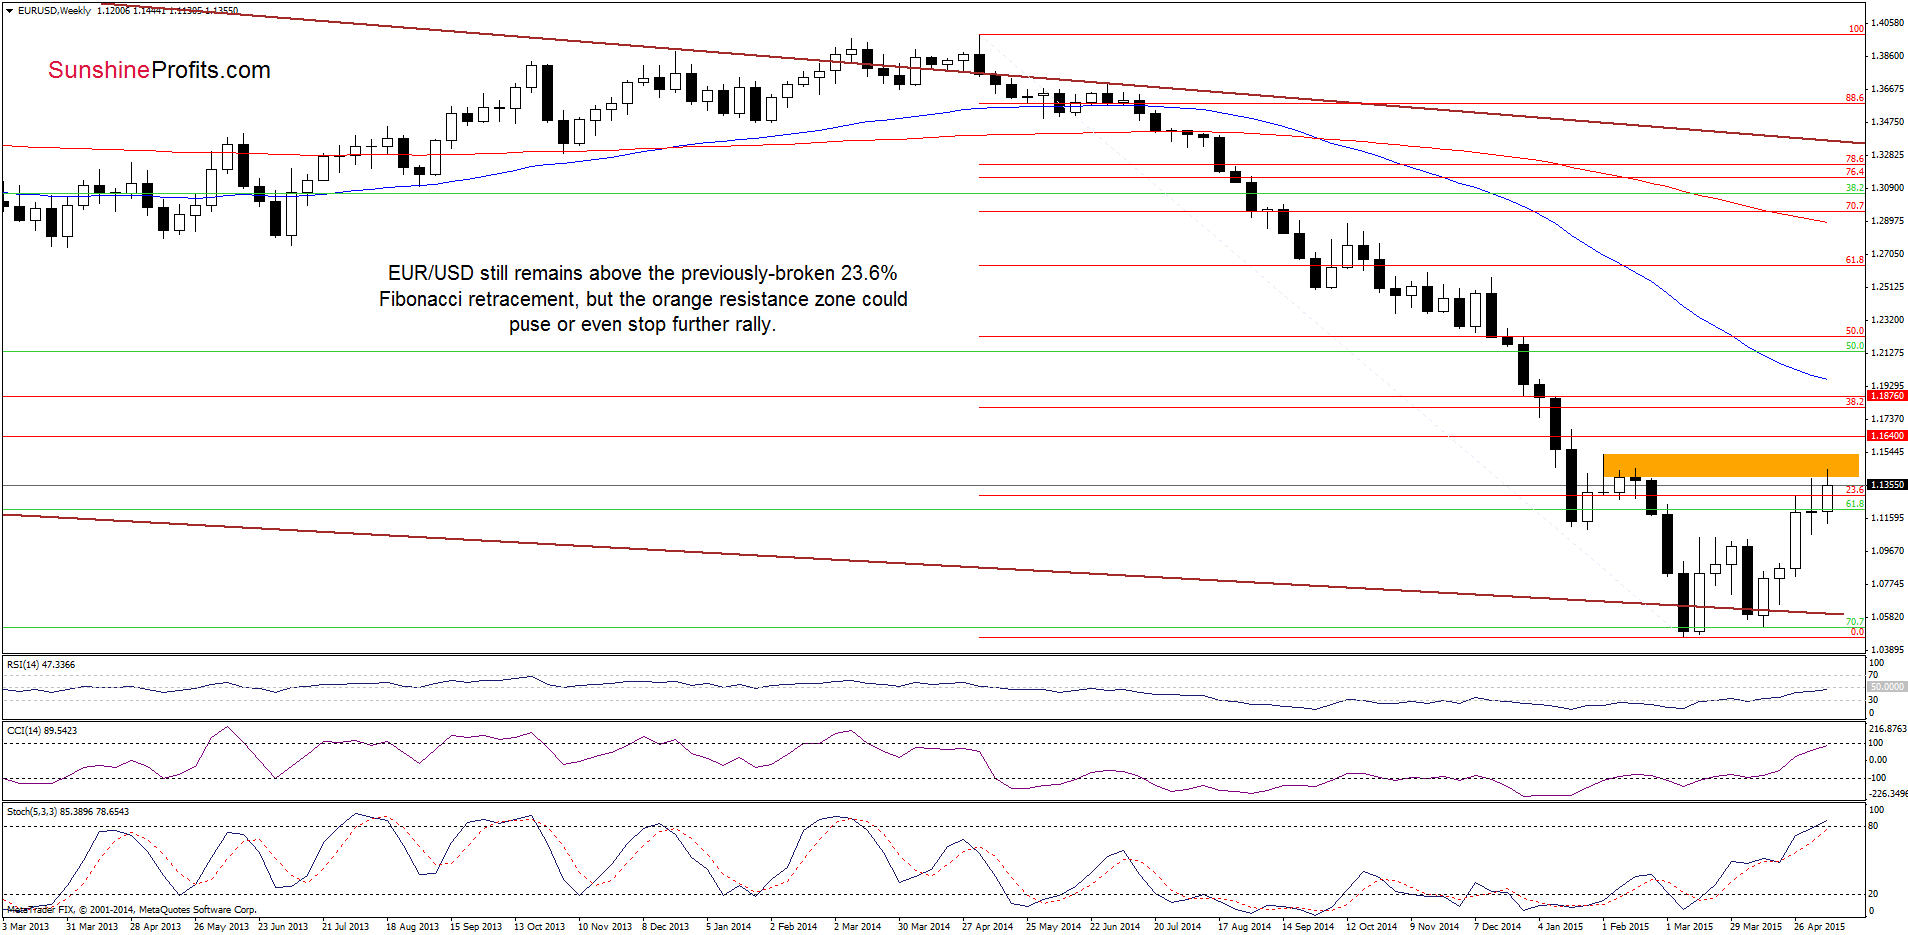
The situation in the medium-term perspective hasn’t changed much as EUR/USD still remains above the previously-broken 23.6% Fibonacci retracement. Nevertheless, the orange resistance zone could pause or even stop further improvement.
Are there any short-term factors that could encourage currency bears to act? Let’s take a closer look at the daily chart and find out.
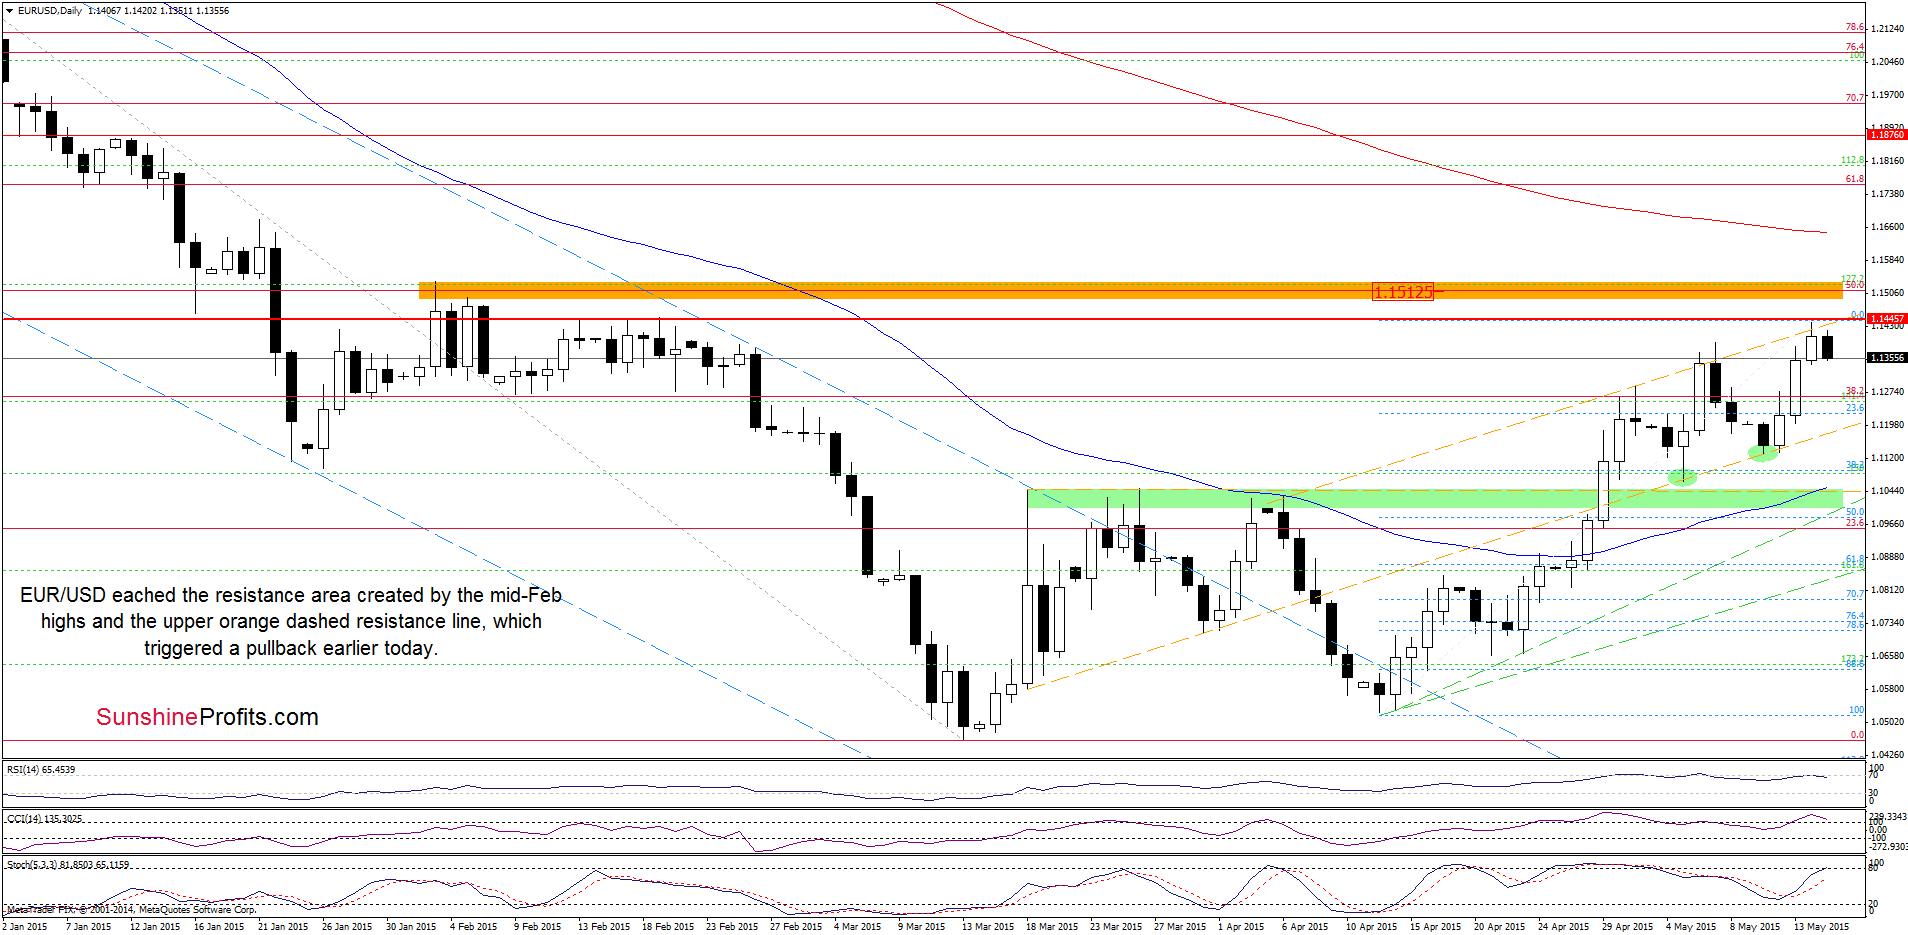
Looking at the daily chart, we see that EUR/USD climbed to the resistance area created by the mid-Feb highs and the dashed orange resistance line, which triggered a pullback earlier today. Taking this fact into account, and combining it with the proximity to the orange resistance zone (created by the 50% Fibonacci retracement and the Feb highs) and the current position of the RSI and CCI (the first of them generated a sell signal, while the latter is overbought and very close to doing the same), it seems that further deterioration is just around the corner. If this is the case, and the exchange rate moves lower form here, the initial downside target would be around 1.1184, where the dashed orange support line currently is.
Very short-term outlook: bearish
Short-term outlook: mixed with bearish bias
MT outlook: mixed
LT outlook: mixed
Trading position (short-term; our opinion): Short positions with a stop-loss order at 1.1667 are justified from the risk/reward perspective at the moment. We will keep you informed should anything change, or should we see a confirmation/invalidation of the above.
GBP/USD
In our last commentary on this currency pair, we wrote the following:
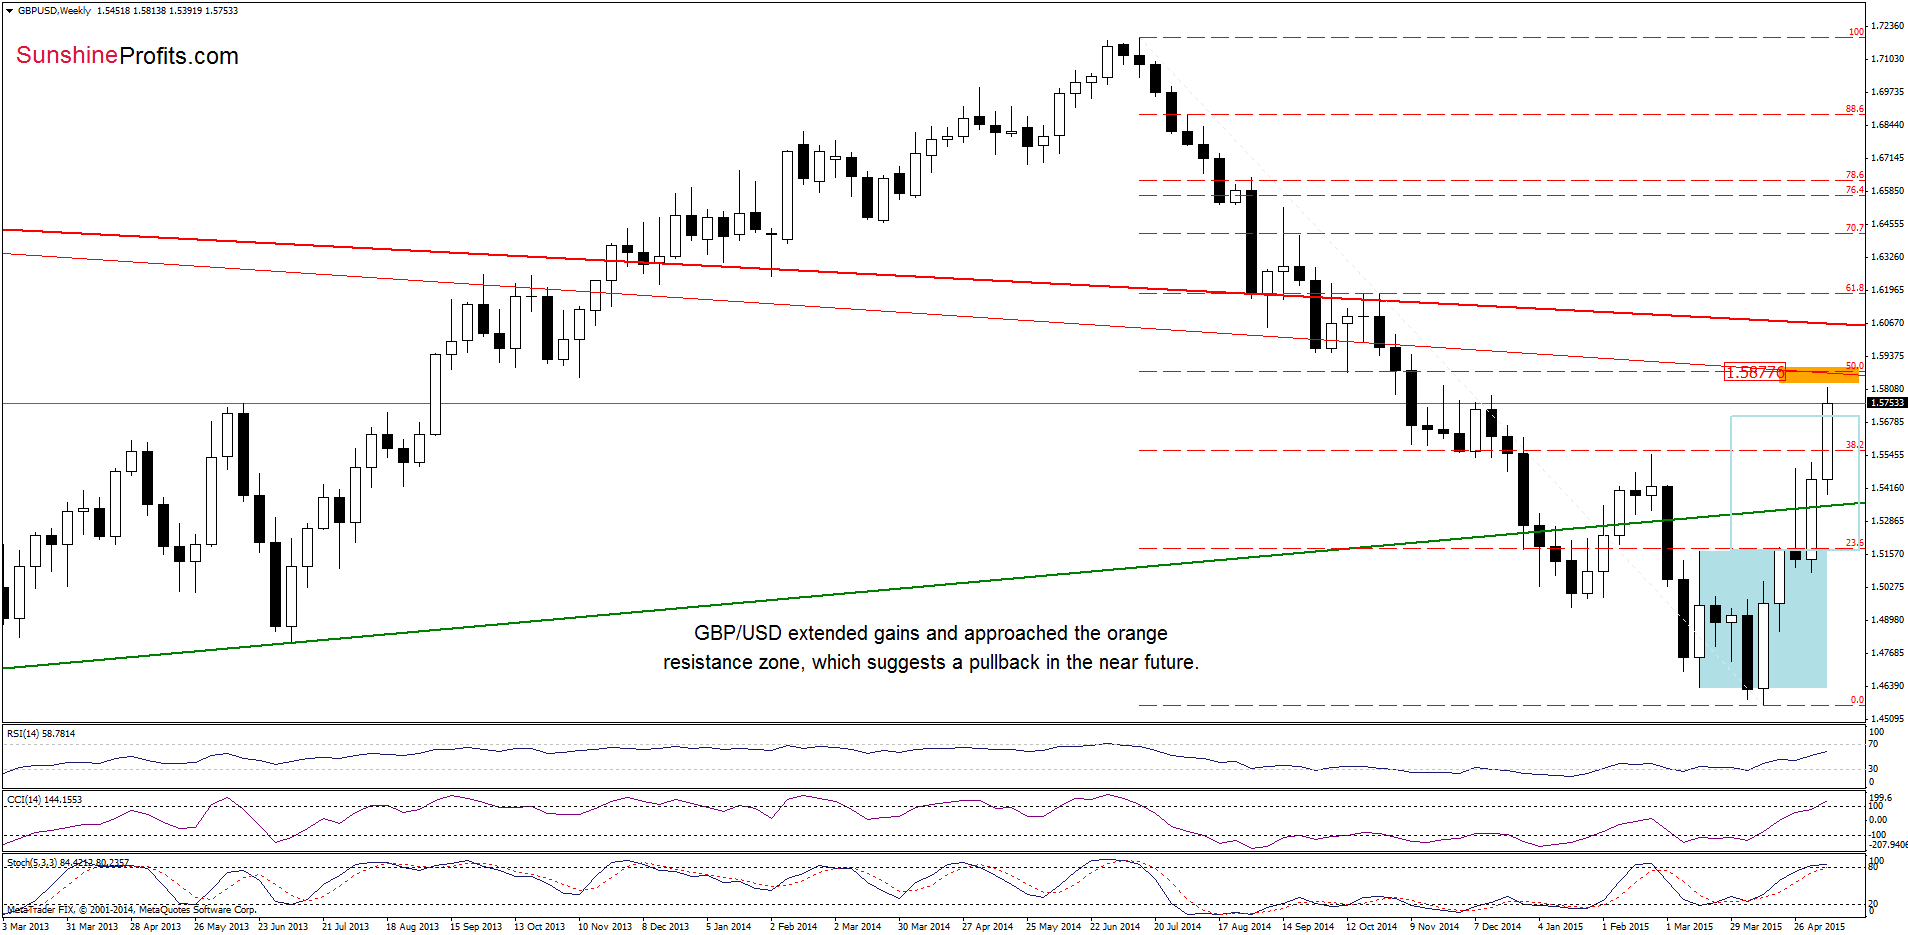
(…) the exchange rate climbed to the 112.8% Fibonacci extension, which suggests that we’ll likely see an increase to around 1.5820-1.5873, where the 127.2% Fibonacci extension, the 50% Fibonacci retracement (based on the entire Jul-Apr declines) and the long-term red resistance line (marked on the weekly chart) are.
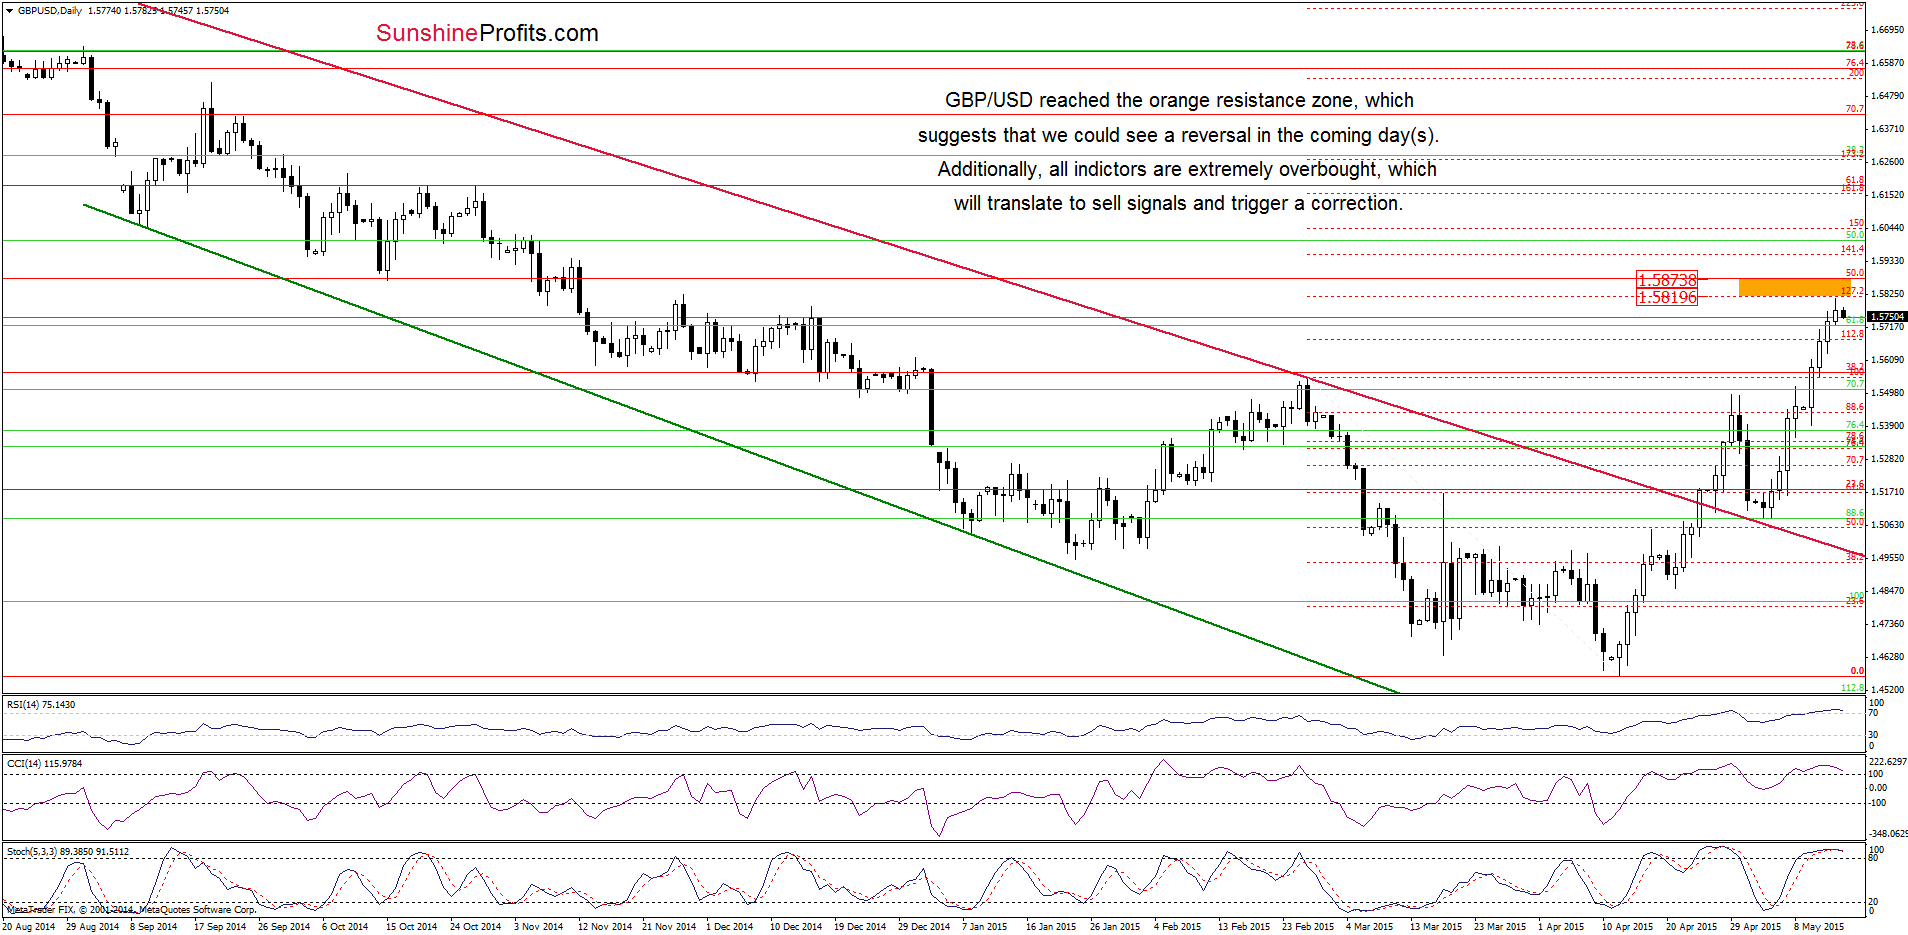
On the above chart, we see that currency bulls pushed GBP/USD higher (as expected), which approached the exchange rate to our upside target. As you see on the charts, the orange resistance zone stopped further rally, triggering a pullback earlier today. Taking this fact into account, and combining it with the current position of the daily indicators (they are very close to generating sell signals, while the weekly indicators are overbought), we think that correction of the recent rally is just around the corner. If this is the case, and the pair moves lower from here, the initial downside target would be around 1.5518, where the 23.6% Fibonacci retracement (based on the entire Apr-May rally) is. If it is broken, the next target would be the 38.2% Fibonacci retracement (around 1.5337) or even the 50% retracement (around 1.5190).
Very short-term outlook: bearish
Short-term outlook: mixed with bearish bias
MT outlook: mixed
LT outlook: mixed
Trading position (short-term; our opinion): Short positions with a stop-loss order at 1.5913 are justified from the risk/reward perspective at the moment. We will keep you informed should anything change, or should we see a confirmation/invalidation of the above.
USD/JPY
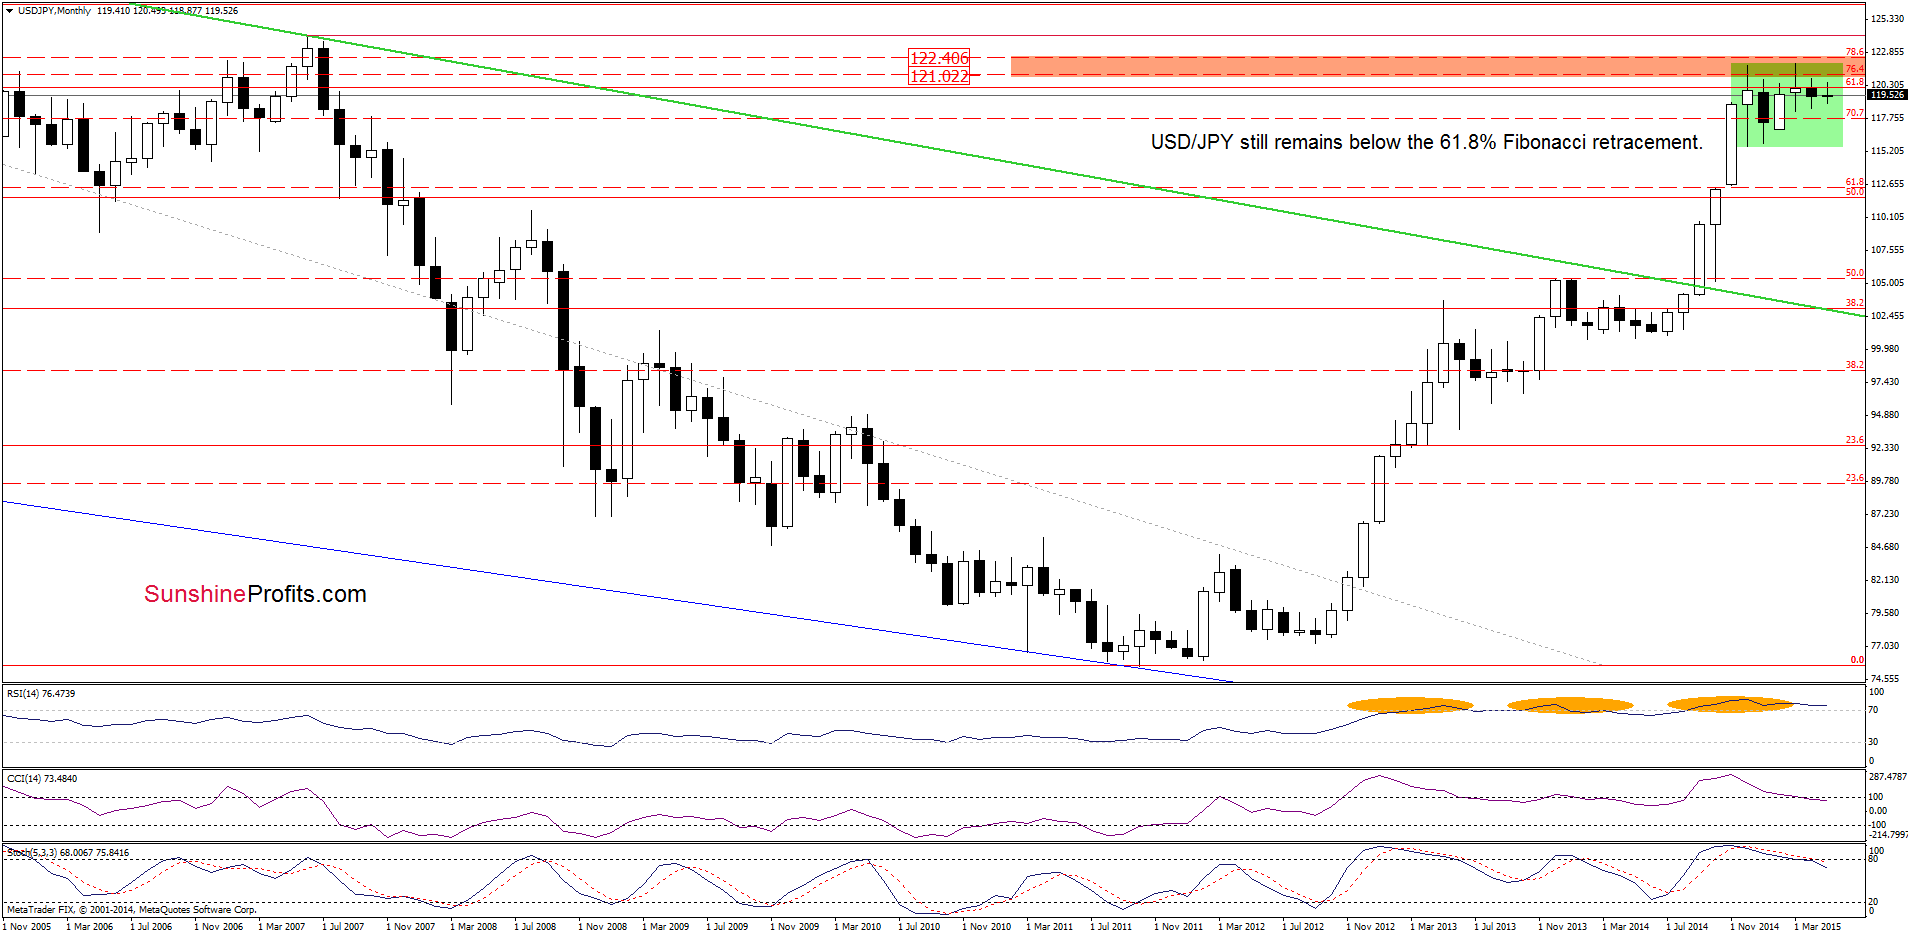
The medium-term picture hasn’t changed much as USD/JPY is still trading in a consolidation under the 61.8% Fibonacci retracement level, which makes the outlook mixed. Today, we’ll focus on the very short-term changes.
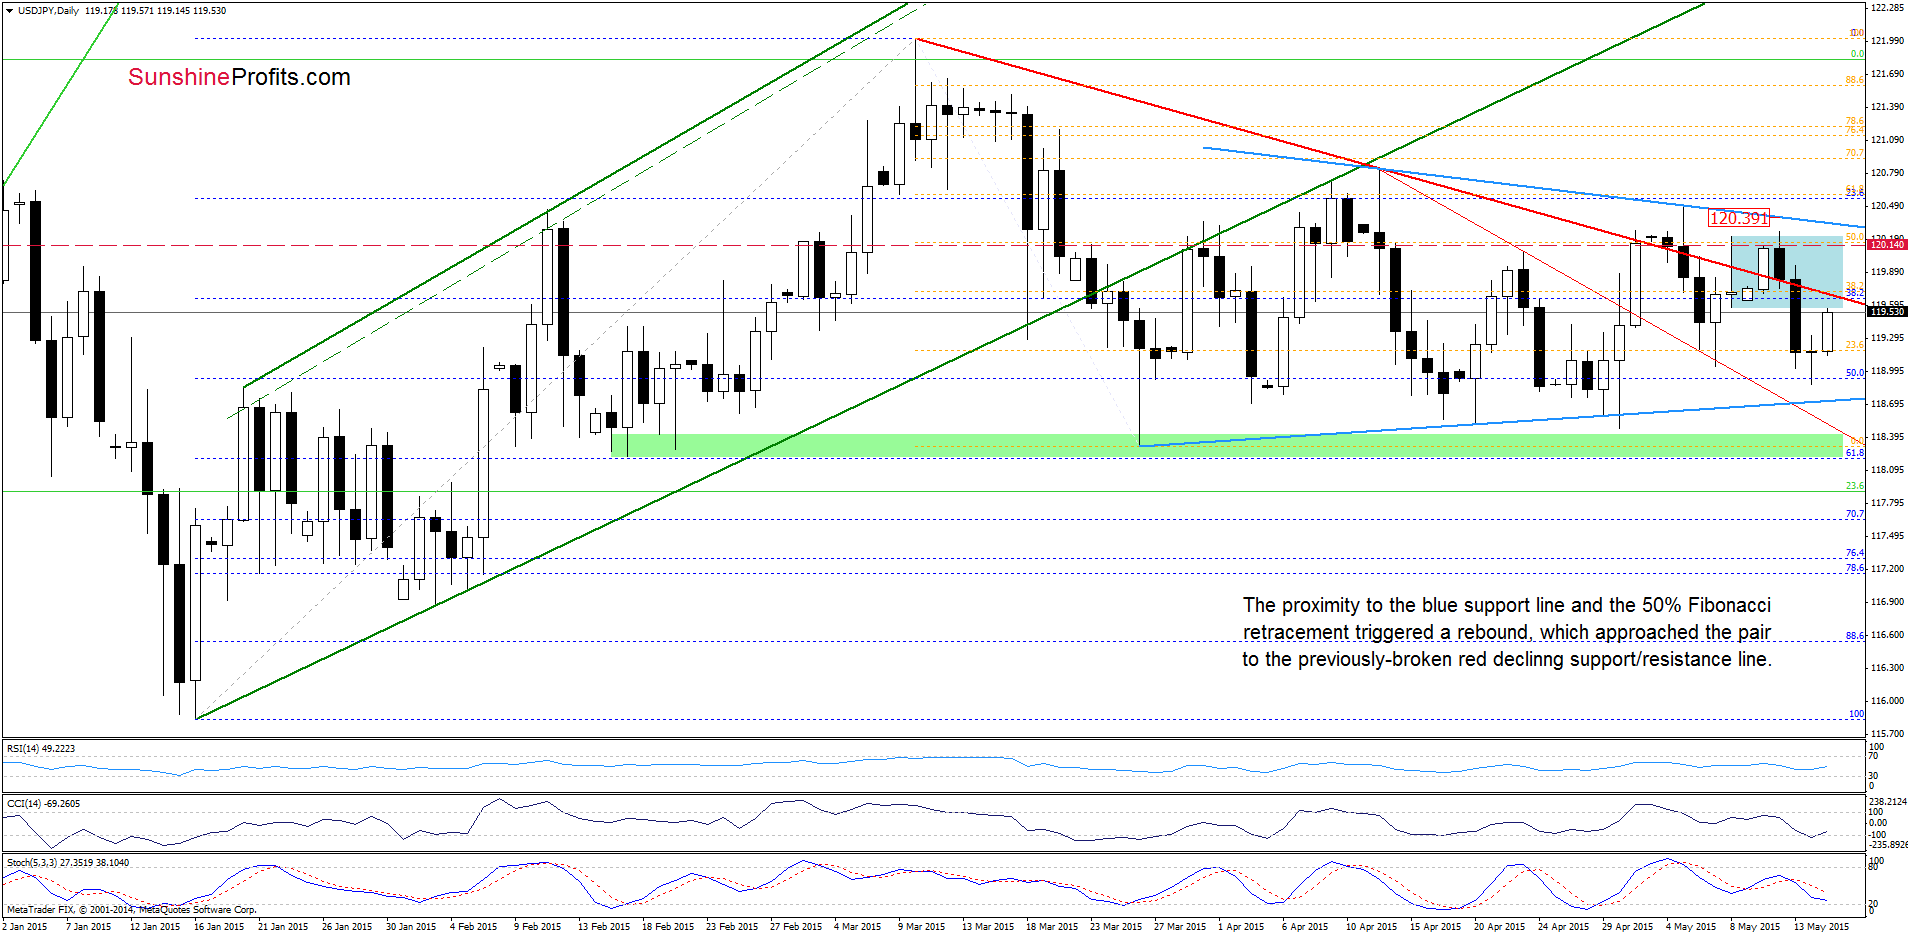
As you see on the daily chart, the proximity to the blue support line and the 50% Fibonacci retracement triggered a rebound, which approached the pair to the previously-broken red declining support/resistance line. Although this is a positive signal, we should keep in mind that signals generated by the indicators are mixed, which in combination with the recent moves above and below this line make the very short-term picture a bit unclear. In our opinion, a sizable upward move will be more likely (and reliable) if we see a breakout above the blue resistance line (currently around 120.33). Until this time, upswings and downswings in both directions should not surprise us.
Very short-term outlook: mixed
Short-term outlook: mixed
MT outlook: mixed
LT outlook: bullish
Trading position (short-term; our opinion): No positions are justified from the risk/reward perspective at the moment. We will keep you informed should anything change, or should we see a confirmation/invalidation of the above.
USD/CAD
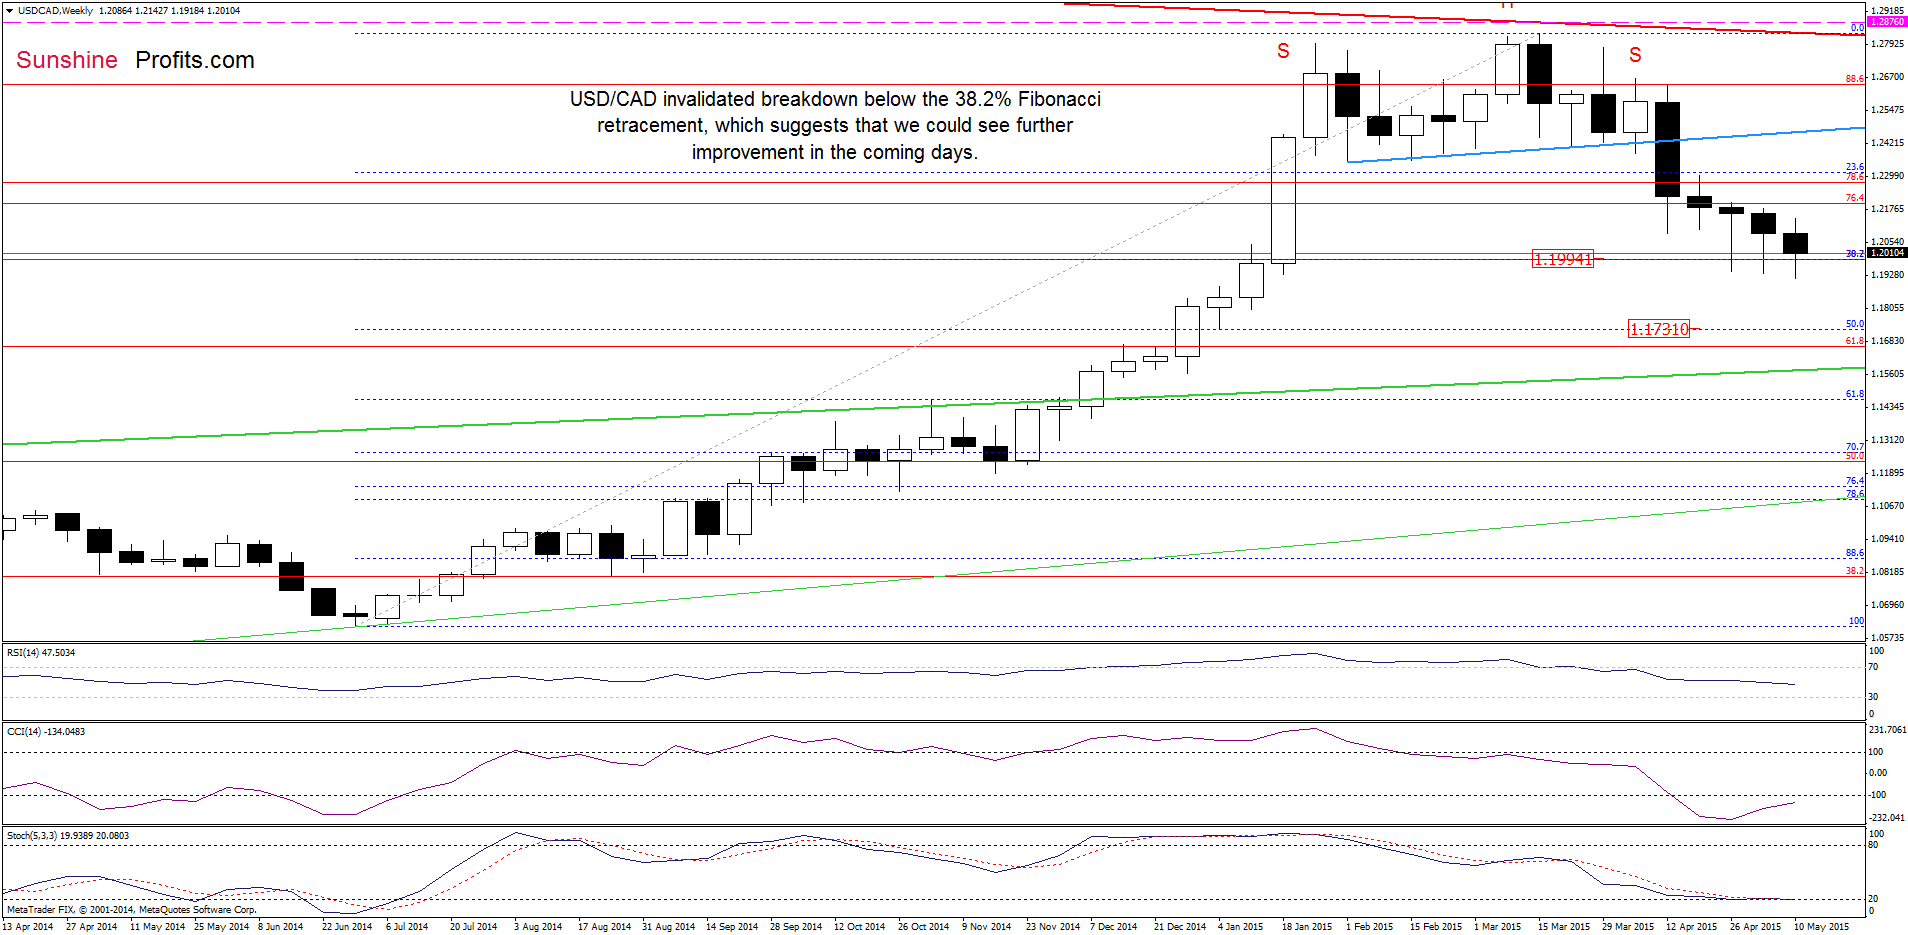
Looking at the above chart, we see that USD/CAD moved higher and invalidated (for the third time) the breakdown under the 38.2% Fibonacci retracement level, which suggests that currency bulls could push the exchange rate higher in the coming week.
Can we infer somenting more about future moves from the very short-term chart? Let’s examine the daily chart and find out.
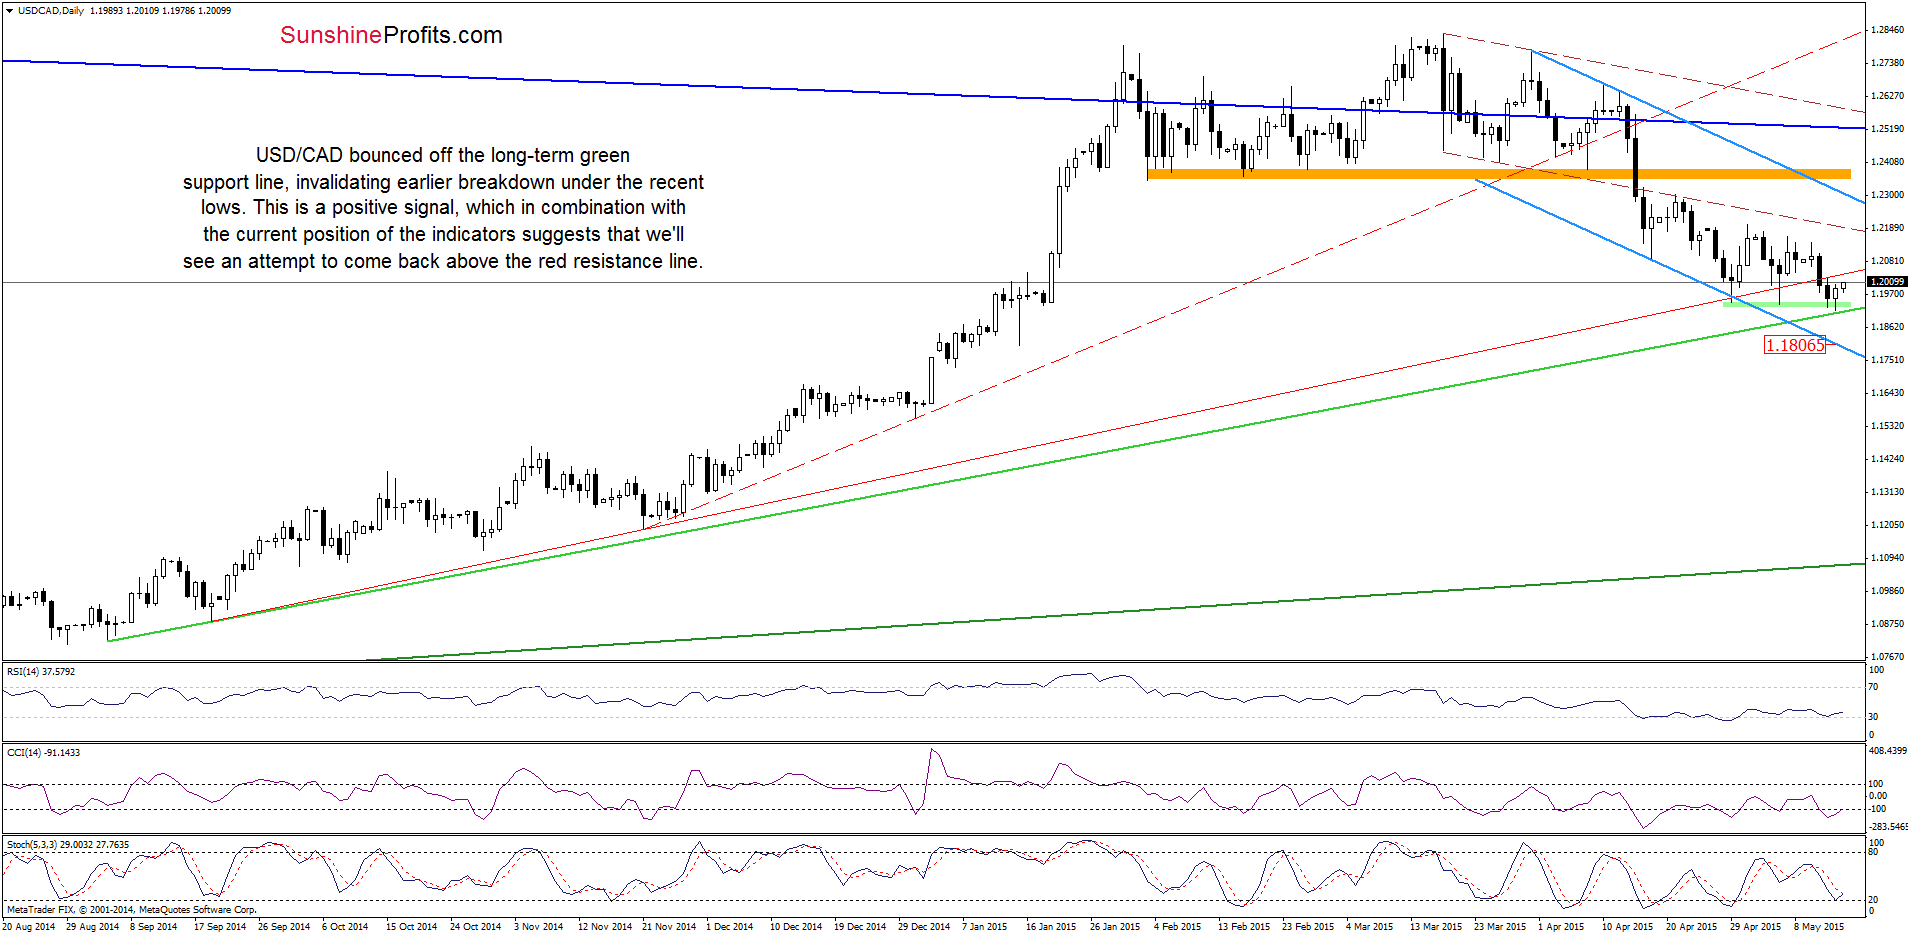
On the above chart, we see that USD/CAD bounced off the long-term green support line and invalidated earlier breakdown below the previous lows, which is a bullish sign. Additionally, the RSI and CCI generated buy signals, while the Stochastic Oscillator is very close to doing the same, which supports further improvement. If this is the case, and the pair moved higher from here, the initial upside target would be the red resistance line (currently around 1.2034). If it is broken, we might see an upward move even to 1.2189, where the lower border of the declining trend channel currently is.
Very short-term outlook: bullish
Short-term outlook: mixed with bullish bias
MT outlook: mixed
LT outlook: mixed
Trading position (short-term; our opinion): Long positions with a stop-loss order at 1.1706 are justified from the risk/reward perspective at the moment. We will keep you informed should anything change, or should we see a confirmation/invalidation of the above.
USD/CHF
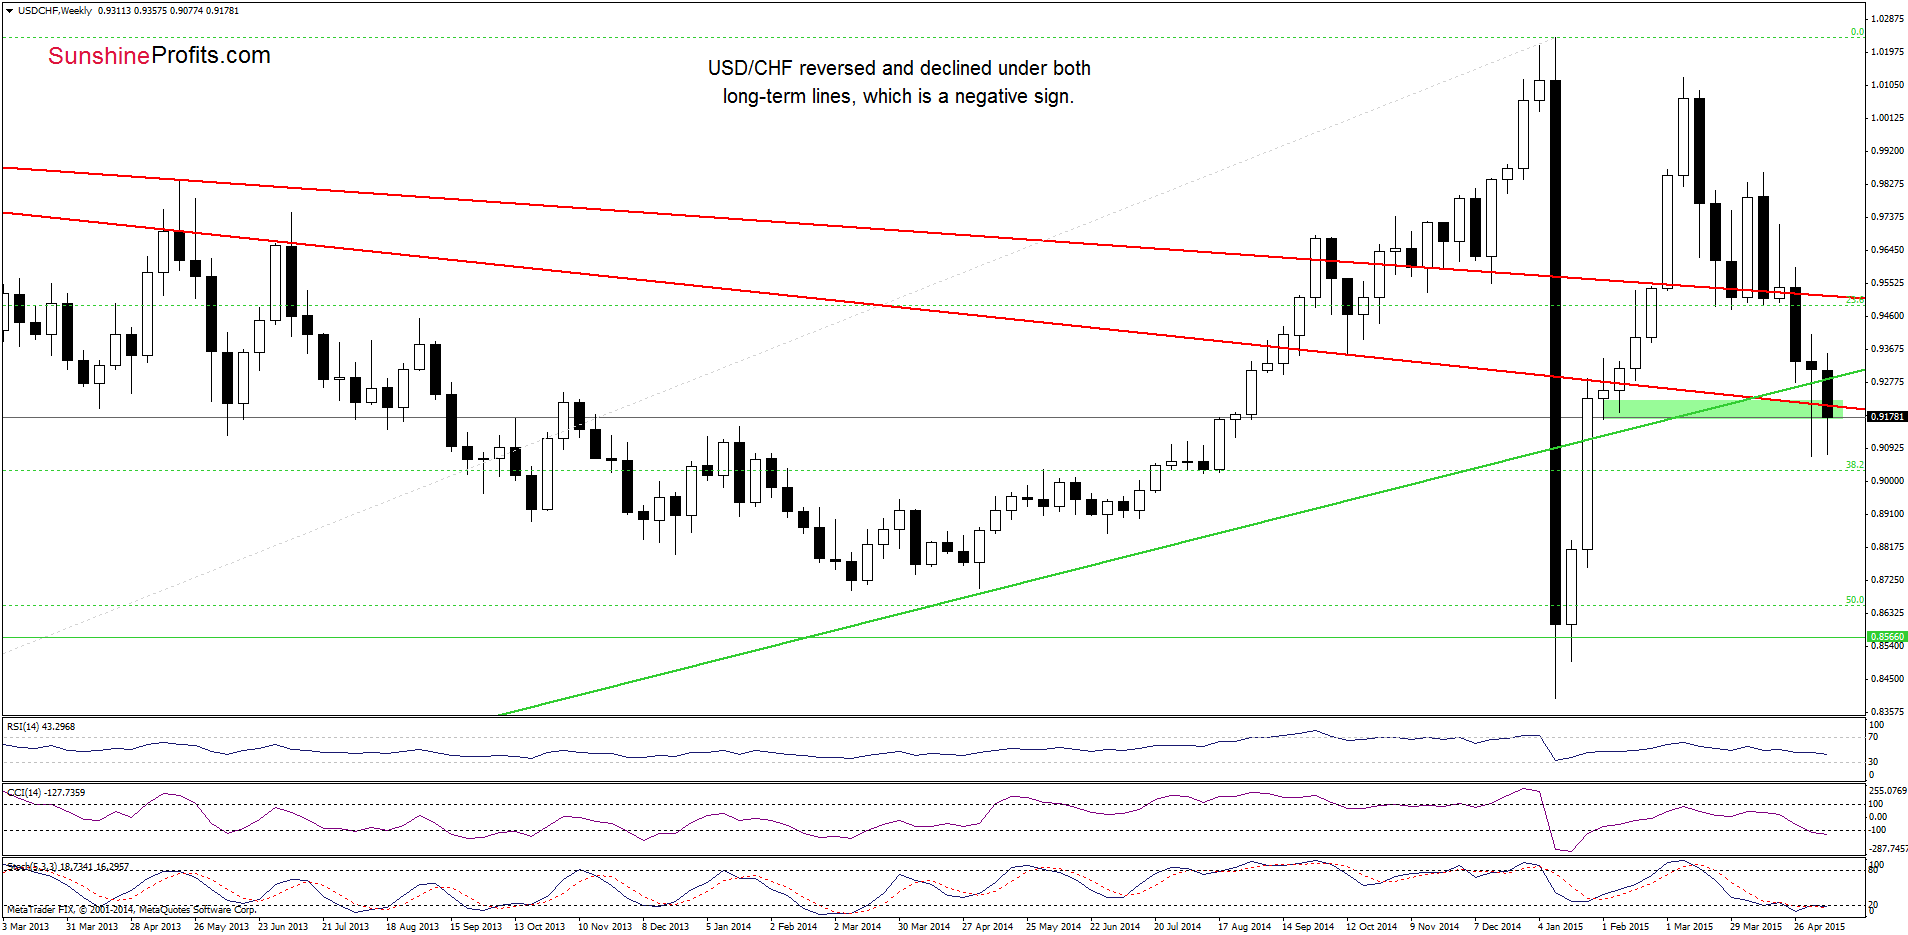
The first thing that catches the eye on the weekly chat is another breakdown below the green and the lower red declining line. This is a negative sign, which means that as long as currency bulls will not successfully come back above these levels further improvement is not likely to be seen. Nevertheless, the current position of the indicators (the CCI and Stochastic Oscillator are oversolid, while the latter is very close to generating a buy signal) suggests that another upswing is likely just around the corner.
Having said that, let’s take a closer look at the daily chart and find out what can we infer from it.
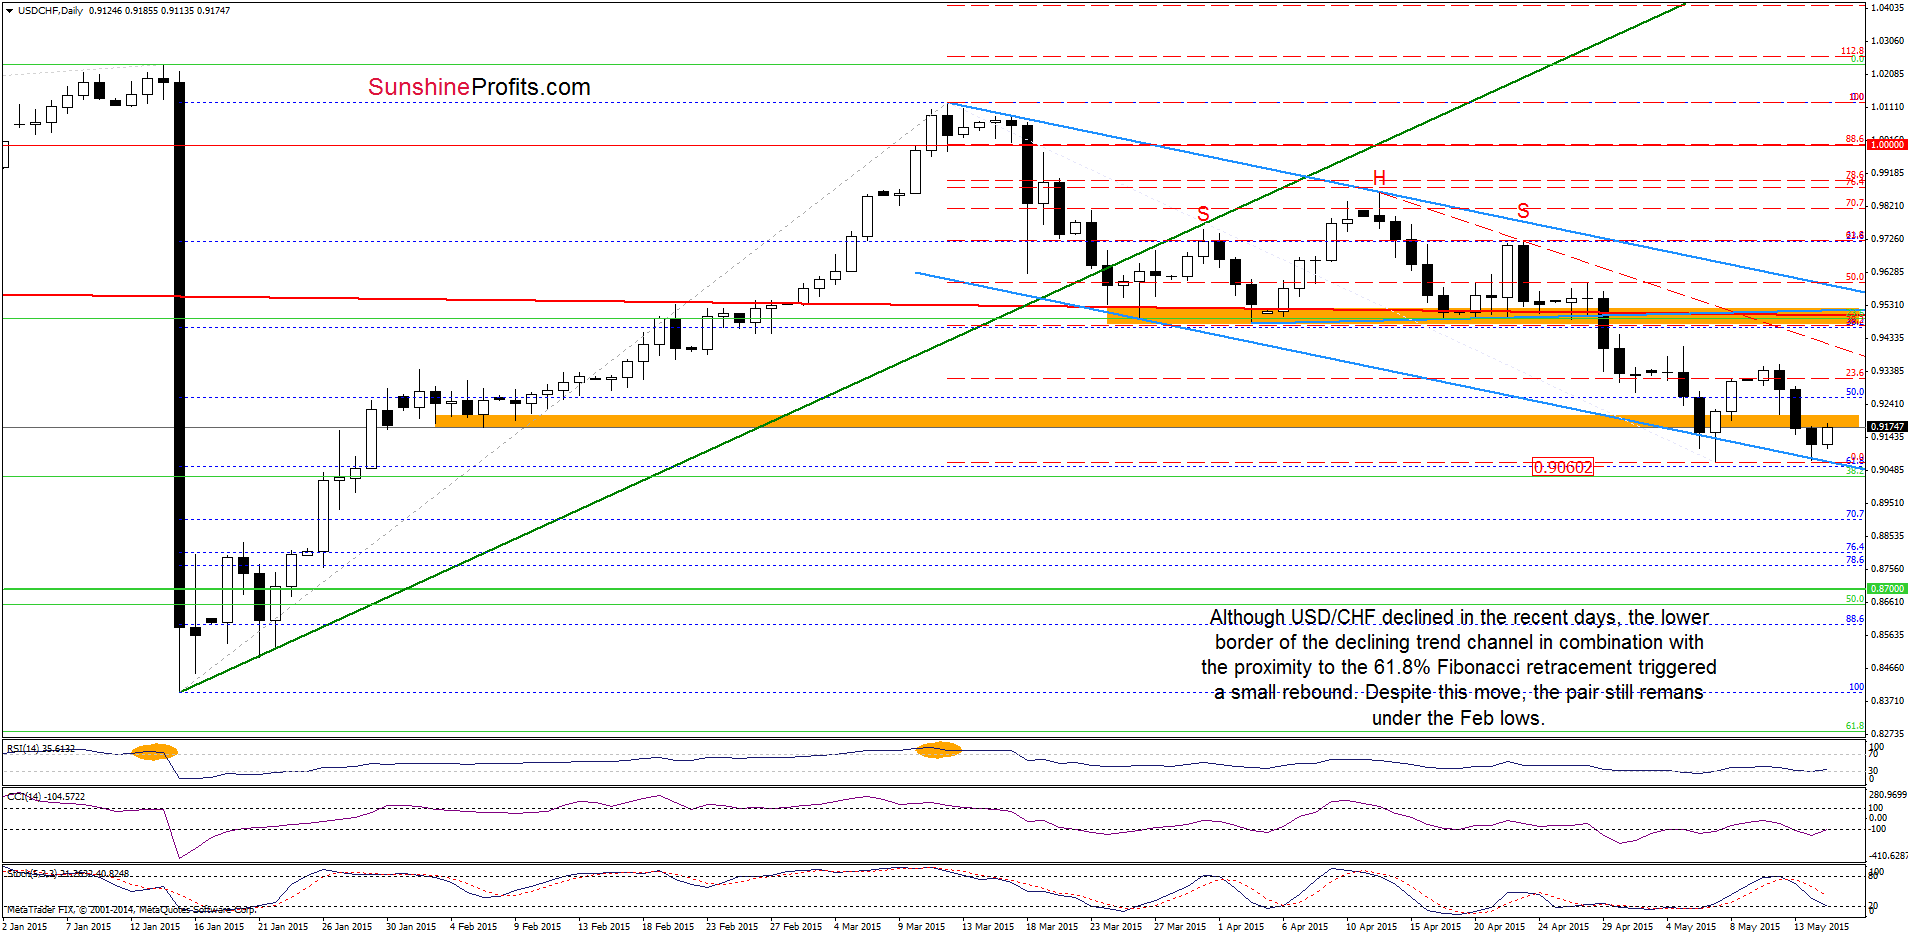
From this perspective, we see that although USD/CHF moved higher at the beginning of the week, the 23.6% Fibonacci retracement (based on the entire Mar-May declines) encouraged currency bears to act, which resulted in a sharp pullback and took the exchange rate below the Feb lows once again. With this downward move, USD/CHF dropped to the lower border of the declining trend channel (marked with blue), the previous low and the 61.8% Fibonacci retracement. This support area triggered a small rebound earlier today, but the very short-term picture hasn’t changed much as the pair is still trading under the orange resistance zone created by the Feb lows. In our opinion, as long as there is no invalidation of the breakdown below this area further improvement is not likely to be seen. Nevertheless, finishing today’s commentary on this currency pair, it is worth noting that the RSI generated a buy signal, while the CCI is very close to doing the same, which could translate to another upswing in the coming day(s). If this is the case and we see further improvement, the initial upside target would be around 0.9315, where the 23.6% Fibonacci retracement (based on the entire Mar-May declines) is.
Very short-term outlook: mixed
Short-term outlook: mixed
MT outlook: mixed
LT outlook: bearish
Trading position (short-term; our opinion): No positions are justified from the risk/reward perspective at the moment. We will keep you informed should anything change, or should we see a confirmation/invalidation of the above.
AUD/USD
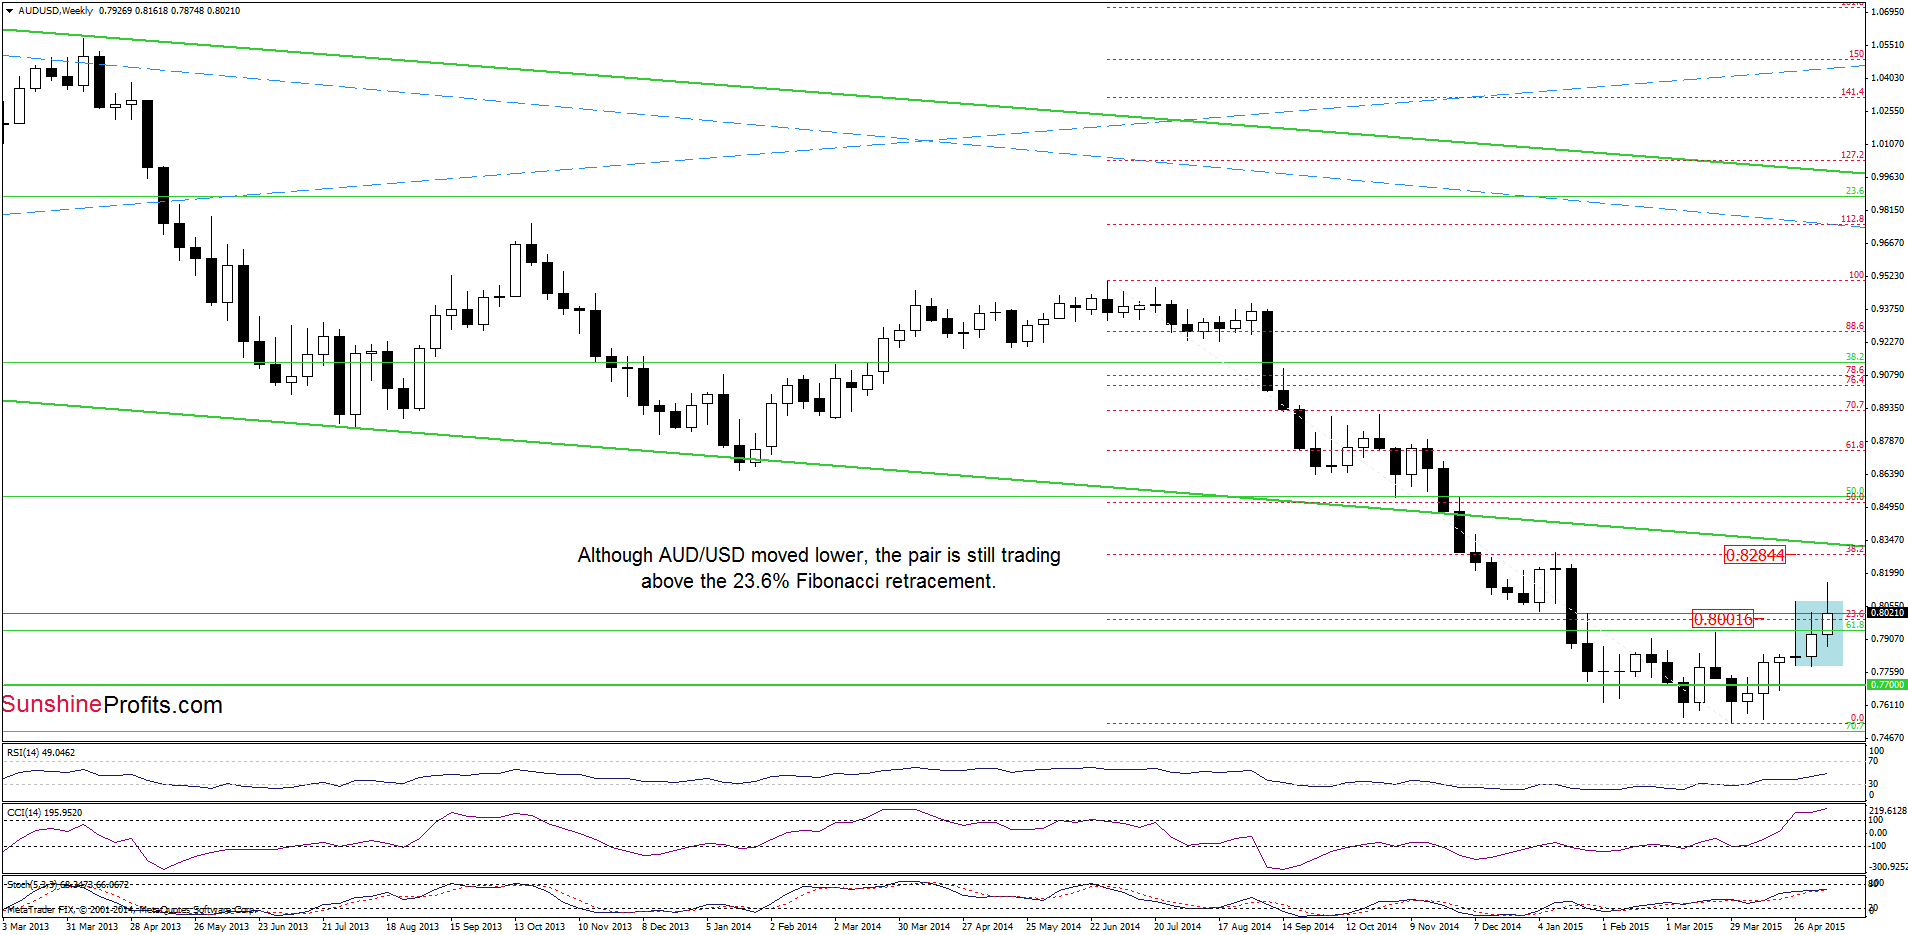
Although AUD/USD declined, the medium-term picture hasn’t changed much as the exchange rate is still trading above the 23.6% Fibonacci retracement. Nevertheless, the CCI is overbought, while the Stochastic Oscillator is very close to generating a sell signal, which together could bring further deterioration in the coming week.
Will we see such price action? Let’s examine the daily chart and look for more clues about future moves.
On Wednesday, we wrote:
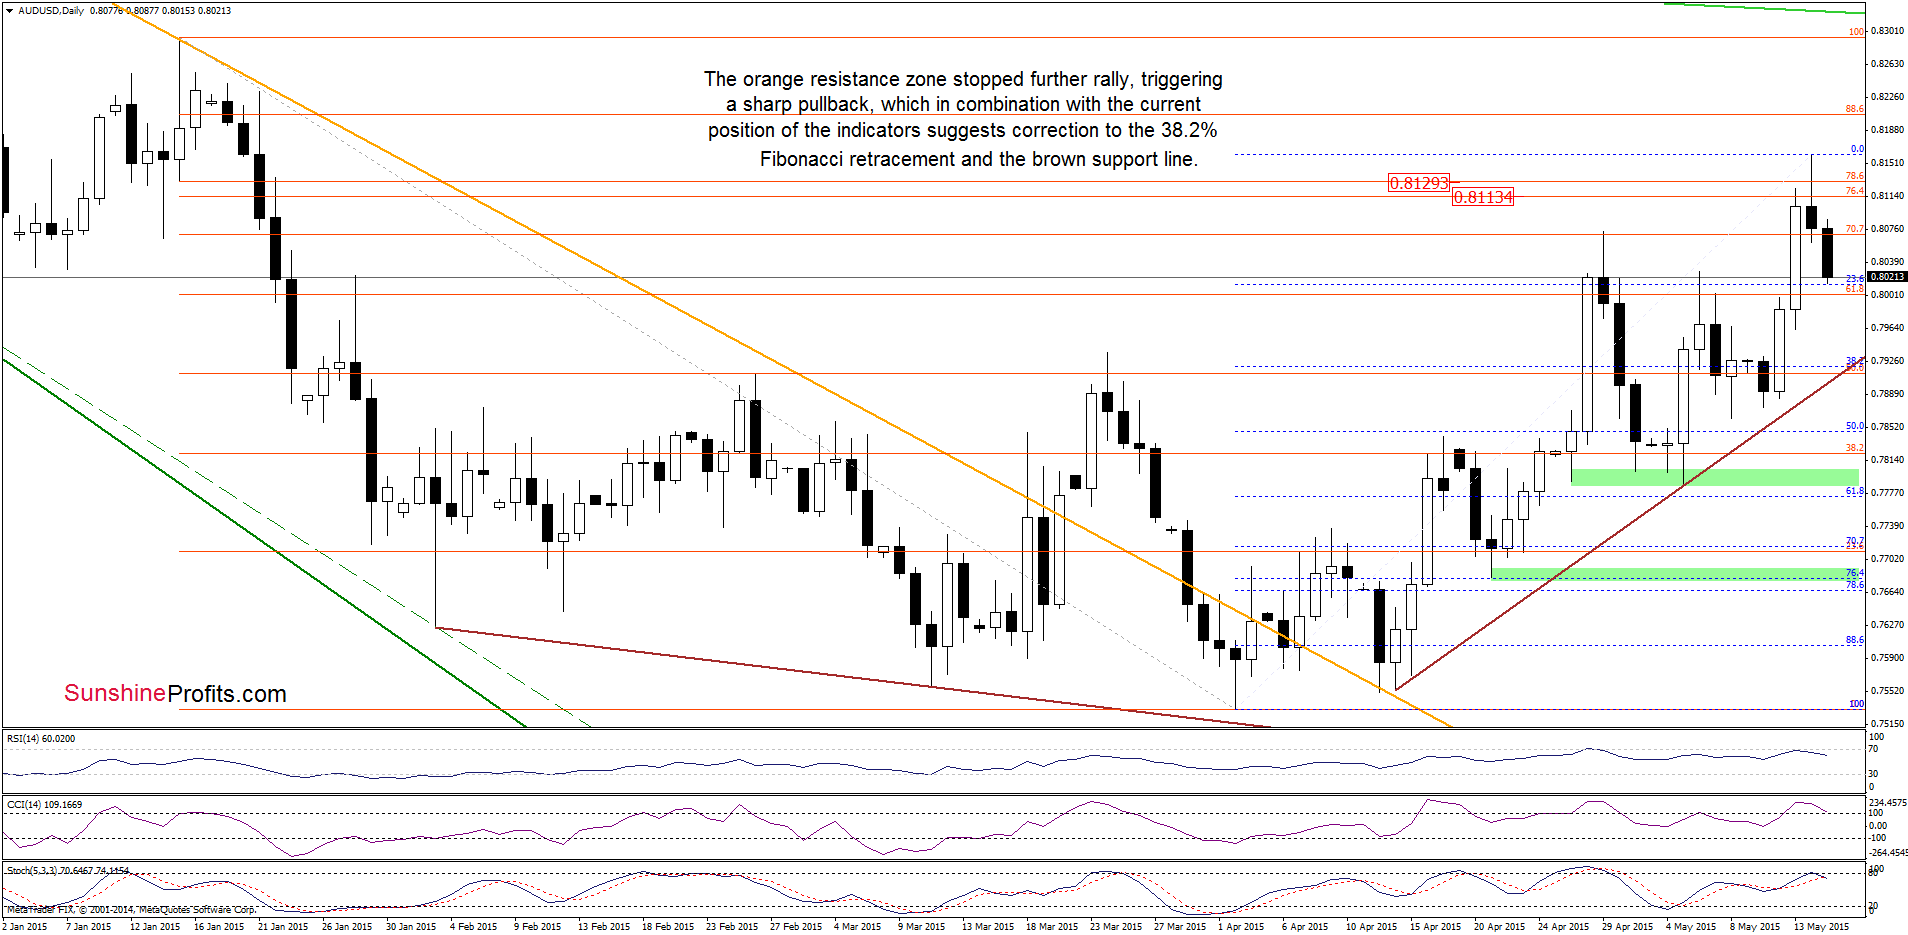
(…) taking into account the current position of the indicators and the medium-term picture, it seems that currency bulls will try to push the pair higher. If they succeed, and AUD/USD climbs above the brown line, it would be a positive sign, which will open the way to the Apr high and the next resistance zone around 0.8113-0.8129 (the 76.4% and 78.6% Fibonacci retracement levels based on the Jan-Apr declines).
As you see on the daily chart, the situation developed in line with the above scenario and AUD/USD reached our upside target yesterday. Despite this improvement, the resistance zone encouraged currency bears to act, which resulted in a sharp pullback earlier today. Taking this fact and the current position of the indicators into account, we think that further deterioration is just around the corner. If this is the case, and the pair moves lower from here, the initial downside target would be around 0.7920, where the 38.2% Fibonacci retracement levels (based on the entire Apr-May rally) and the brown rising support line are.
Very short-term outlook: bearish
Short-term outlook: mixed with bearish bias
MT outlook: mixed
LT outlook: mixed
Trading position (short-term; our opinion): Short positions with a stop-loss order at 0.8194 are justified from the risk/reward perspective at the moment. We will keep you informed should anything change, or should we see a confirmation/invalidation of the above.
Thank you.
Nadia Simmons
Forex & Oil Trading Strategist
Przemyslaw Radomski, CFA
Founder, Editor-in-chief
Gold & Silver Trading Alerts
Forex Trading Alerts
Oil Investment Updates
Oil Trading Alerts

