

Earlier today, the U.S. Department of Labor reported that the number of initial jobless claims in the week ending April 25 dropped by 34,000 to 262,000, beating analysts’ expectations for a 6,000 decline. Thanks to these bullish numbers, the USD Index bounced off session’s lows and came back above 95. In response to this increase, USD/JPY reversed and rebounded sharply, reaching the resistance line. Will we see another increase to 120 in the coming days?
In our opinion the following forex trading positions are justified - summary:
EUR/USD
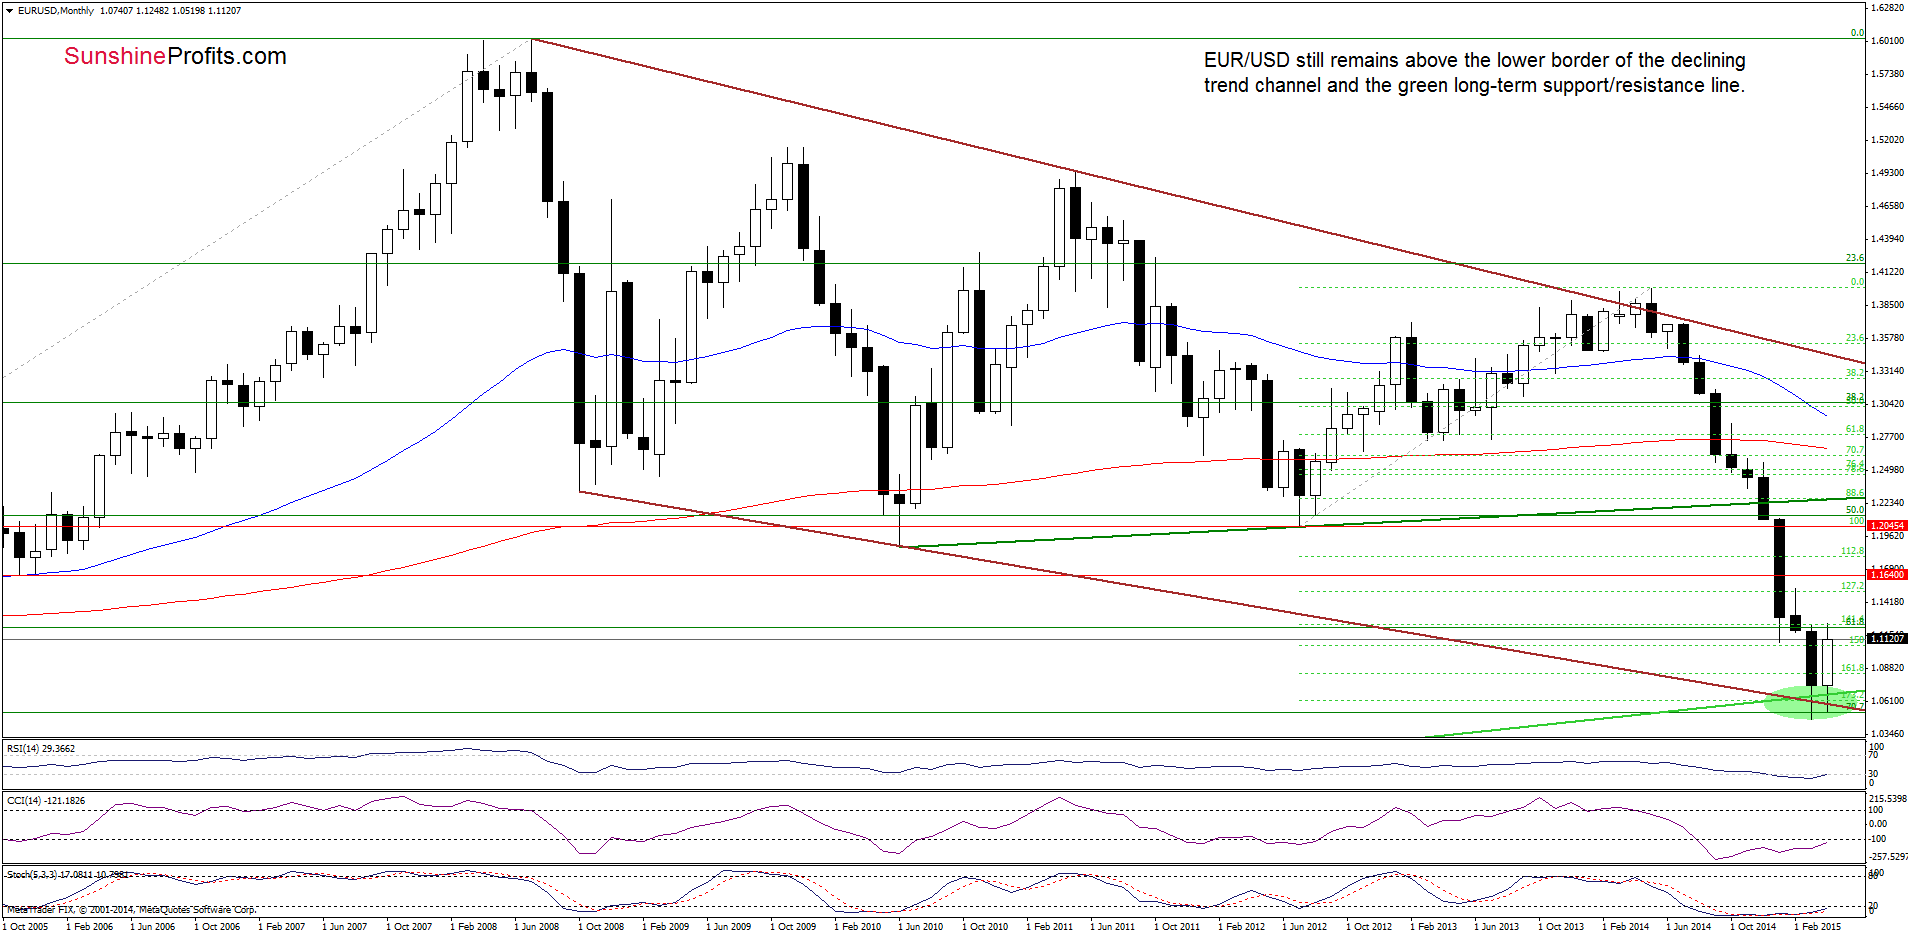
The situation in the medium term has improved as EUR/USD extended gains and climbed to the last month’s high. At this point, it is worth noting that in this area is also the previously-broken 61.8% Fibonacci retracement, which together could pause further rally.
Having said that, let’s take a closer look at the very short-term picture.
In our previous Forex Trading Alert, we wrote the following:
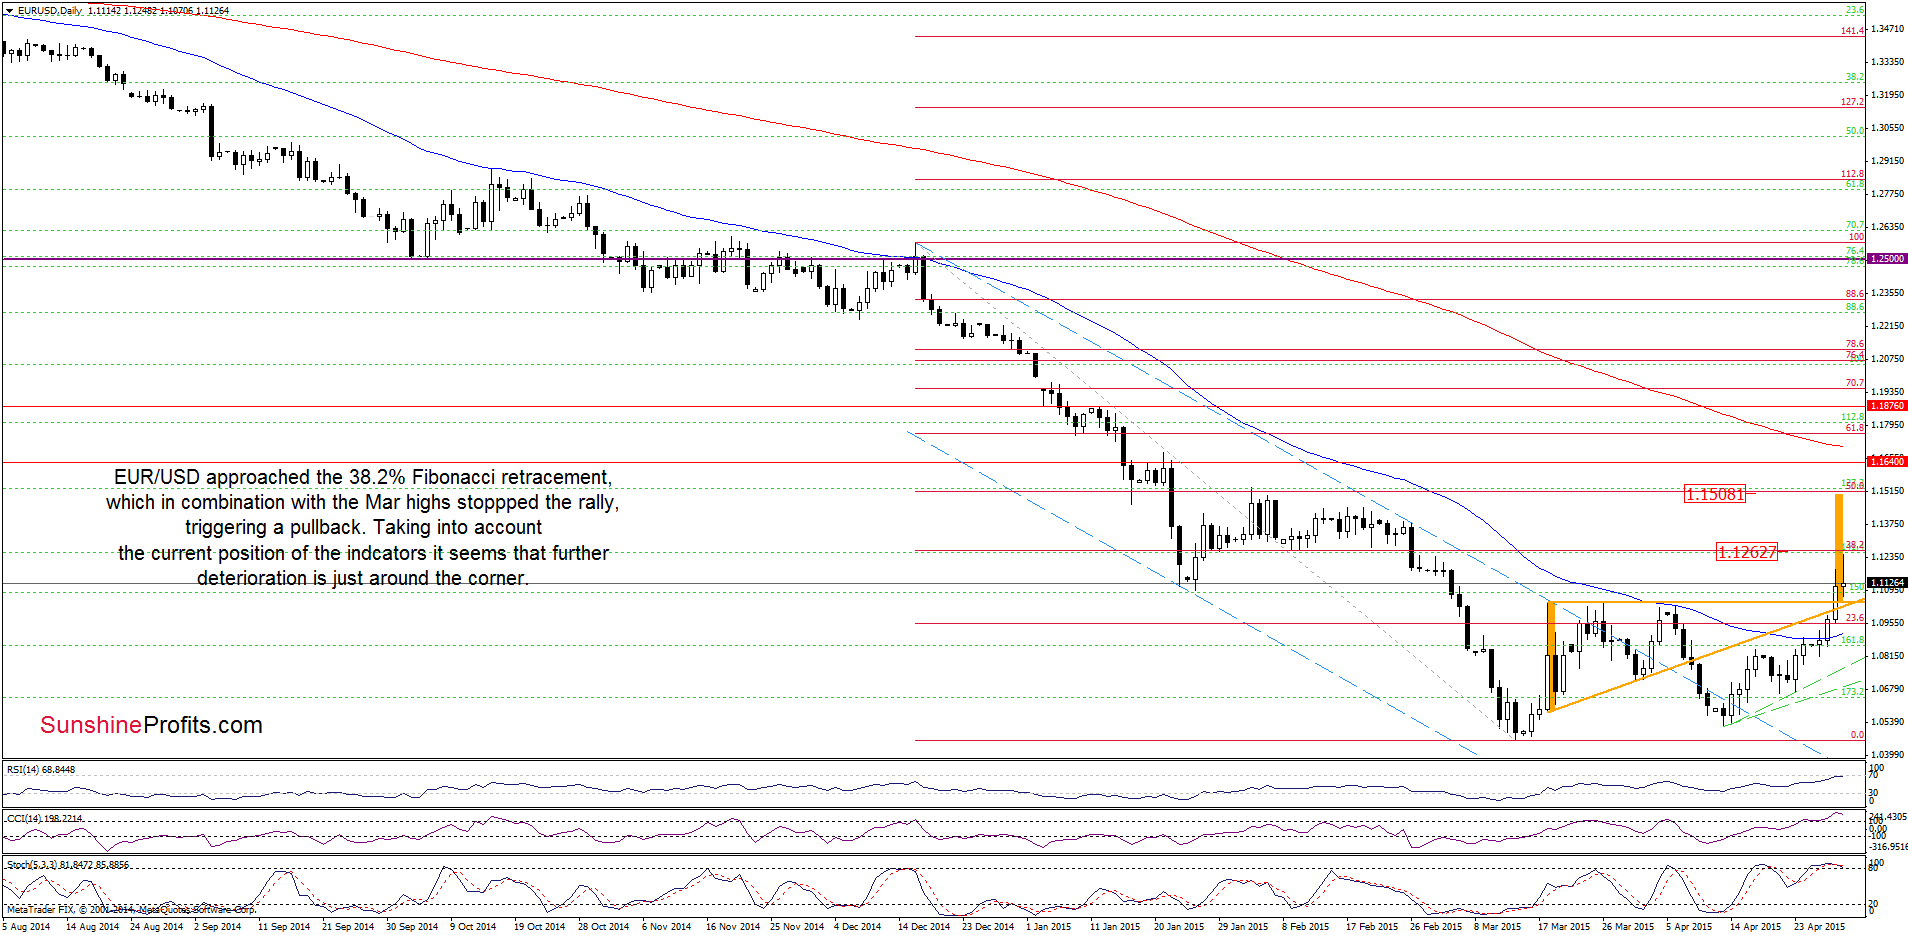
(…) a breakout above the resistance zone created by the Mar and Apr highs (…) suggests further improvement and an increase to around 1.1263, where the 38.2% Fibonacci retracement (based on the mid-Dec-mid-Mar declines) is. (…) Nevertheless, (…) we should keep in mind that the current position of the indicators (the RSI almost climbed to the level of 70, while the CCI and Stochastic Oscillator are overbought) suggests that a reversal is just around the corner.
Looking at the daily chart, we see that currency bulls pushed EUR/USD higher as we expected. As a result, the exchange rate approached our upside target, but the 38.2% Fibonacci retracement in combination with the March high stopped further rally, triggering a pullback. Taking this fact into account, and combining it with the current position of the indicators, it seems that further deterioration is just around the corner. If this is the case, the initial downside target would be around 1.1050, where the previously-broken orange support/resistance line is.
Very short-term outlook: mixed with bearish bias
Short-term outlook: mixed
MT outlook: mixed
LT outlook: mixed
Trading position (short-term; our opinion): No positions are justified from the risk/reward perspective at the moment. We will keep you informed should anything change, or should we see a confirmation/invalidation of the above.
USD/JPY
On Tuesday, we wrote the following:
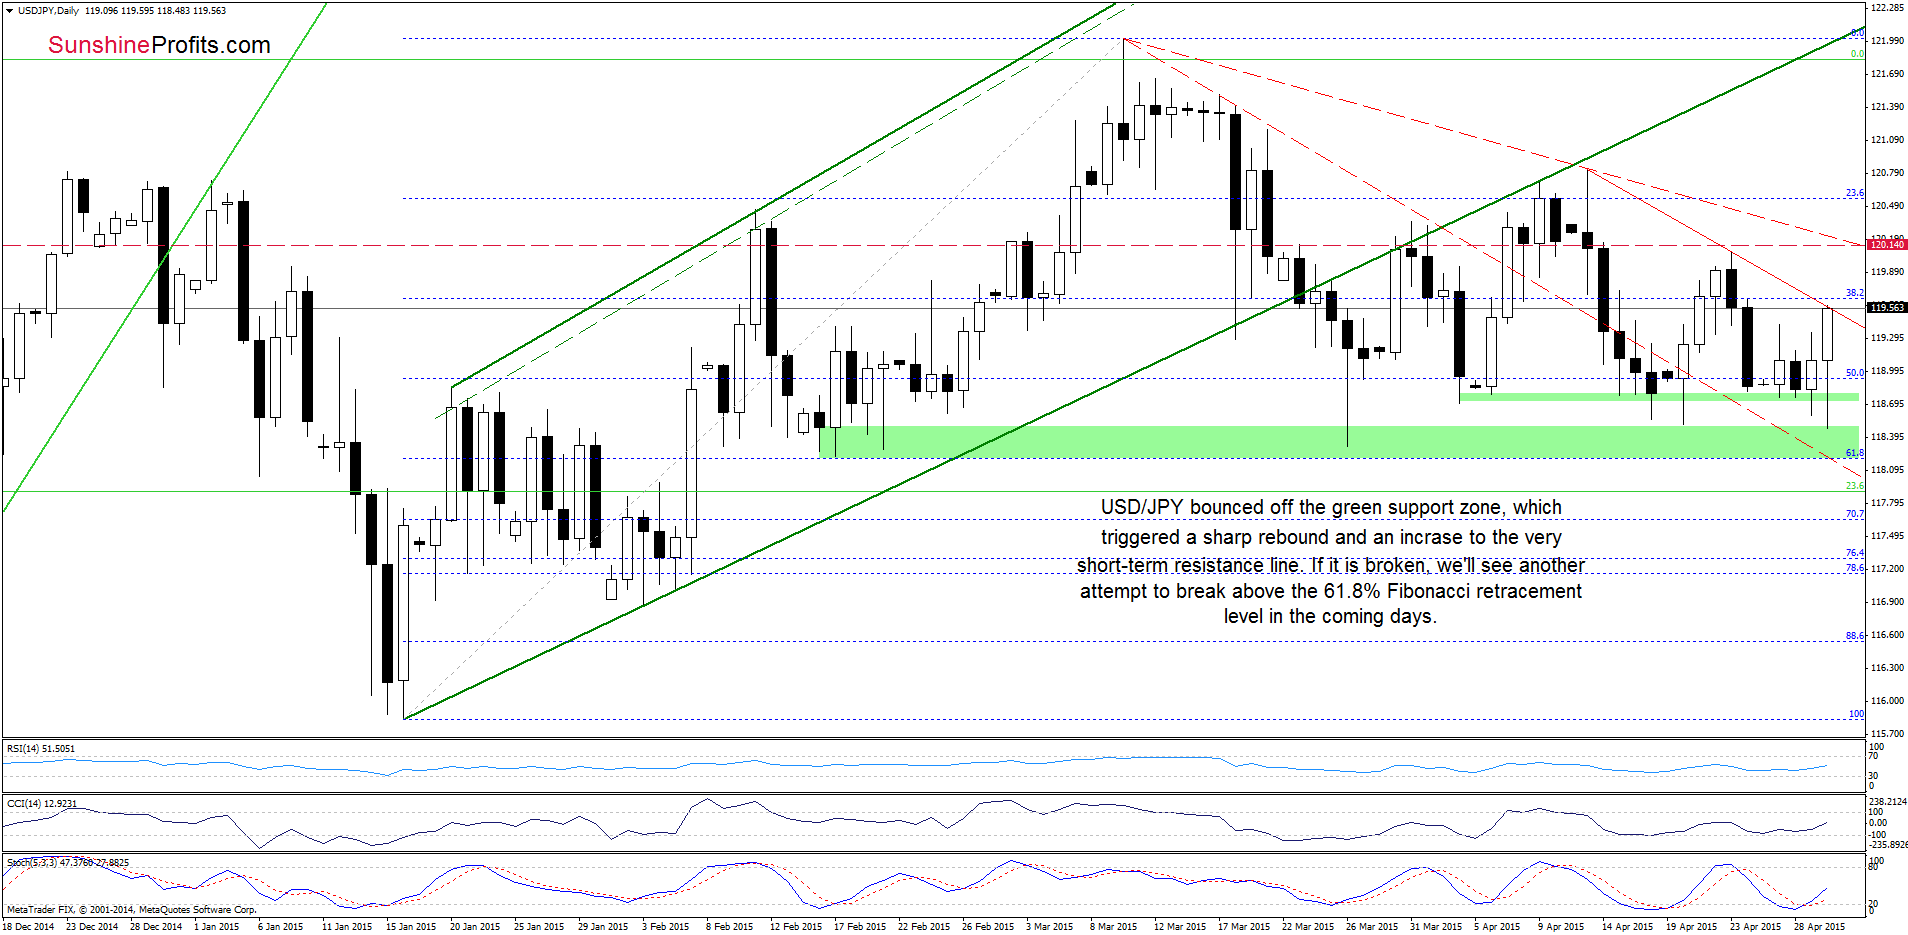
(…) the pair reversed earlier today, which suggests another test of the green zone. At this point, it is worth noting that sell signal generated by the Stochastic Oscillator remains in place, supporting the bearish case. Therefore, it seems that we could see a drop even to the red support line (which currently intersects the lower green support zone created by the mid-Feb and March lows) in the coming week.
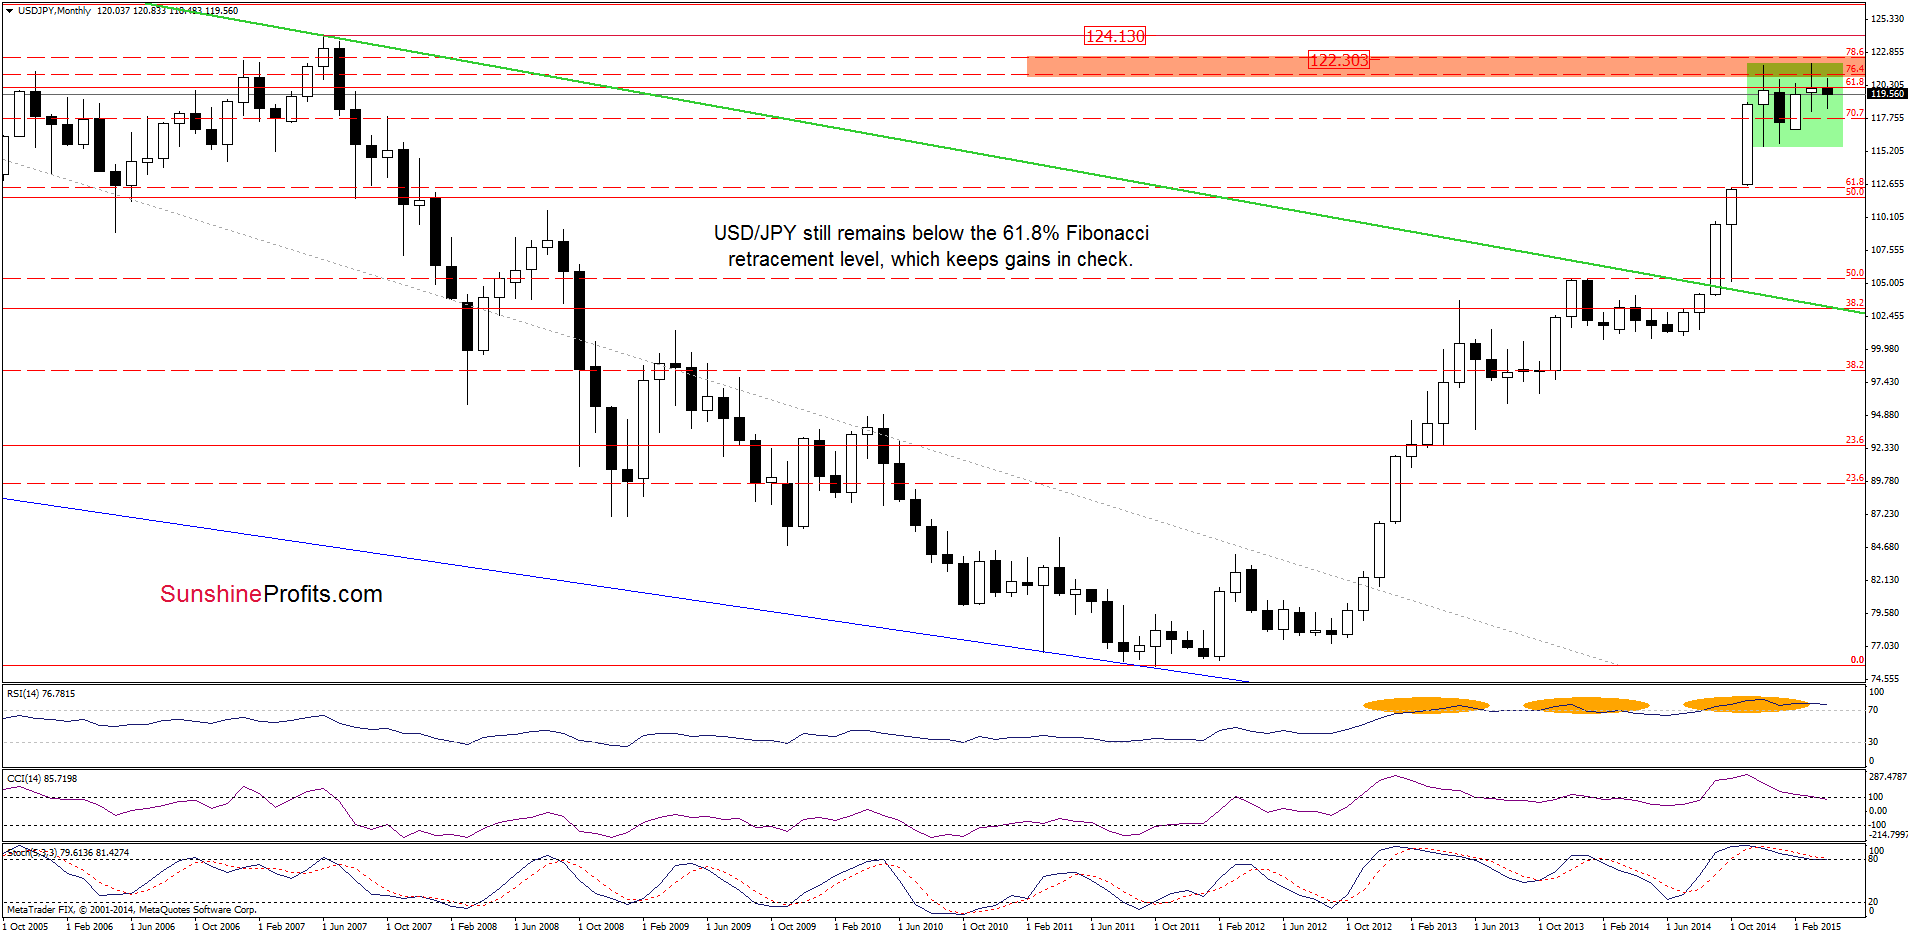
As you see on the charts, USD/JPY bounced off the green support zone, which triggered a sharp rebound and an increase to the very short-term resistance line (based on the recent highs), which could pause further improvement. However, when we take a look at the position of the indicators, we see that they all generated buy signals, supporting the bullish case. Therefore, we think that currency bulls will try to push the exchange rate higher in the coming day(s). If this is the case, the initial upside target would be around 120.14, where the 61.8% Fibonacci retracement (marked on the monthly chart) is (in this area is also the red declining resistance line based on the March and Apr highs, which serves as an additional resistance).
Very short-term outlook: mixed with bullish bias
Short-term outlook: mixed
MT outlook: mixed
LT outlook: bullish
Trading position (short-term; our opinion): No positions are justified from the risk/reward perspective at the moment. We will keep you informed should anything change, or should we see a confirmation/invalidation of the above.
AUD/USD
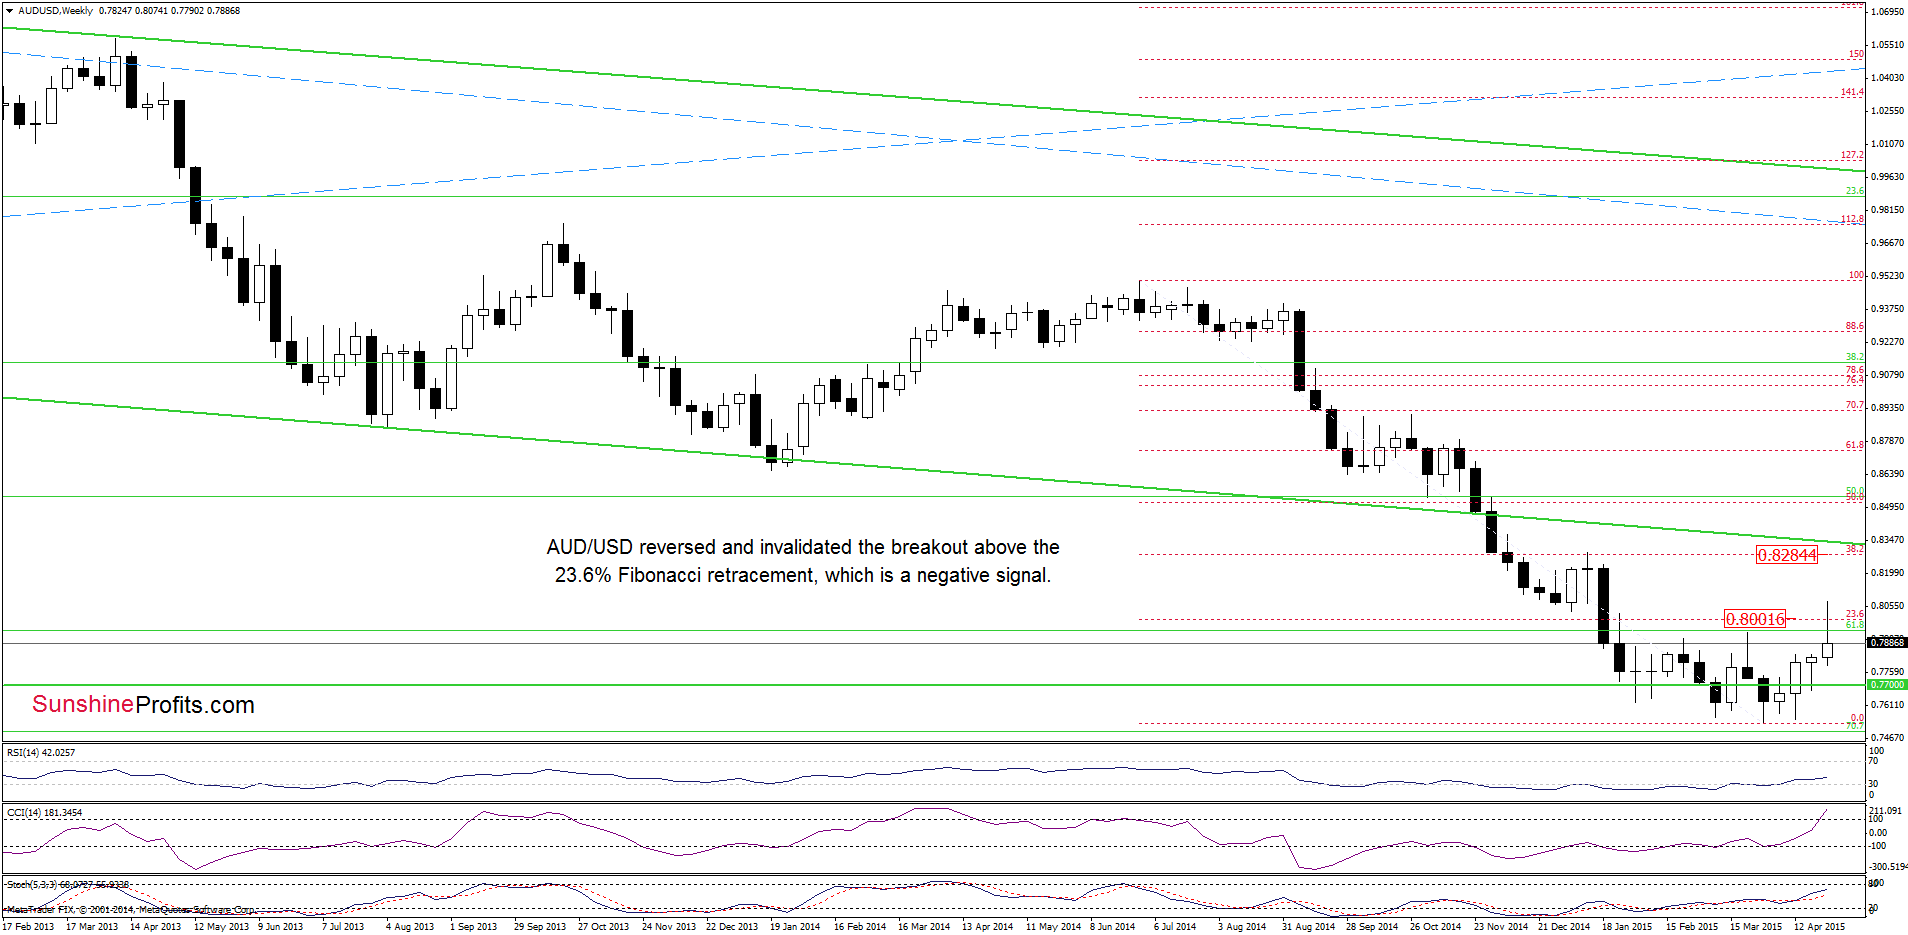
The first thing that catches the eye on the above chart is an invalidation of the breakout above the 23.6% Fibonacci retracement (based on the entire June-March declines), which is a negative signal that suggests further deterioration.
How did this drop affect the very short-term chart? Let’s take a look.
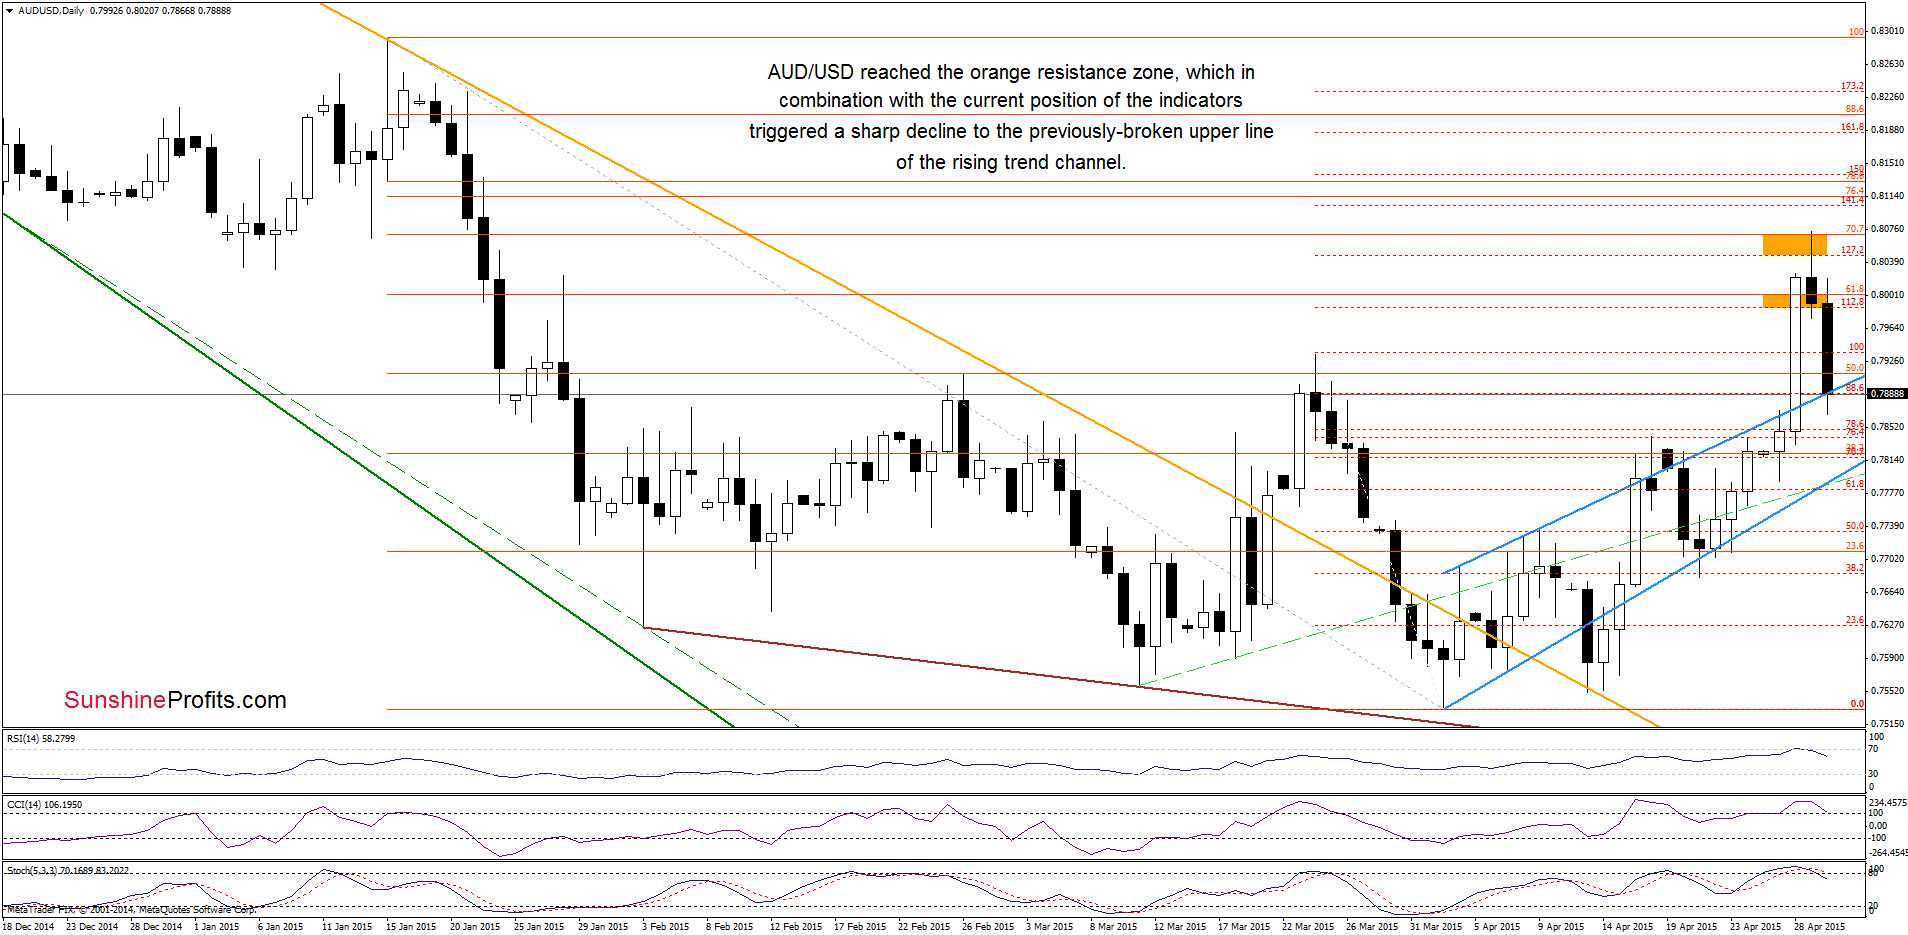
Quoting our last commentary on this currency pair:
(…) AUD/USD broke above the upper line of the rising trend channel, which triggered a sharp rally and a comeback above the March high. This is a bullish signal, which suggests further improvement. If this is the case, and the pair moves higher from here, the initial upside target would be around 0.7990-0.8000, where the first orange resistance zone (created by the 61.8% Fibonacci retracement and the 112.8% Fibonacci extension) is.
Looking at the daily chart, we see that AUD/USD not only reached our initial upside target, but also climbed to the next orange resistance zone. As you see on the above chart, this area in combination with the current position of the indicators encouraged currency bears to act, which resulted in a sharp decline that took the exchange rate to the previously-broken upper line of the rising trend channel. Although the pair could rebound from here, it seems to us that an invalidation of the breakout (seen on the weekly chart) and sell signals generated by all indicators, will trigger further deterioration in the coming day(s). If this is the case, and AUD/USD closes the day below this blue line, the initial downside target would be the lower line of the formation (currently around 0.7787).
Very short-term outlook: mixed with bearish bias
Short-term outlook: mixed
MT outlook: mixed
LT outlook: mixed
Trading position (short-term; our opinion): No positions are justified from the risk/reward perspective at the moment. We will keep you informed should anything change, or should we see a confirmation/invalidation of the above.
Thank you.
Nadia Simmons
Forex & Oil Trading Strategist
Przemyslaw Radomski, CFA
Founder, Editor-in-chief
Gold & Silver Trading Alerts
Forex Trading Alerts
Oil Investment Updates
Oil Trading Alerts

