

Earlier today, the Commerce Department showed that U.S. gross domestic product increased only by 0.2% in the first quarter, slowing from 2.2% in the fourth quarter of 2014. This slowest rate of growth in a year pushed the USD Index well below 96, which translated to higher values of EUR/USD and GBP/USD. How high could these currency pairs go in the coming day(s)?
In our opinion the following forex trading positions are justified - summary:
EUR/USD
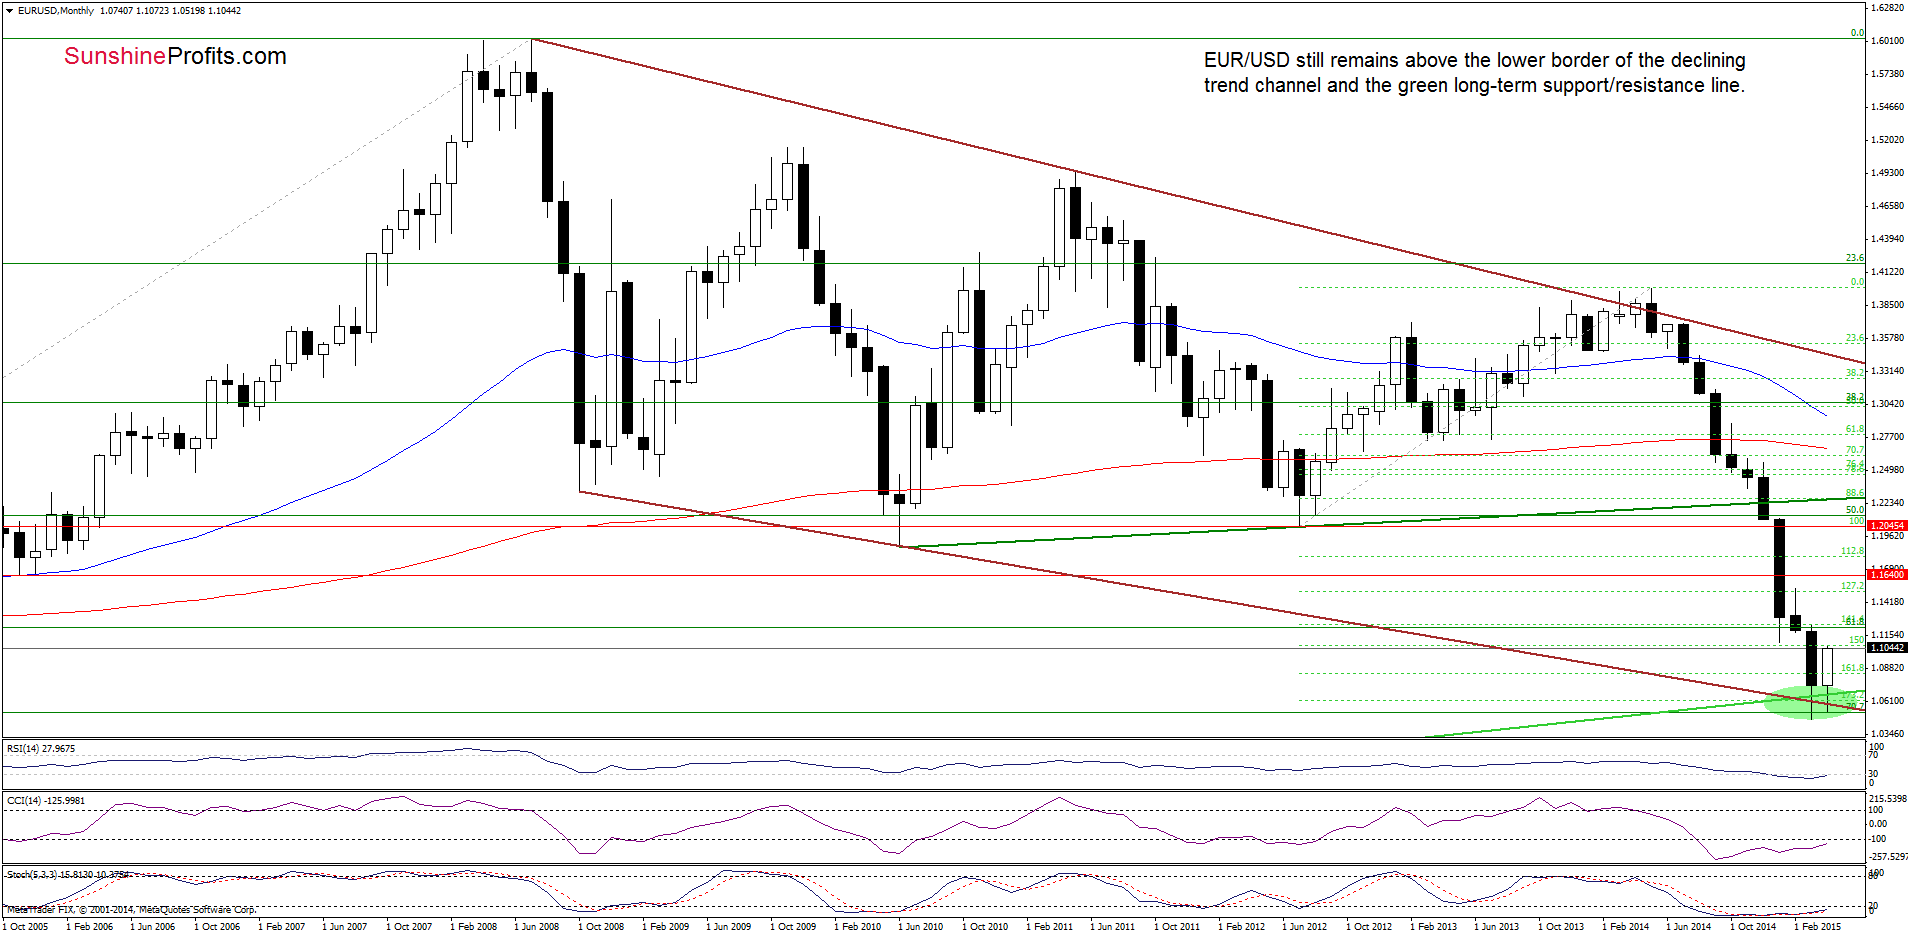
The situation in the medium term has improved as EUR/USD extended gains and moved away from the long-term green support line and the lower border of the long-term declining trend channel.
Having said that, let’s take a closer look at the very short-term picture.
In our previous Forex Trading Alert, we wrote the following:
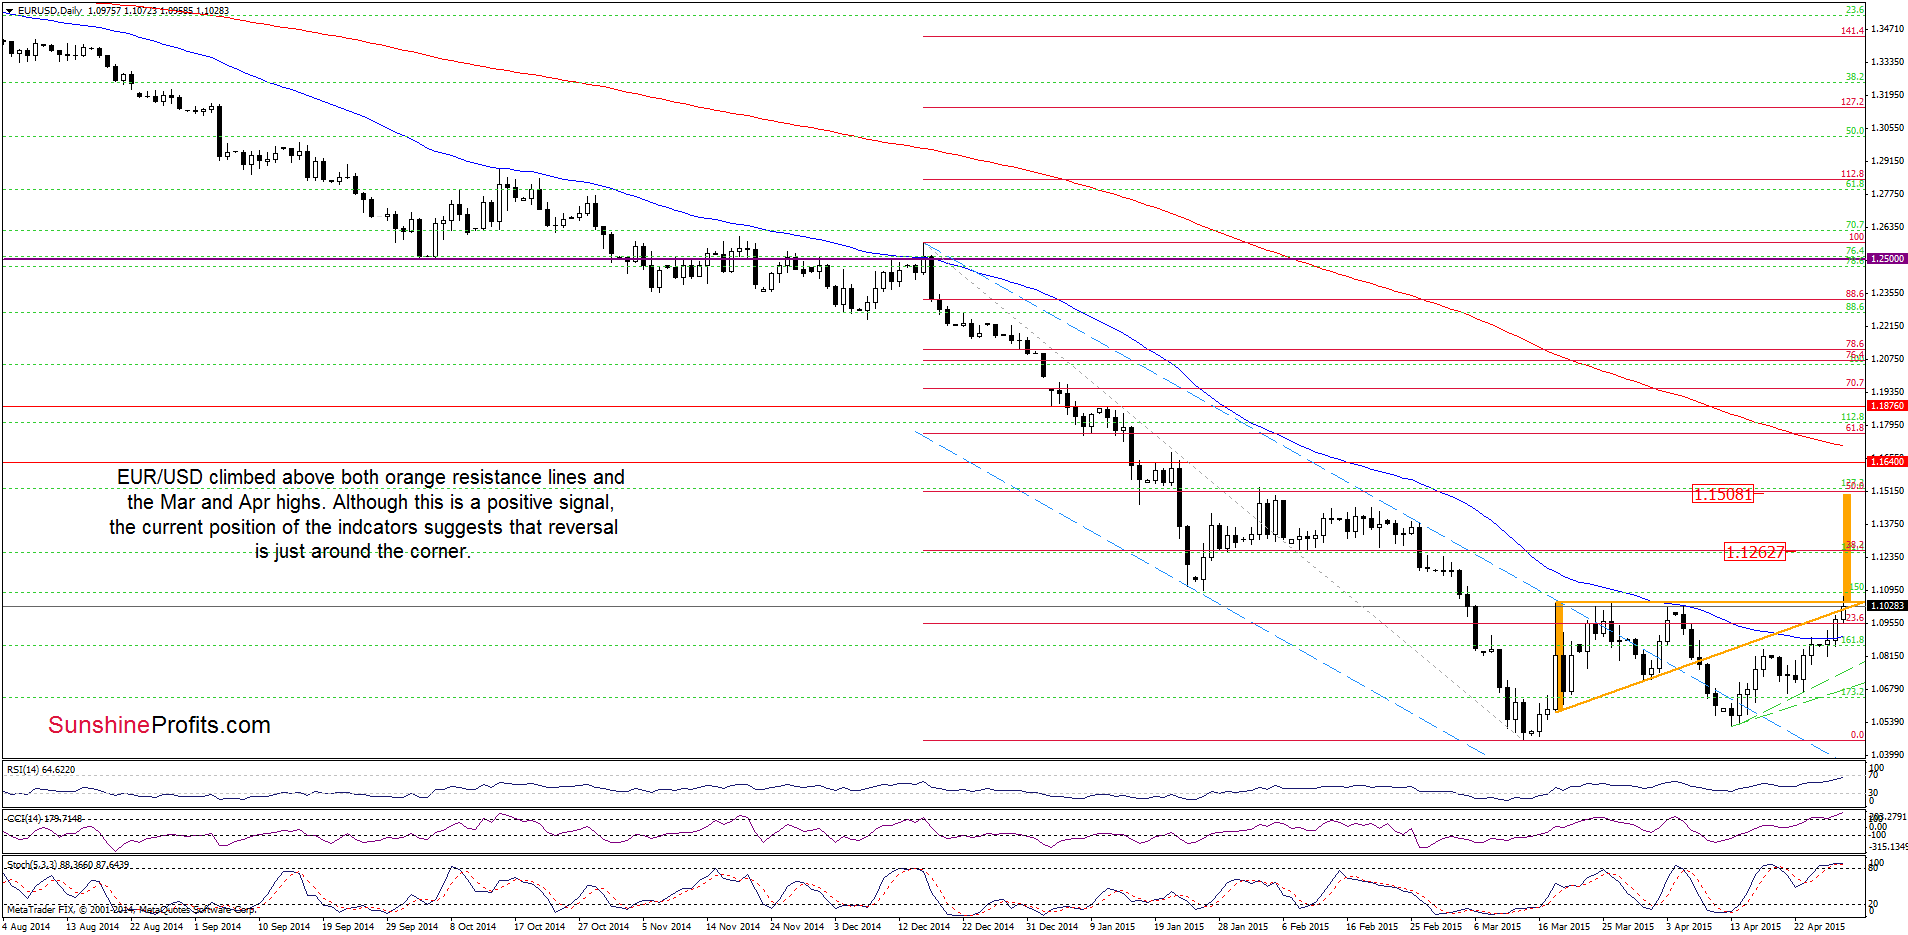
(…) EUR/USD climbed above the 50-day moving average. Although this is a positive signal, we think it would be more reliable if the pair closes the day above this resistance. If we see such price action, the initial upside target for currency bulls would be around 1.1000, where the orange resistance line is.
Looking at the daily chart, we see that the situation developed in line with the above scenario and EUR/USD closed yesterday’s session slightly below the orange resistance line. Earlier today, this positive signal encouraged currency bulls to act, which translated to a breakout above the resistance zone created by the Mar and Apr highs. This suggests further improvement and an increase to around 1.1263, where the 38.2% Fibonacci retracement (based on the mid-Dec-mid-Mar declines) is. At this point, it is worth noting that today’s upswing resulted also in a breakout above the upper line of the triangle, which suggests a rally to around 1.1500, where the size of an upward move will correspond to the height of the formation.
Nevertheless, although these are bullish signals, we should keep in mind that the current position of the indicators (the RSI almost climbed to the level of 70, while the CCI and Stochastic Oscillator are overbought) suggests that a reversal is just around the corner.
Very short-term outlook: mixed
Short-term outlook: mixed
MT outlook: mixed
LT outlook: mixed
Trading position (short-term; our opinion): No positions are justified from the risk/reward perspective at the moment. We will keep you informed should anything change, or should we see a confirmation/invalidation of the above.
GBP/USD
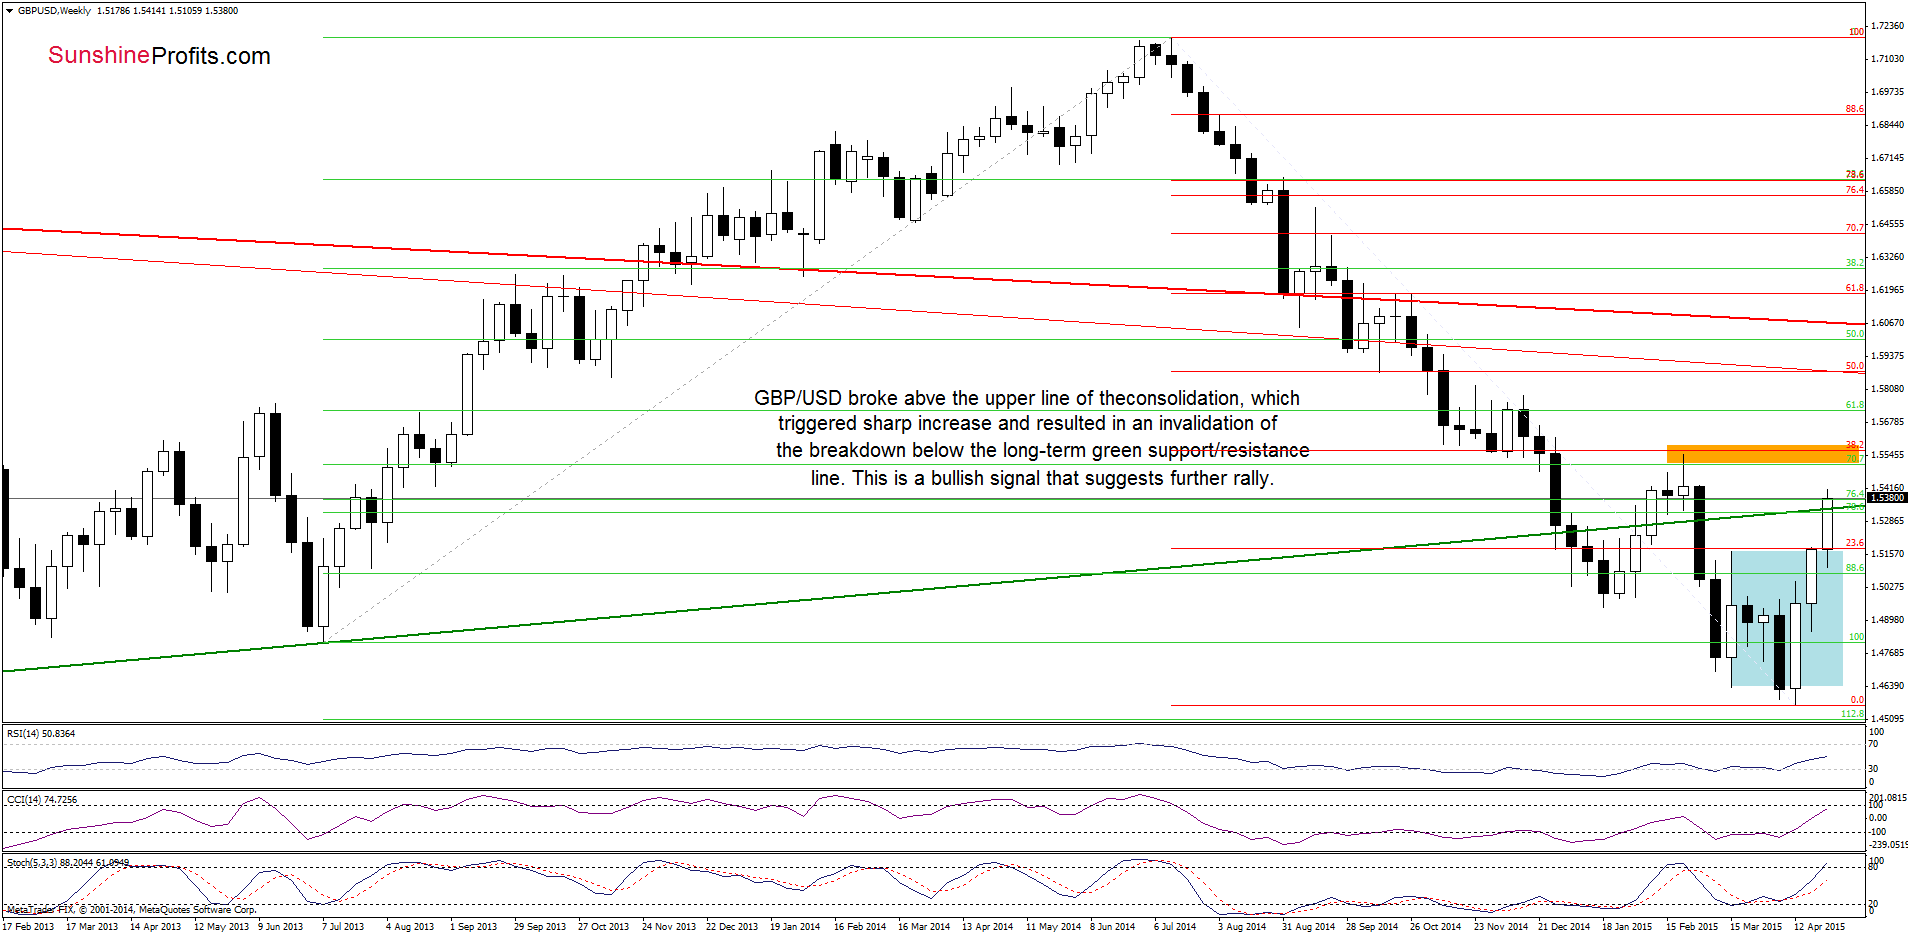
As you see on the weekly chart GBP/USD broke above the upper line of the consolidation (marked with blue), which triggered a sharp increase and resulted in an invalidation of the breakdown below the long-term green support/resistance line. This is a bullish signal, which suggests further rally and an increase to around 1.5565, where the 38.2% Fibonacci retracement (based on the entire Jul-Apr declines) is.
Are there any short-term factors that could stop currency bulls? Let’s examine the daily chart and find out.
On Monday, we wrote the following:
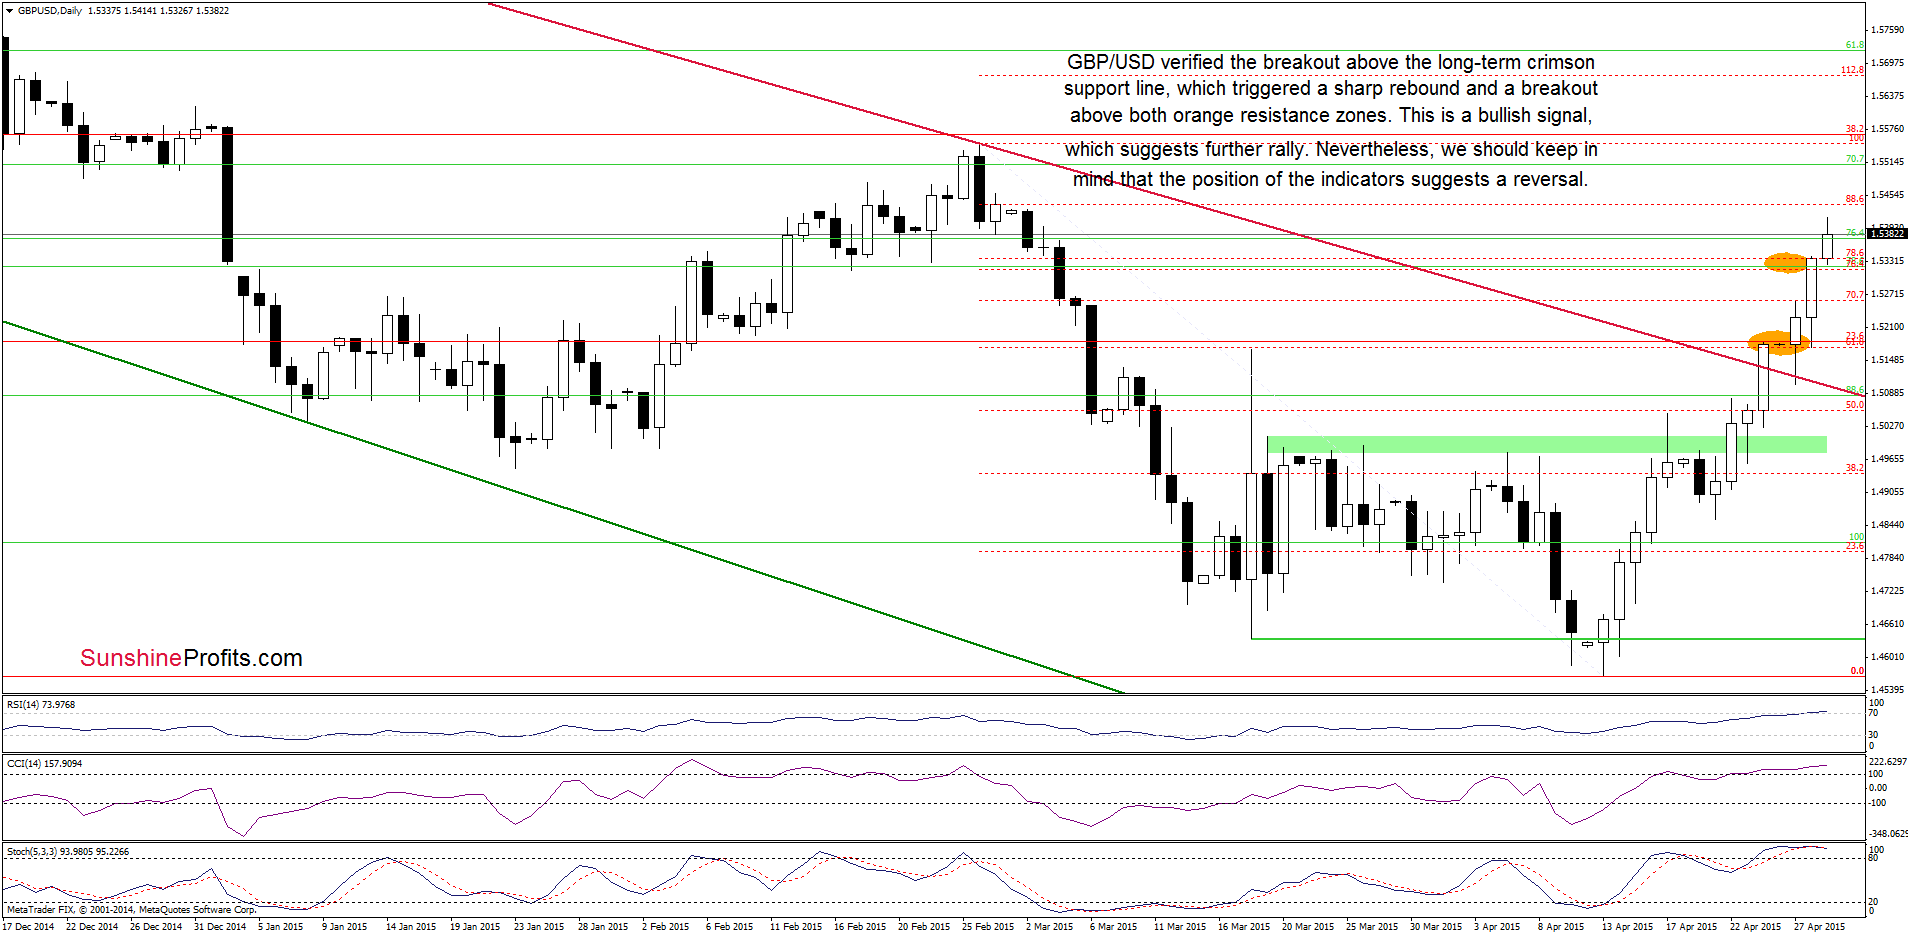
(…) the resistance zone created by the 23.6% Fibonacci retracement (based on the entire Jul-Apr orrection), 61.8% retracement (based on the Feb-Apr declines), the Mar 18 high and the upper line of the consolidation marked on the weekly chart (…)
(…) triggered a small pullback earlier today, which suggests a test of the previously-broken long-term support line in the coming day(s) – especially when we factor in the current position of the indicators (…)
From today’s point of view, we see that currency bears pushed the exchange rate to the above-mentioned line as we expected. Despite this deterioration, the long-term support withstood the selling pressure, which triggered a sharp rebound and a breakout above both orange resistance zones. This is a bullish signal, which suggests ffurther improvement and an ncrease to the 88.6% Fibonacci retracement or even to the Feb high of 1.5550 (slighty above this resistance level is also the 38.2% Fibonacci retracement marked on the weekly chart). Nevertheless, we should keep in mind that the current position of the indicators (the RSI climbed above the level of 70, while the CCI and Stochastic Oscillator are extremely overbought) suggests that reversal is just around the corner.
Very short-term outlook: mixed
Short-term outlook: mixed
MT outlook: mixed
LT outlook: mixed
Trading position (short-term; our opinion): No positions are justified from the risk/reward perspective at the moment. We will keep you informed should anything change, or should we see a confirmation/invalidation of the above.
USD/CAD
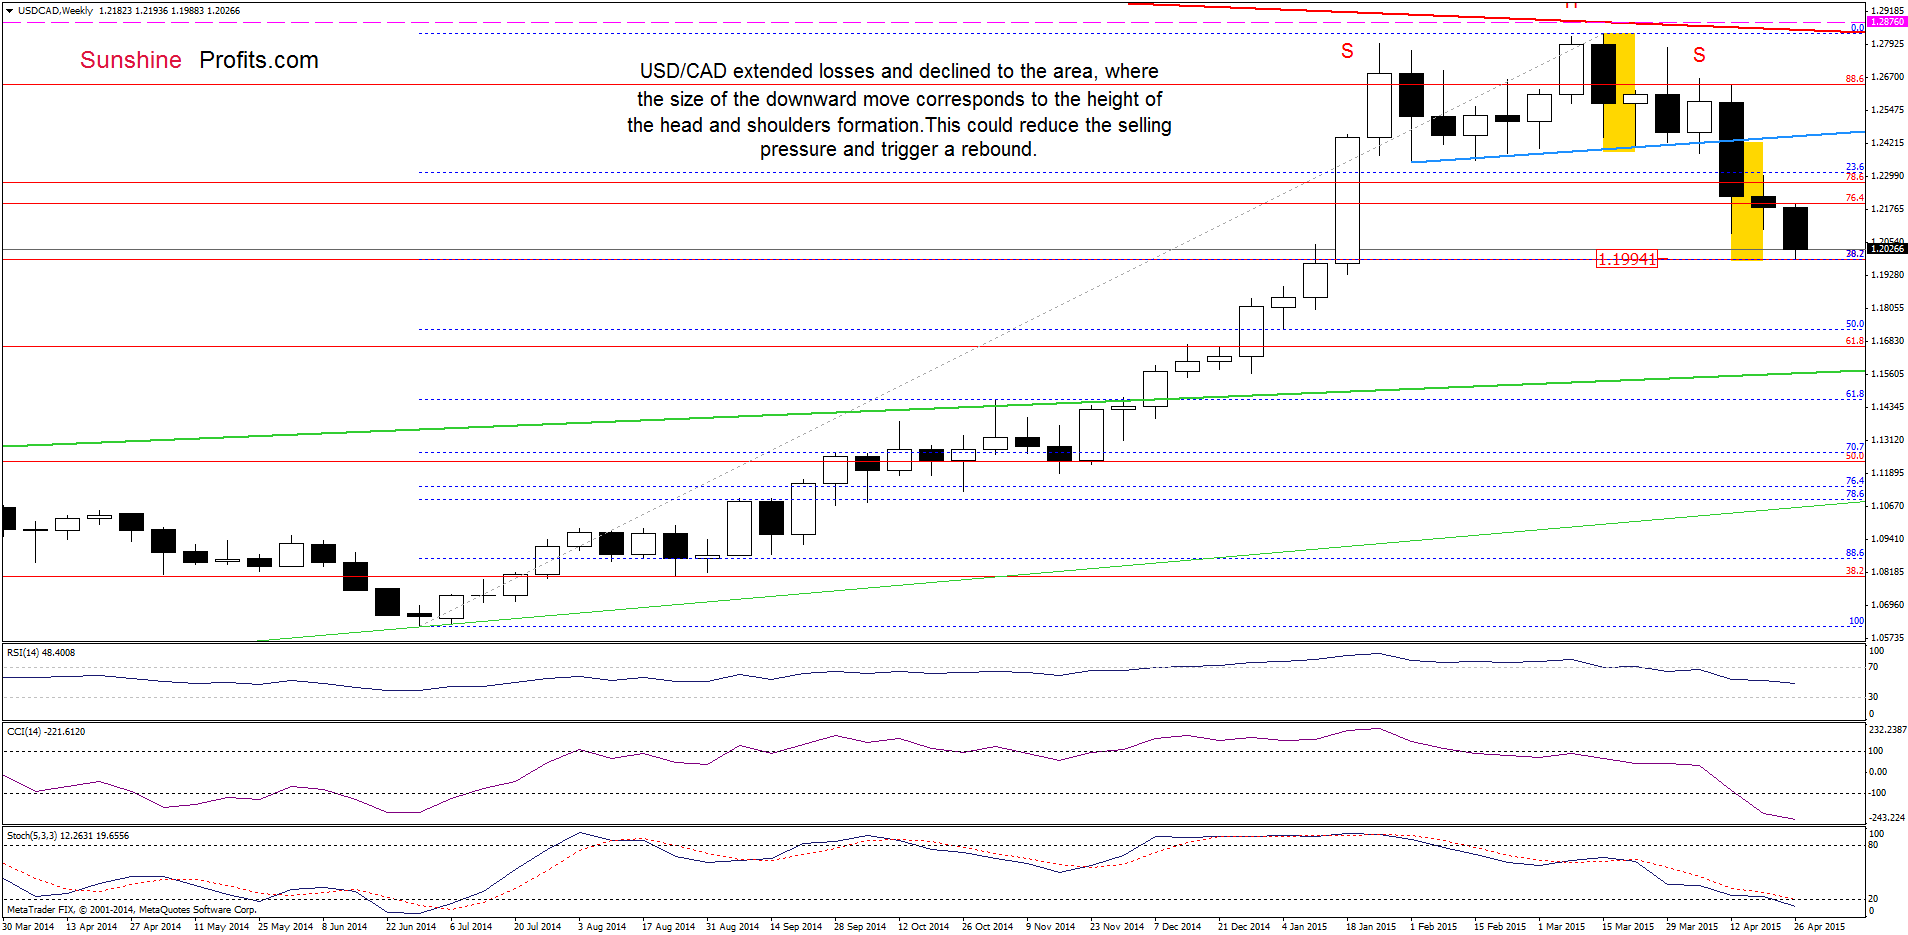
Quoting our alert posted on Apr 17:
(…) USD/CAD moved sharply lower and broke below the neck line, which suggests further correction and a drop to around 1.2000, where the size of the downward move will correspond to the height of the formation and where the 38.2% Fibonacci retracement level is.
On the weekly chart we see that the situation developed in tune with this scenario and USD/CAD dropped to our downside target. Taking this fact into account, and combining with the 38.2% Fibonacci retracement, it seems that we could see a reduction of the selling pressure and rebound from here in the coming days.
However, looking at the current position of the indicators (the CCI and Stochastic Oscillator are oversold, but there are no buy signals or positive divergences) we can’t rule out further deterioration. F this is the case, and the exchange rate breaks below the Fibonacci retracement, we could see a decline even to around 1.1731, where the 50% Fibonacci retracement is.
Are there any short-term supports that could hinder the realization of the above scenario? Let’s take a closer look at the daily chart below and find out.
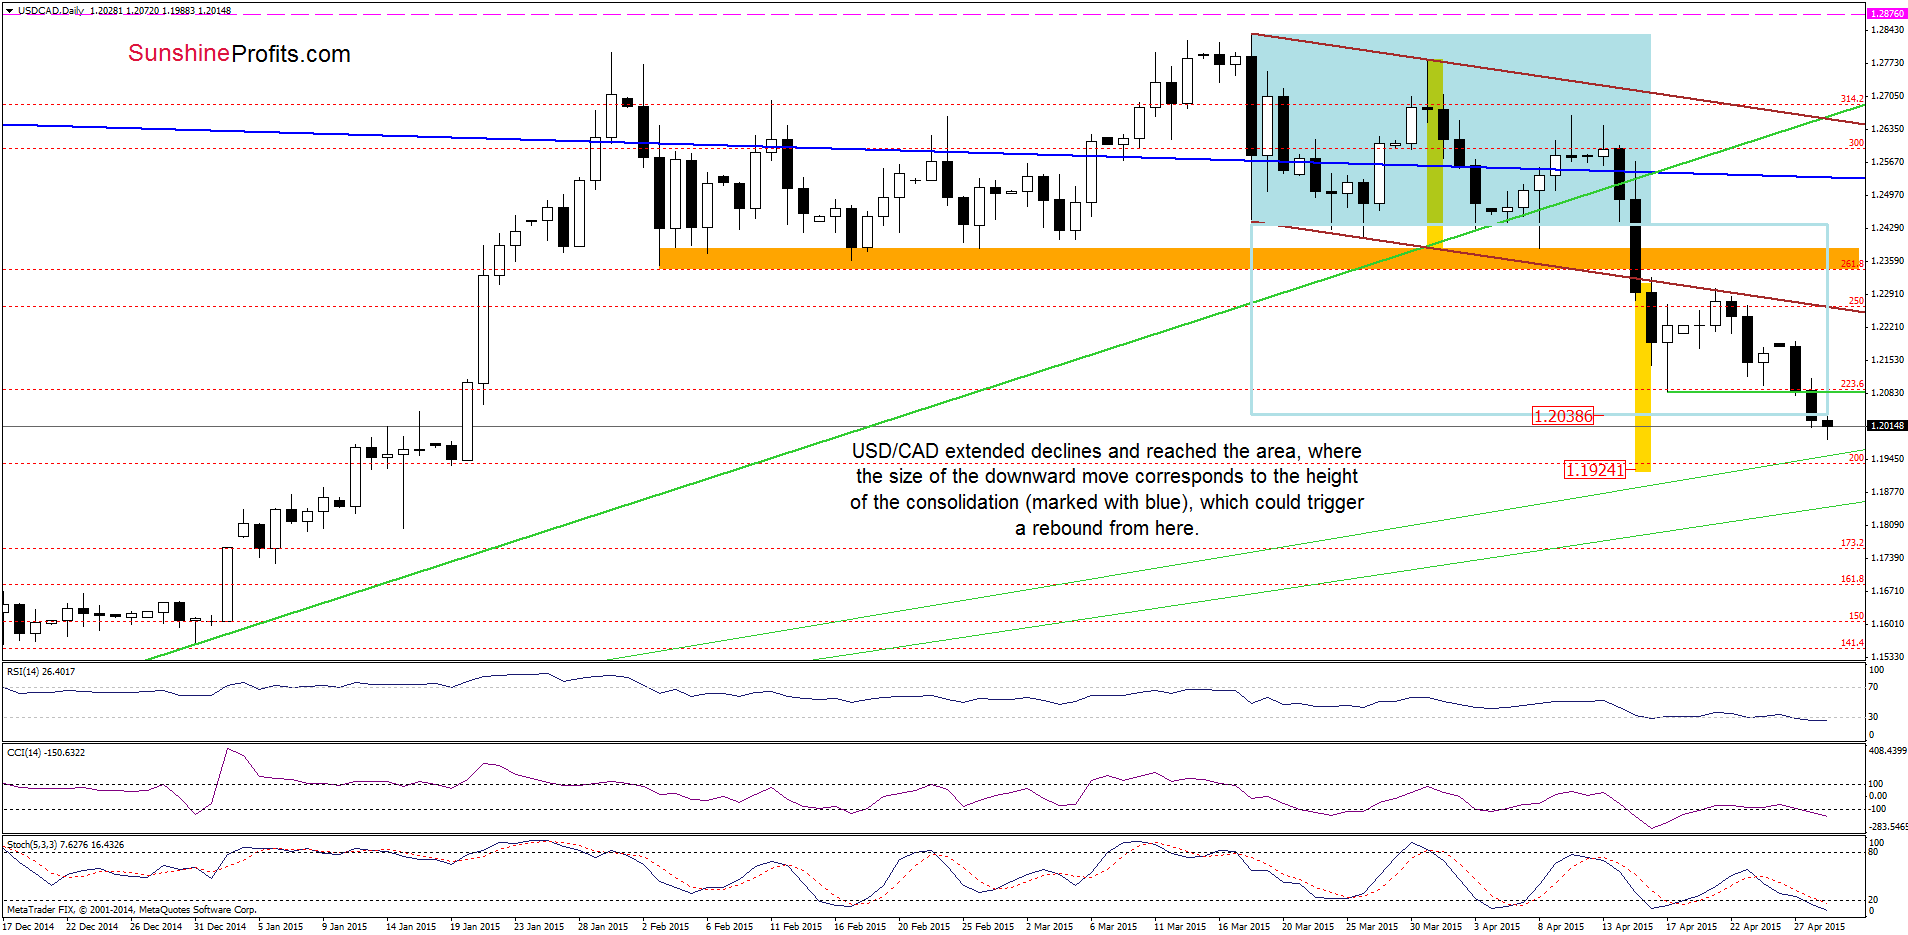
Looking at the daily chart, we see that USD/CAD reached the area, where the size of the downward move corresponds to the height of the consolidation (marked with blue). Similarly to what we wrote earlier, this could reduce the selling pressure and trigger a rebound. However, as you see there are no buy signals that could support currency bulls, which suggest that we might see a test of the long-term support line based on the Sep 19 and Nov 21 lows. If it holds, we’ll see a rebound to the lower border of the declining trend channel, but f it is broken, the next downside target would be around 1.1846, where the next long-term support line is.
Very short-term outlook: mixed
Short-term outlook: bearish
MT outlook: bearish
LT outlook: mixed
Trading position (short-term; our opinion): No positions are justified from the risk/reward perspective at the moment. We will keep you informed should anything change, or should we see a confirmation/invalidation of the above.
Thank you.
Nadia Simmons
Forex & Oil Trading Strategist
Przemyslaw Radomski, CFA
Founder, Editor-in-chief
Gold & Silver Trading Alerts
Forex Trading Alerts
Oil Investment Updates
Oil Trading Alerts

