

Yesterday, the U.S. Department of Labor reported that the initial jobless claims in the week ending April 11 increased by 12,000 to 294,000, missing analysts’ expectations for a drop by 2,000 to 280,000. Additionally, the U.S. Commerce Department showed that the number of building permits issued in March dropped by 5.7% , while U.S. housing starts rose by 2.0% in the previous month also missing expectations for an increase of 15.9%. Thanks to these disappointing numbers, the USD Index extended declines and dropped below 98, breaking below the medium-term support line. Did this drop change the short-term picture of the major currency pairs?
In our opinion the following forex trading positions are justified - summary:
- EUR/USD: none
- GBP/USD: none
- USD/JPY: none
- USD/CAD: short (stop loss order at 1.2876)
- USD/CHF: none
- AUD/USD: none
EUR/USD
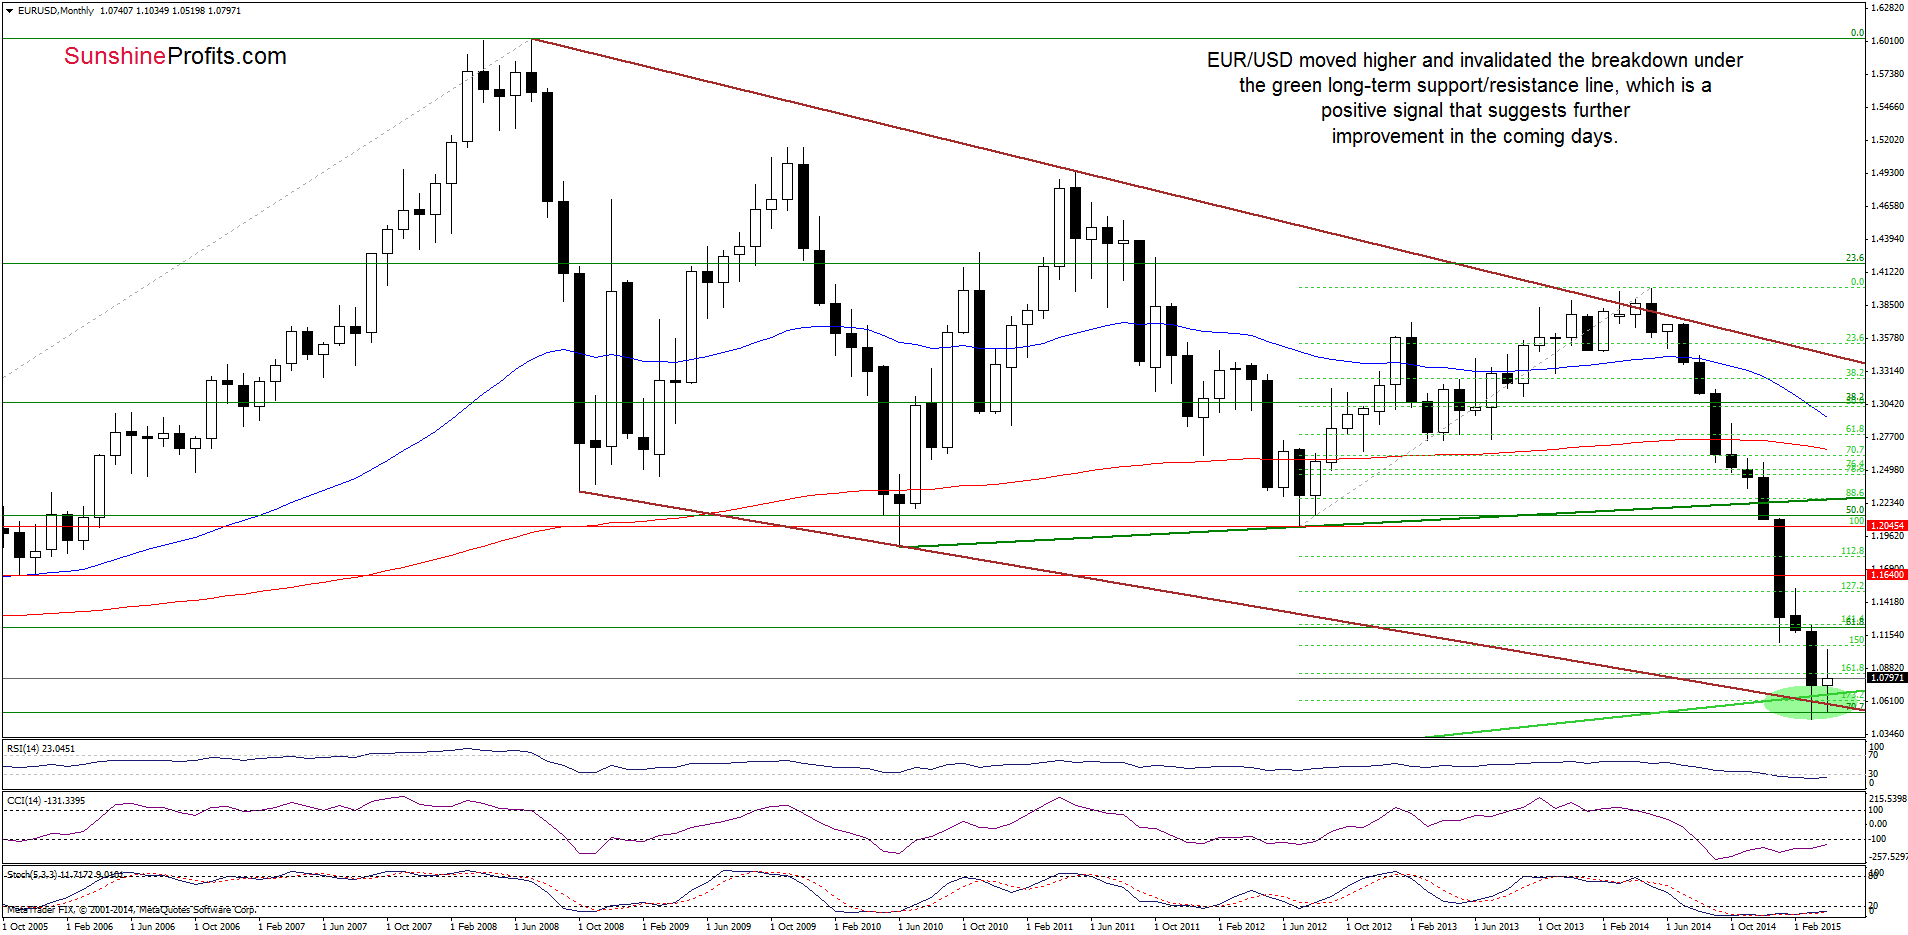
The medium-term picture has improved as EUR/USD moved higher and invalidated the breakdown under the long-term green support/resistance line which is a positive signal that suggests further improvement in the coming days.
How high could he exchange rate go? Let’s examine the daily chart and find out.
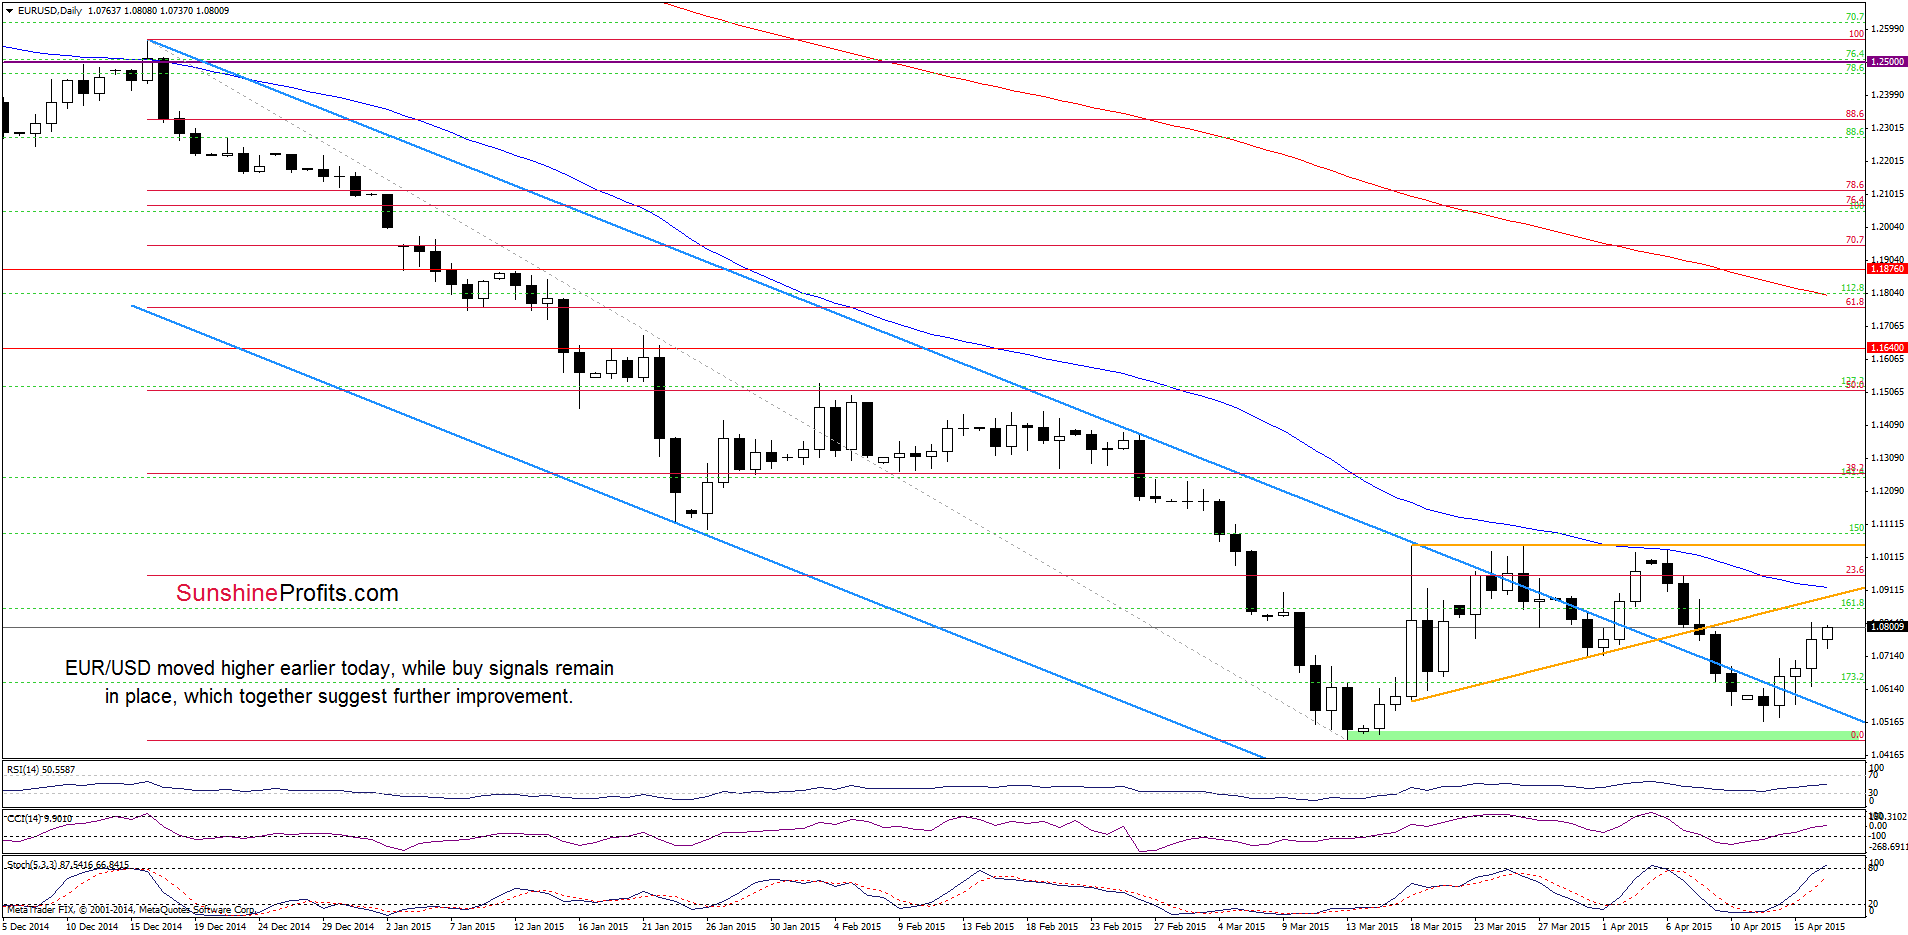
Looking at the above chart, we see that EUR/USD moved higher and moved away from the previously-broken the upper border of the blue declining trend channel. Additionally, buy signals remain in place, which suggests further improvement. If this is the case, the initial upside target from our last commentary will be in play:
If (…) the exchange rate moves higher from here, the initial upside target would be the previously-broken orange resistance line (…).
Please note that slightly above this line (currently at 1.0887) is also the 50-day moving average, which reinforces this resistance area.
Very short-term outlook: bullish
Short-term outlook: mixed with bullish bias
MT outlook: mixed
LT outlook: mixed
Trading position (short-term; our opinion): No positions are justified from the risk/reward perspective at the moment. We will keep you informed should anything change, or should we see a confirmation/invalidation of the above.
GBP/USD
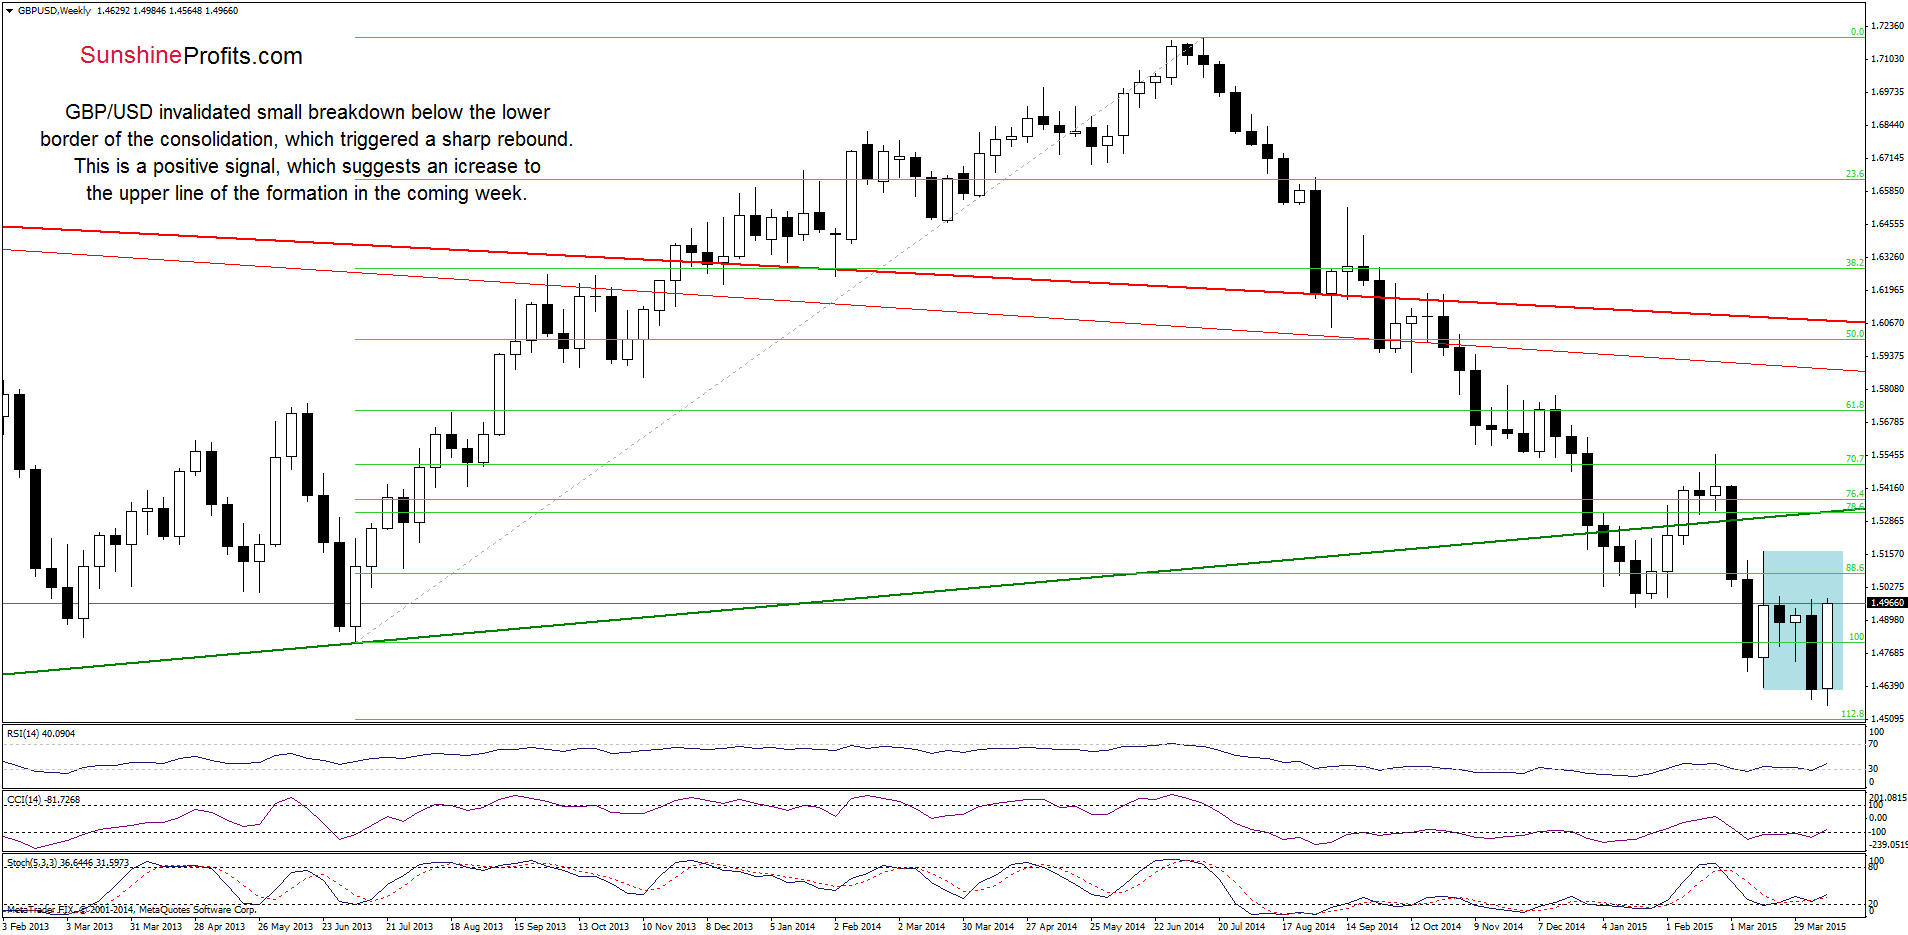
The first thing that catches the eye on the above chart is an invalidation of small breakdown under the lower border of the consolidation, which triggered a sharp rally earlier this week. This is a positive signal, which suggests further improvement and an increase to the upper line of the formation in the coming week.
Are there any short-term resistance levels that could hinder the realization of the above scenario? Let’s take a look at the daily chart and find out.
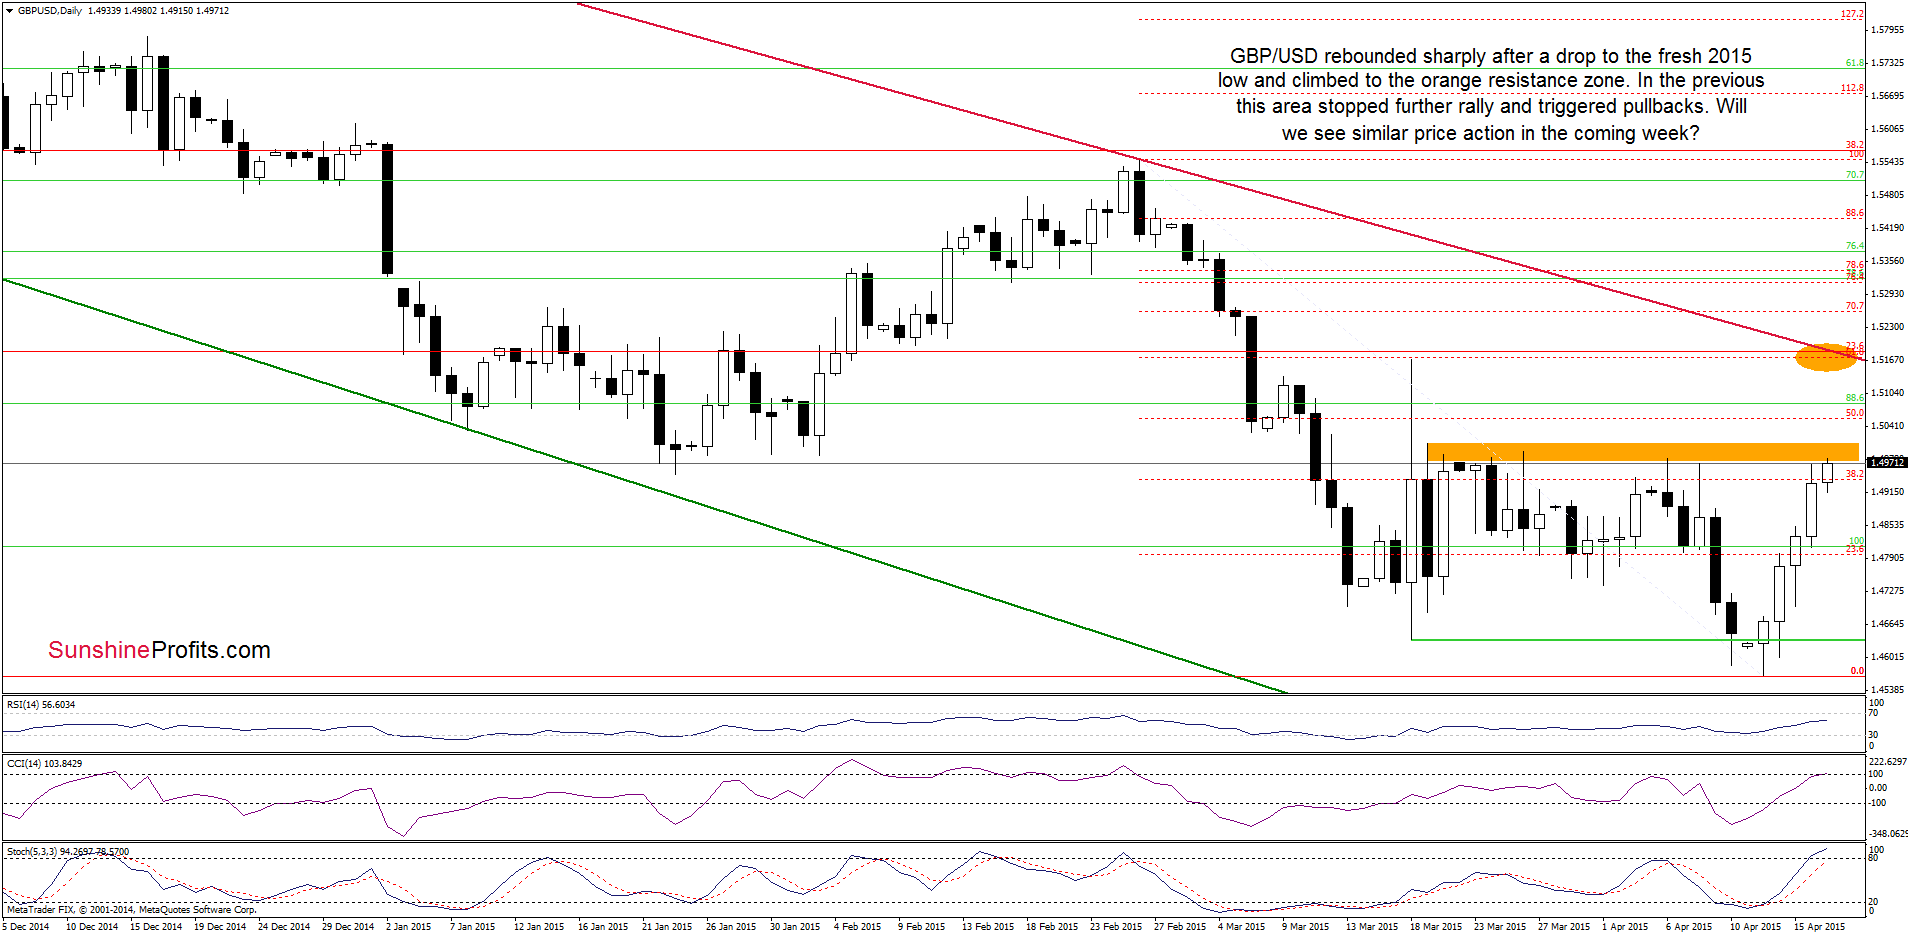
From todays point of view, we see that GBP/USD rebounded sharply after a drop to the fresh 2015 low and climbed to the orange resistance zone. In the previus months this area stopped further improvement and triggered pullbacks. Taking this fact into account, we might see similar price action in the coming days. However, the current position of the indicators (in combination with the medium-term picture) suggests that currency buulls will try to push the pair higher. If they succeed, the initial upside target would be around 1.5170, where the resistance zone (marked wih orange ellipse) created by the long-term crimson resistance line (based on the Jul and Feb highs), the 23.6% Fibonacci retracement (based on the entire Jul-Apr orrection), 61.8% retracement (based on the Feb-Apr declines) and the Mar 18 high is. At this point, it is also worth noting that this area is reinforced by the upper line of the formation marked on the weekly chart.
Very short-term outlook: bullish
Short-term outlook: mixed with bullish bias
MT outlook: mixed
LT outlook: mixed
Trading position (short-term; our opinion): No positions are justified from the risk/reward perspective at the moment. We will keep you informed should anything change, or should we see a confirmation/invalidation of the above.
USD/JPY
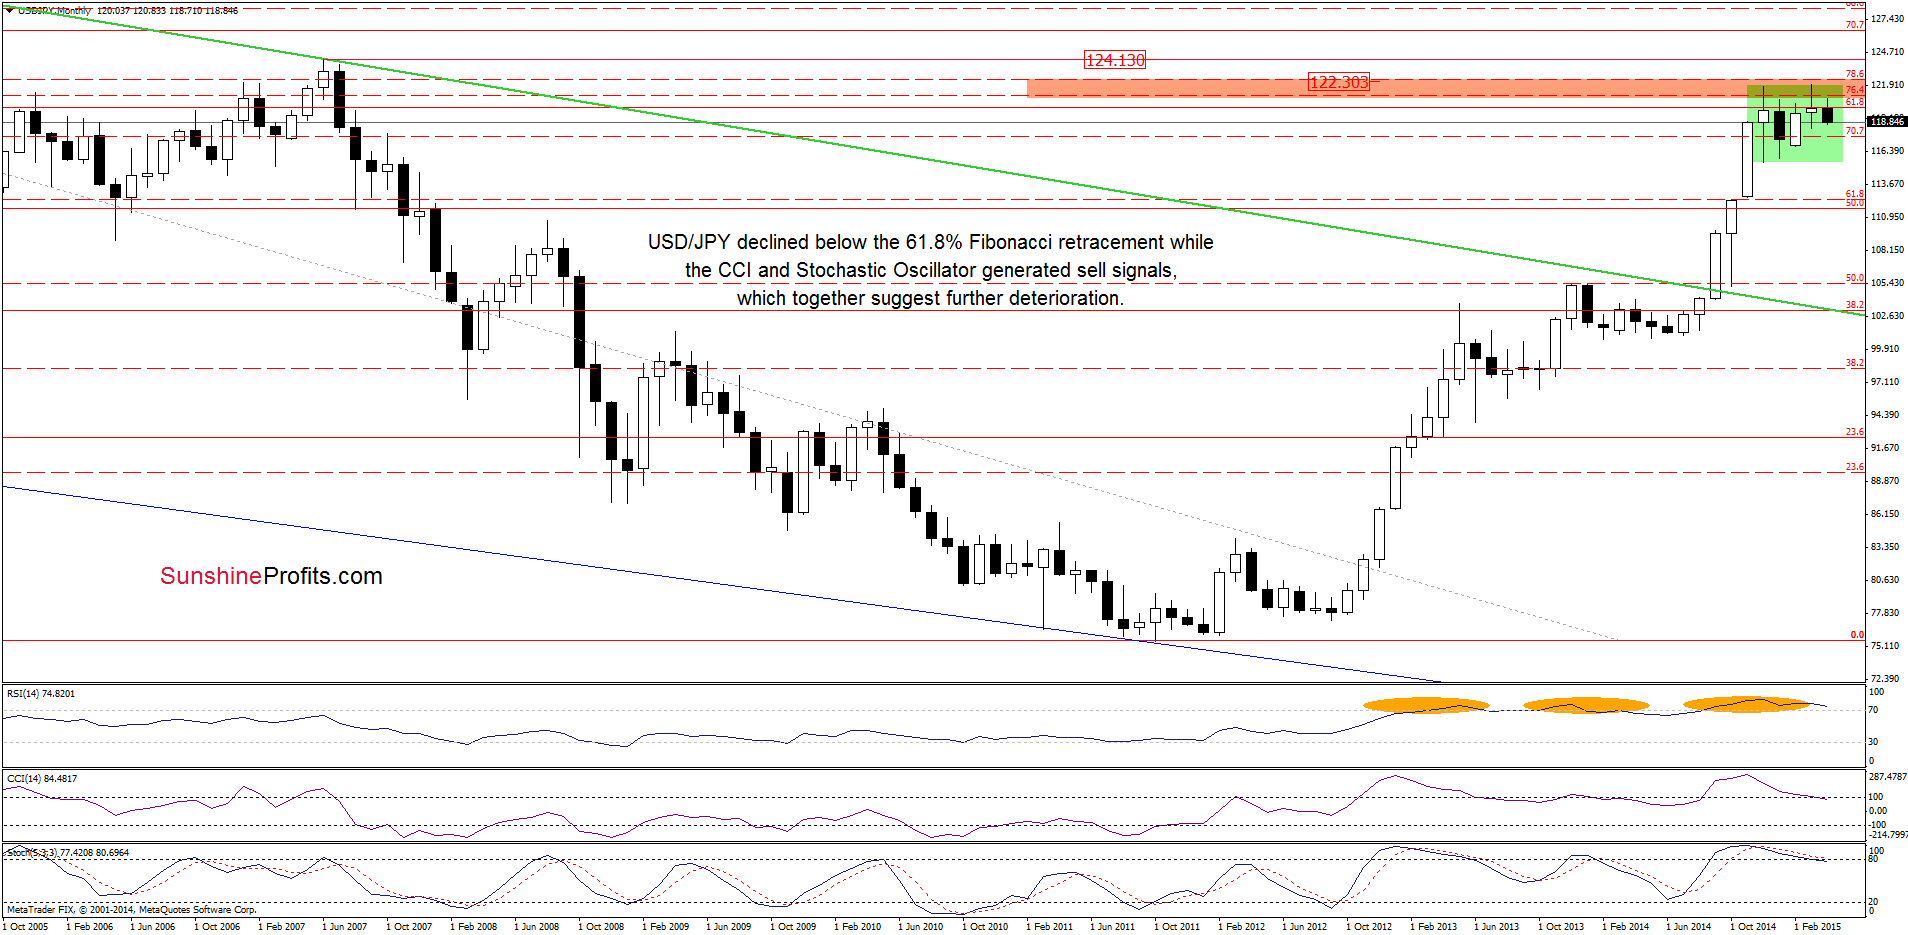
Although USD/JPY is still trading in a consolidation (between the Dec high and low), the pair declined below the 61.8% Fibonacci retracement level (based on the entire 1998-2011 declines) and the CCI and Stochastic Oscillator generated sell signals, which together suggests further deterioration.
Can we infer something more from the daily chart? Let’s check.
Yesterday, we wrote the following:
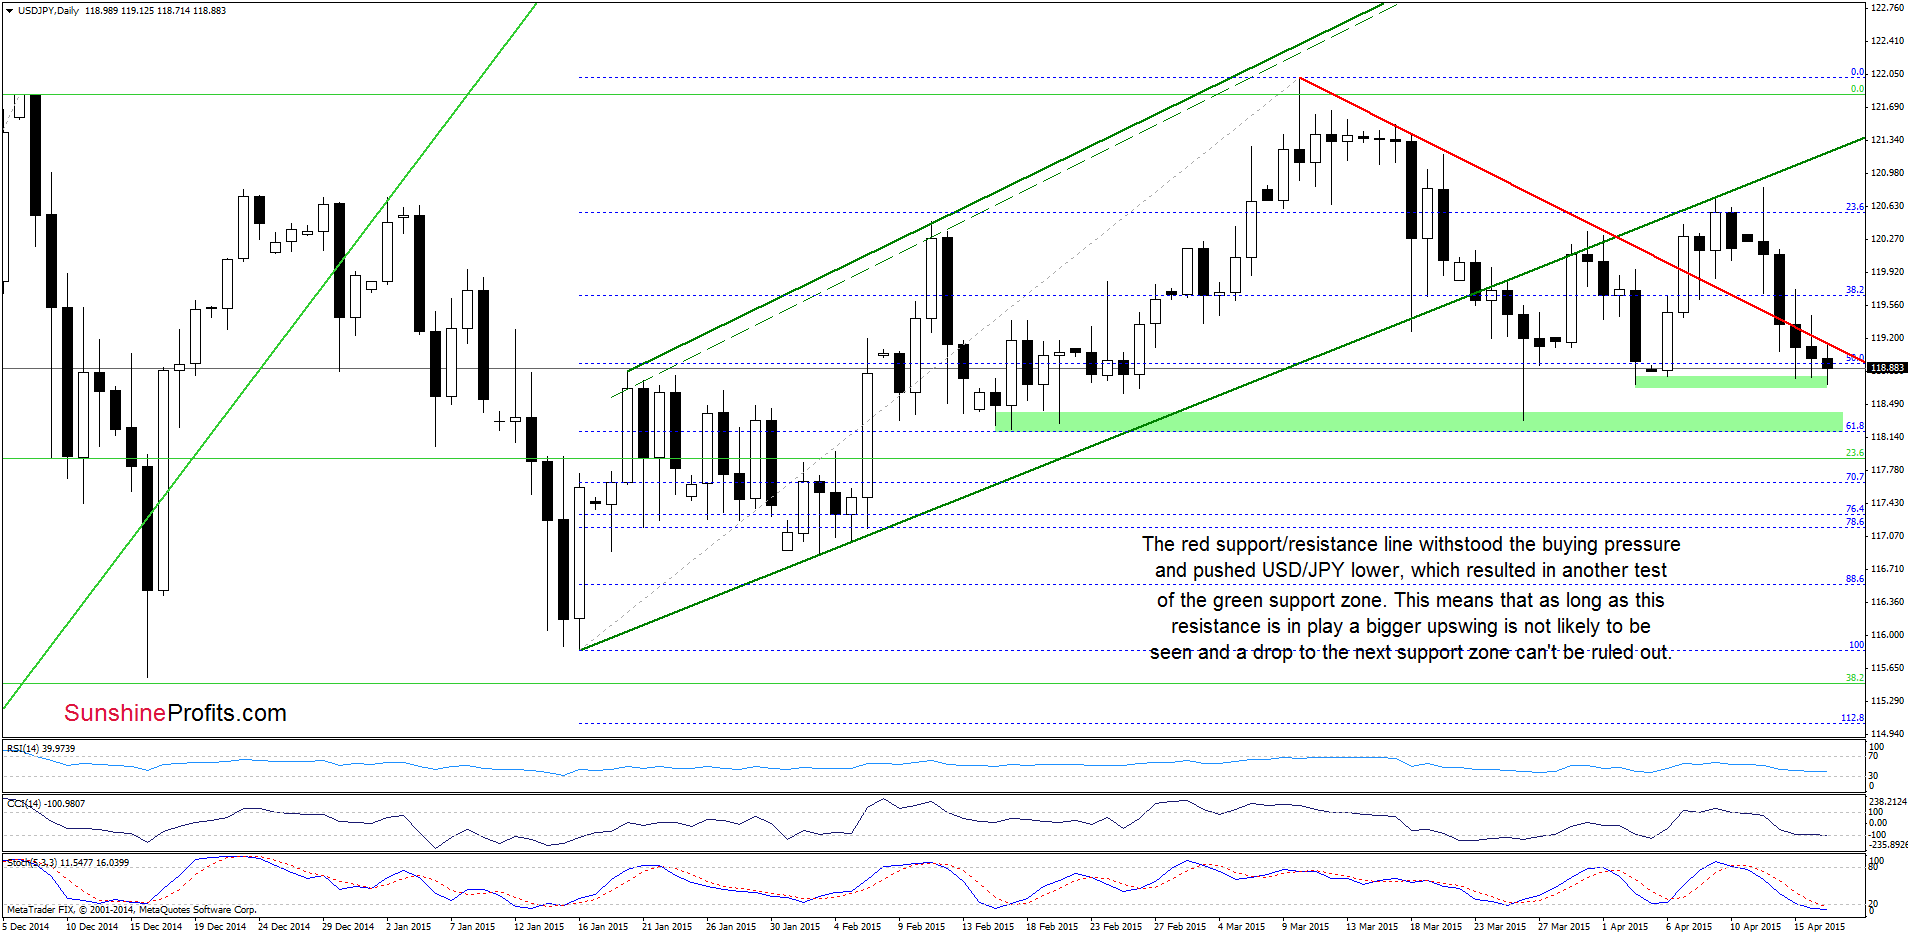
(…) the green support zone triggered a rebound, which took the exchange rate above the declining red line. Despite this improvement, sell signals generated by the indicators remain in place, supporting the bearish case. Therefore, in our opinion, today’s increase will be more reliable if we see a daily close above the resistance line.
As you see on the above chart, currency bulls failed and the exchange rate declined below the red line and closed yesterday’s session below it. This negative signal triggered further deterioration and resulted in another test of the green support zone. This means that as long as there is no daily close above the red line a bigger upswing is not likely to be seen and a drop to the next support zone (based on the Feb, March lows and the 61.8% Fibonacci retracement) can’t be ruled out (especially if sell signals remain in place).
Very short-term outlook: mixed with bearish bias
Short-term outlook: mixed
MT outlook: mixed
LT outlook: bullish
Trading position (short-term; our opinion): No positions are justified from the risk/reward perspective at the moment. We will keep you informed should anything change, or should we see a confirmation/invalidation of the above.
USD/CAD
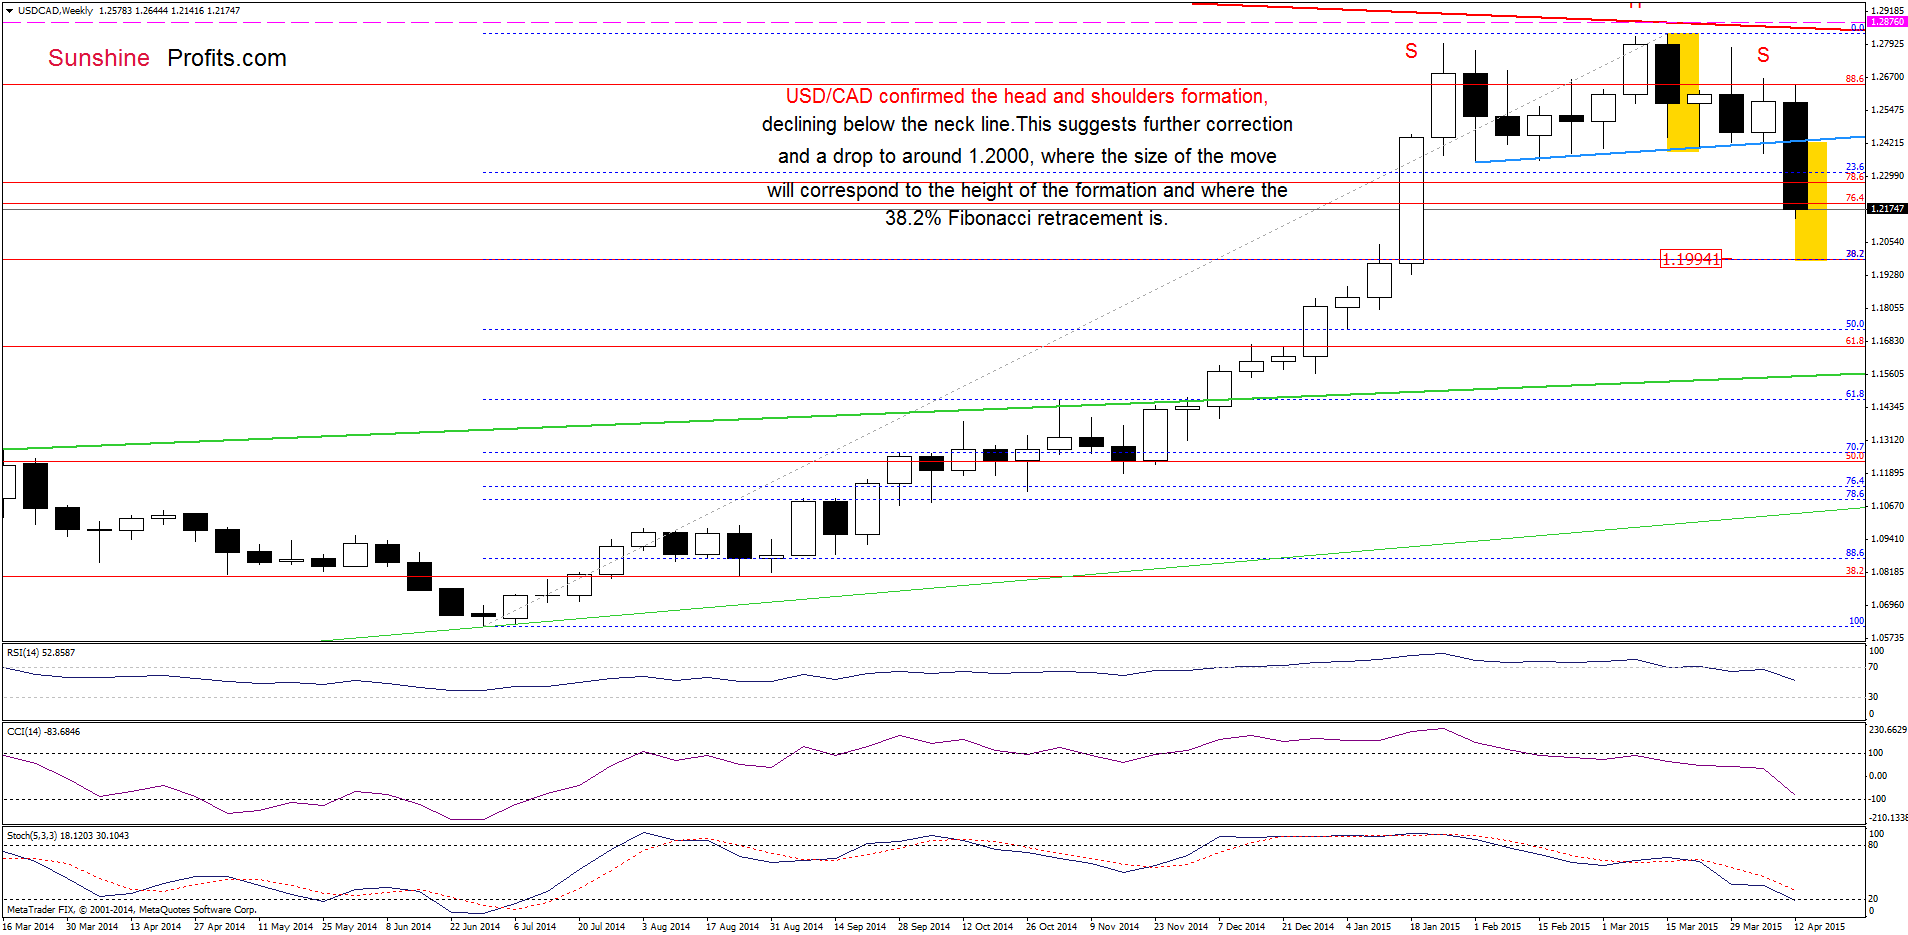
On the weekly chart we see that USD/CAD extended losses, which means that our last commentary is still up-to-date:
(…) USD/CAD moved sharply lower and broke below the neck line, which suggests further correction and a drop to around 1.2000, where the size of the downward move will correspond to the height of the formation and where the 38.2% Fibonacci retracement level is.
How did this drop affect the very short-term picture? Let’s find out.
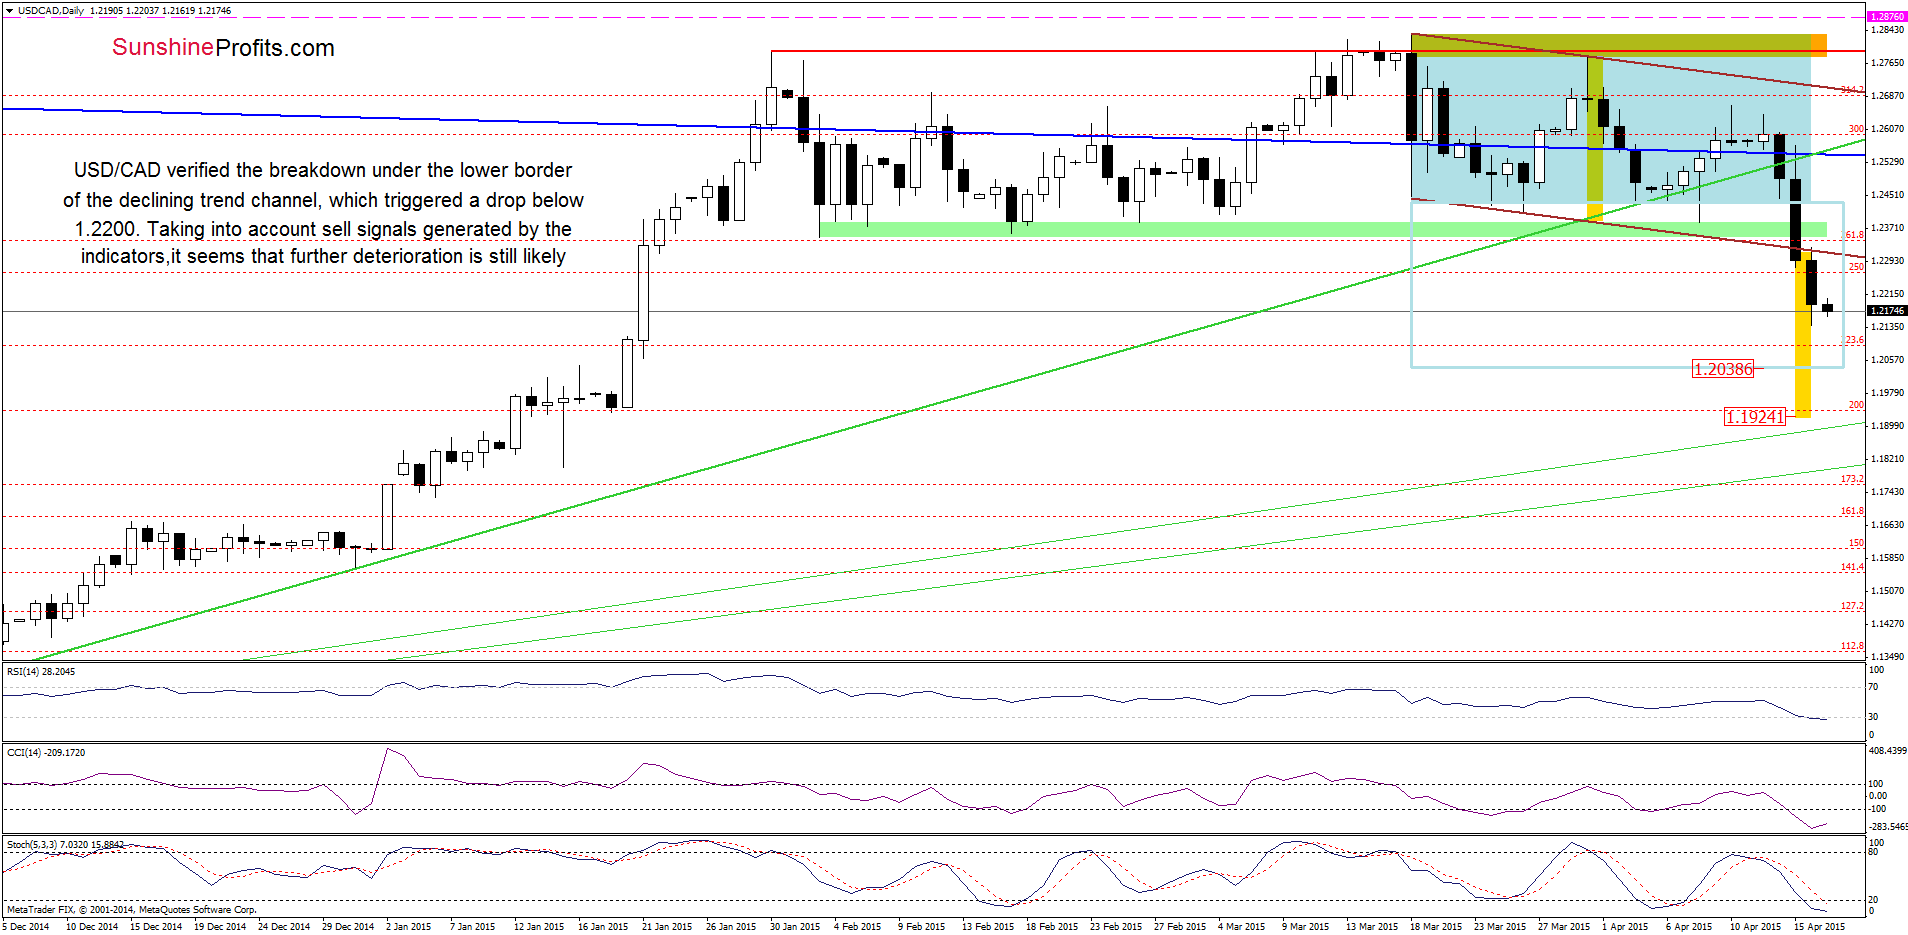
Yesterday, USD/CAD verified the breakdown under the lower border of the declining trend channel, which triggered a drop below 1.2200. Taking this fact into account, and combining it with sell signals generated by the indicators and the medium-term picture, we think that further deterioration is still likely. Therefore, we believe that what we wrote yesterday remains valid:
(…) in our opinion, the initial downside target for currency bears would be around 1.2040, where the size of the downward move will correspond to the height of the consolidation (on Tuesday, the pair broke below the lower line of the formation, triggering a bearish scenario).
(…) the relationship between the exchange rate and the oil market (…) since the beginning of the month, the commodity gained almost 18%, which was supportive for the Canadian dollar (in this period of time USD/CAD lost 3%). Therefore, we think that the pair’s further moves will continue to strongly linked to the price of crude oil (if you want to keep up with the changes taking place every day and receive trading signals, we encourage you to read our daily Oil Trading Alerts).
Very short-term outlook: bearish
Short-term outlook: bearish
MT outlook: bearish
LT outlook: mixed
Trading position (short-term; our opinion): Short positions (which are already profitable) with a stop loss order at 1.2876 are still justified from the risk/reward perspective. We will keep you informed should anything change, or should we see a confirmation/invalidation of the above.
USD/CHF
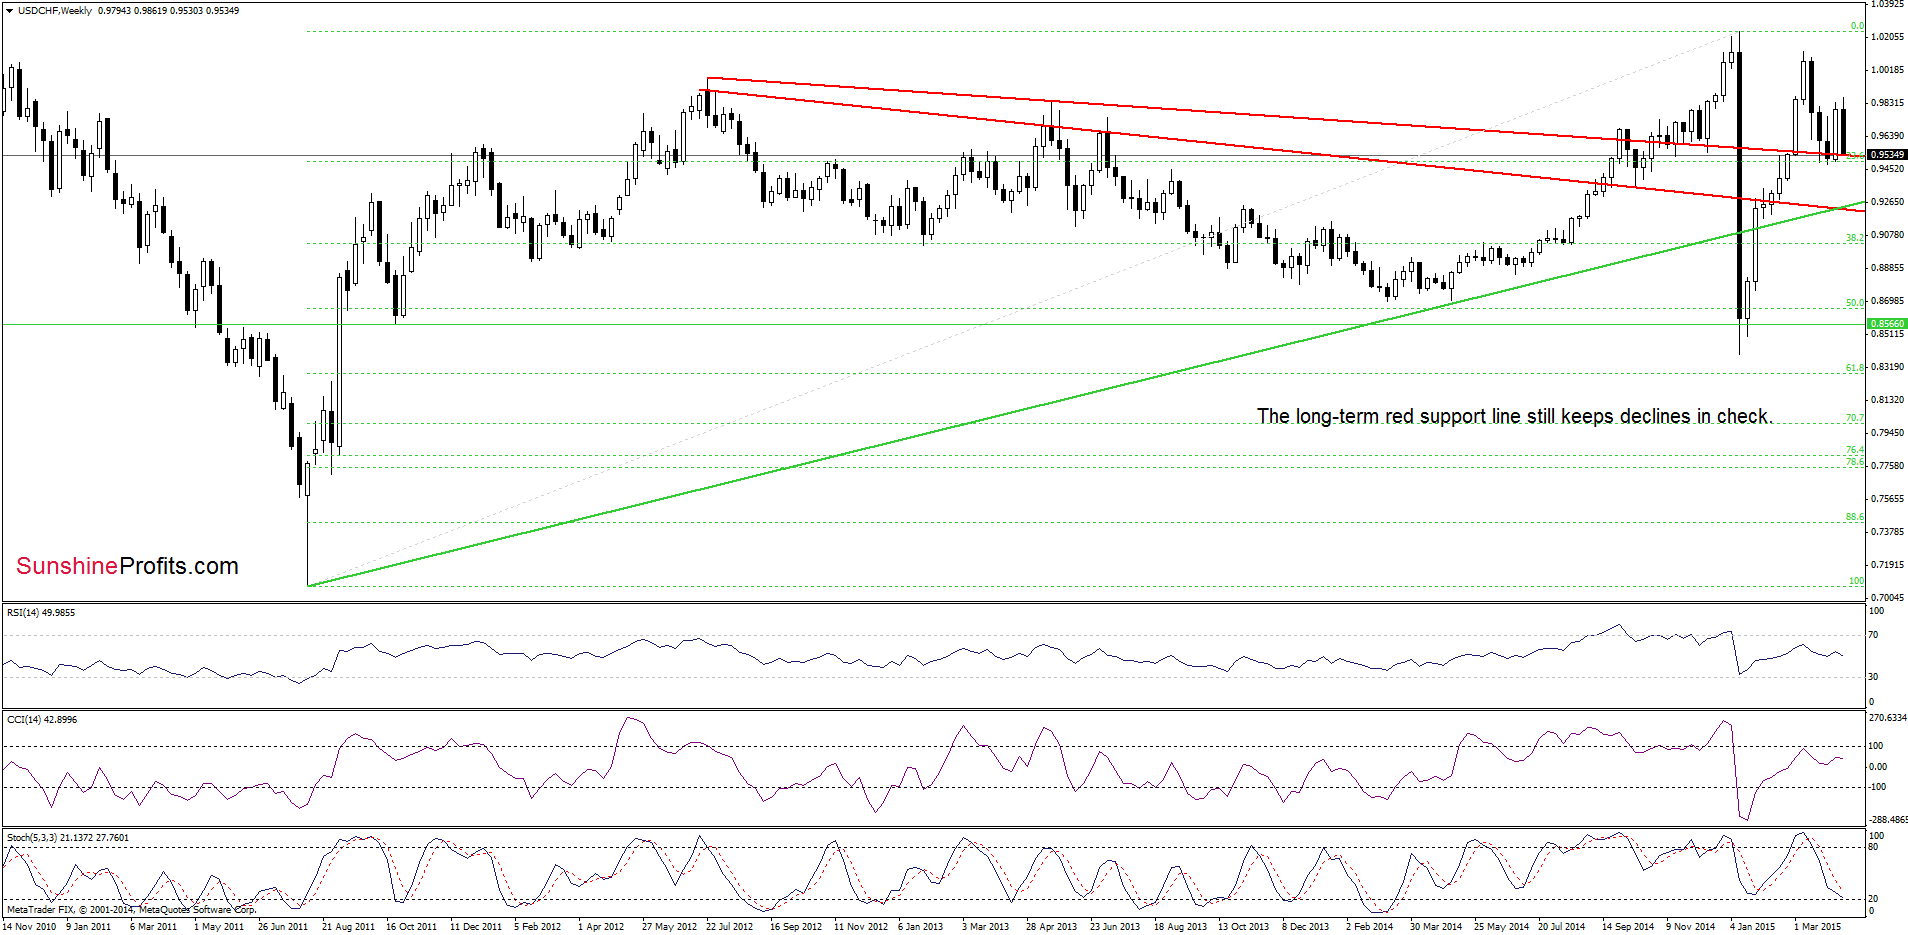
Quoting our last commentary on this currency pair:
(…) USD/CHF climbed to the orange line. Yesterday, this resistance triggered a pullback, which in combination with sell signals generated by the CCI and Stochastic Oscillator suggests that lower values of the exchange rate in the coming days should not surprise us.
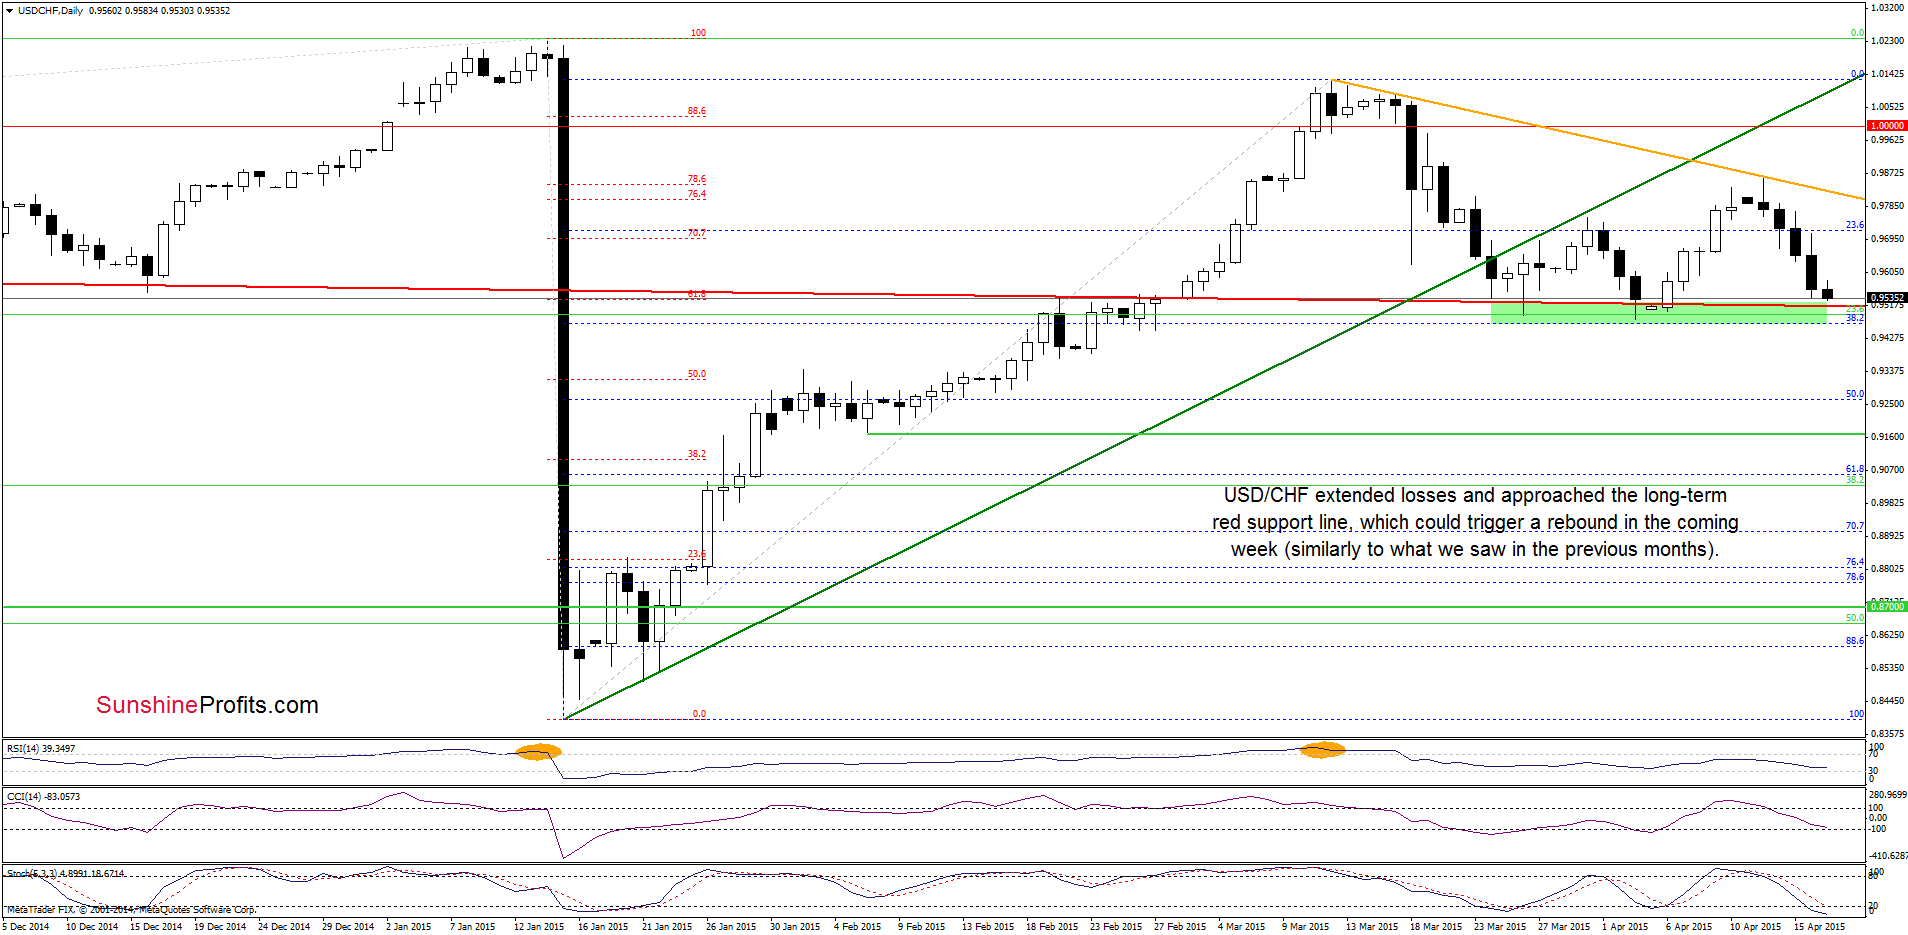
As you see on the chart, the situation developed in line with the above scenario and USD/CHF declined in the recent days. With this downward move the exchange rate approached the long-term red line, which serves as the key support at the moment. In the previous months this line stopped further deterioration and triggered upswings. This suggests that we could see similar price action in the near future. However, taking into account the current position of the indicators, it seems that currency bears will try to push the exchange rate lower. If they succeed, it would be a very negative signal, which will trigger further deterioration and a drop to the Apr low of 0.9480. If t is broken, the next support will be around 0.9264, where the 50% Fibonacci retracement (based on the entire Jan-March rally) is.
Very short-term outlook: mixed with bearish bias
Short-term outlook: mixed
MT outlook: mixed
LT outlook: bearish
Trading position (short-term; our opinion): No positions are justified from the risk/reward perspective at the moment. We will keep you informed should anything change, or should we see a confirmation/invalidation of the above.
AUD/USD
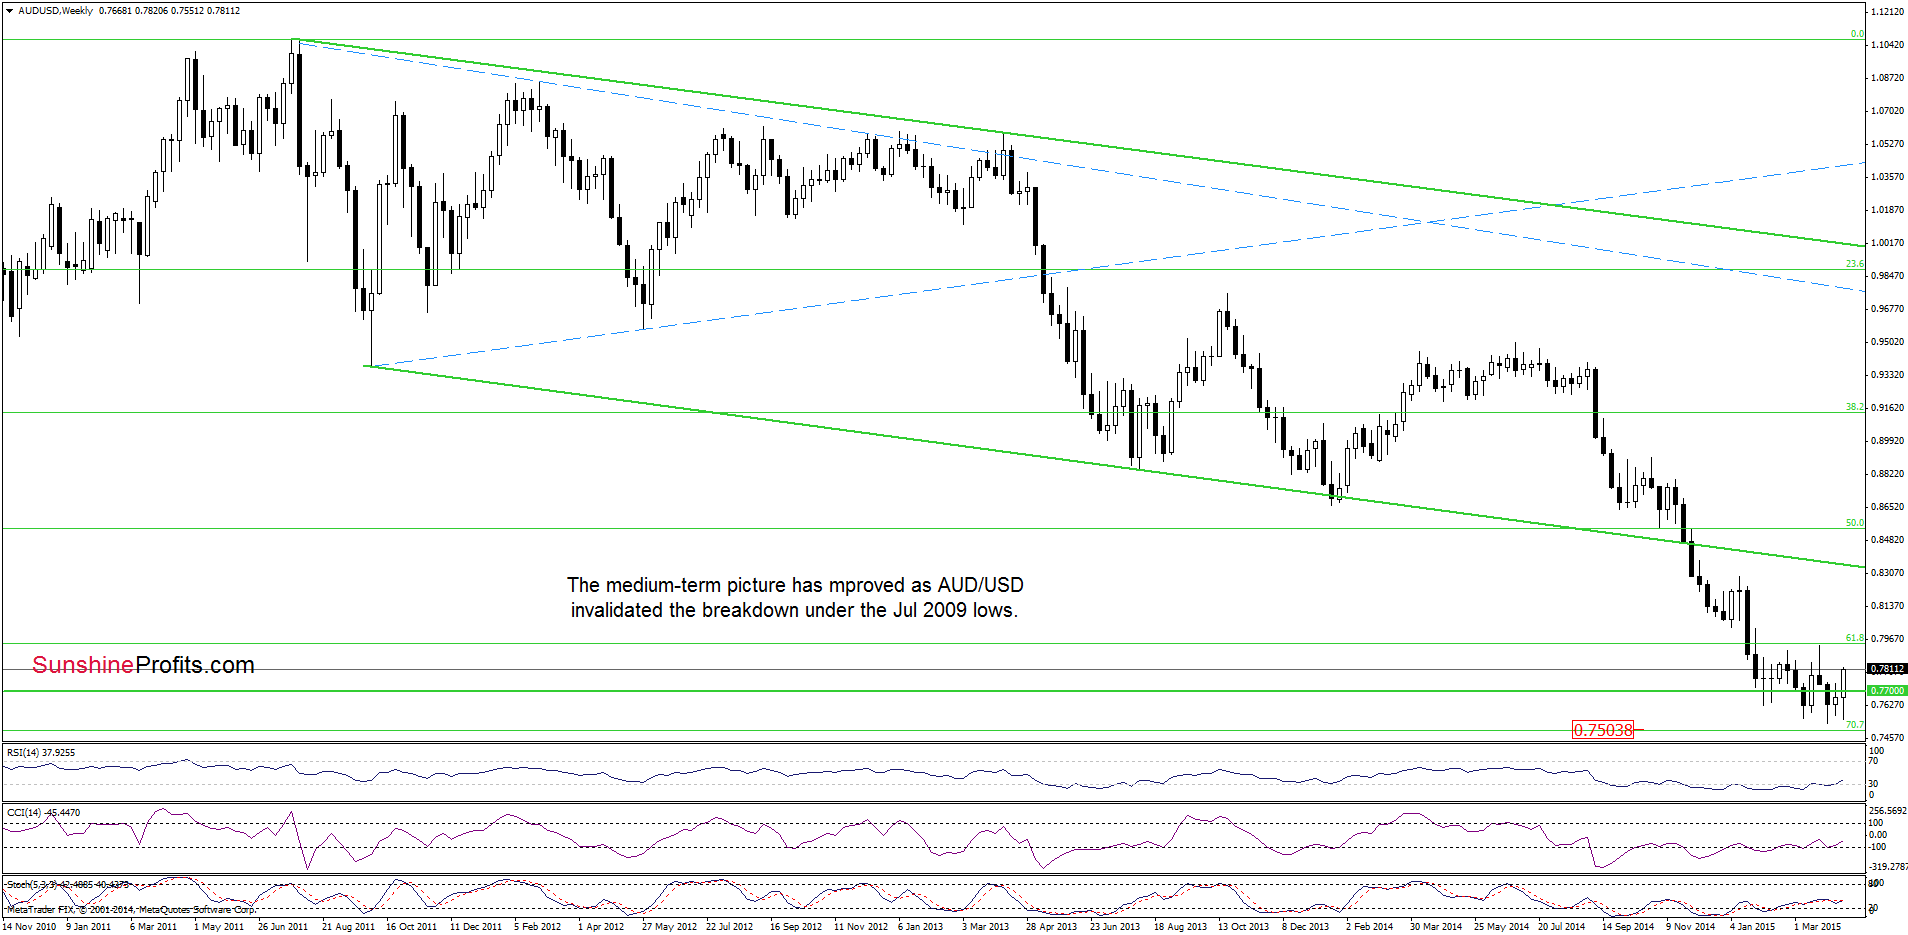
The medium-term outlook has improved as AUD/USD invalidated the breakdown under the Jul 2009 lows. This is a positive signal, which suggests further improvement.
How high could the exchange rate go? Let’s examine the daily chart and find out.
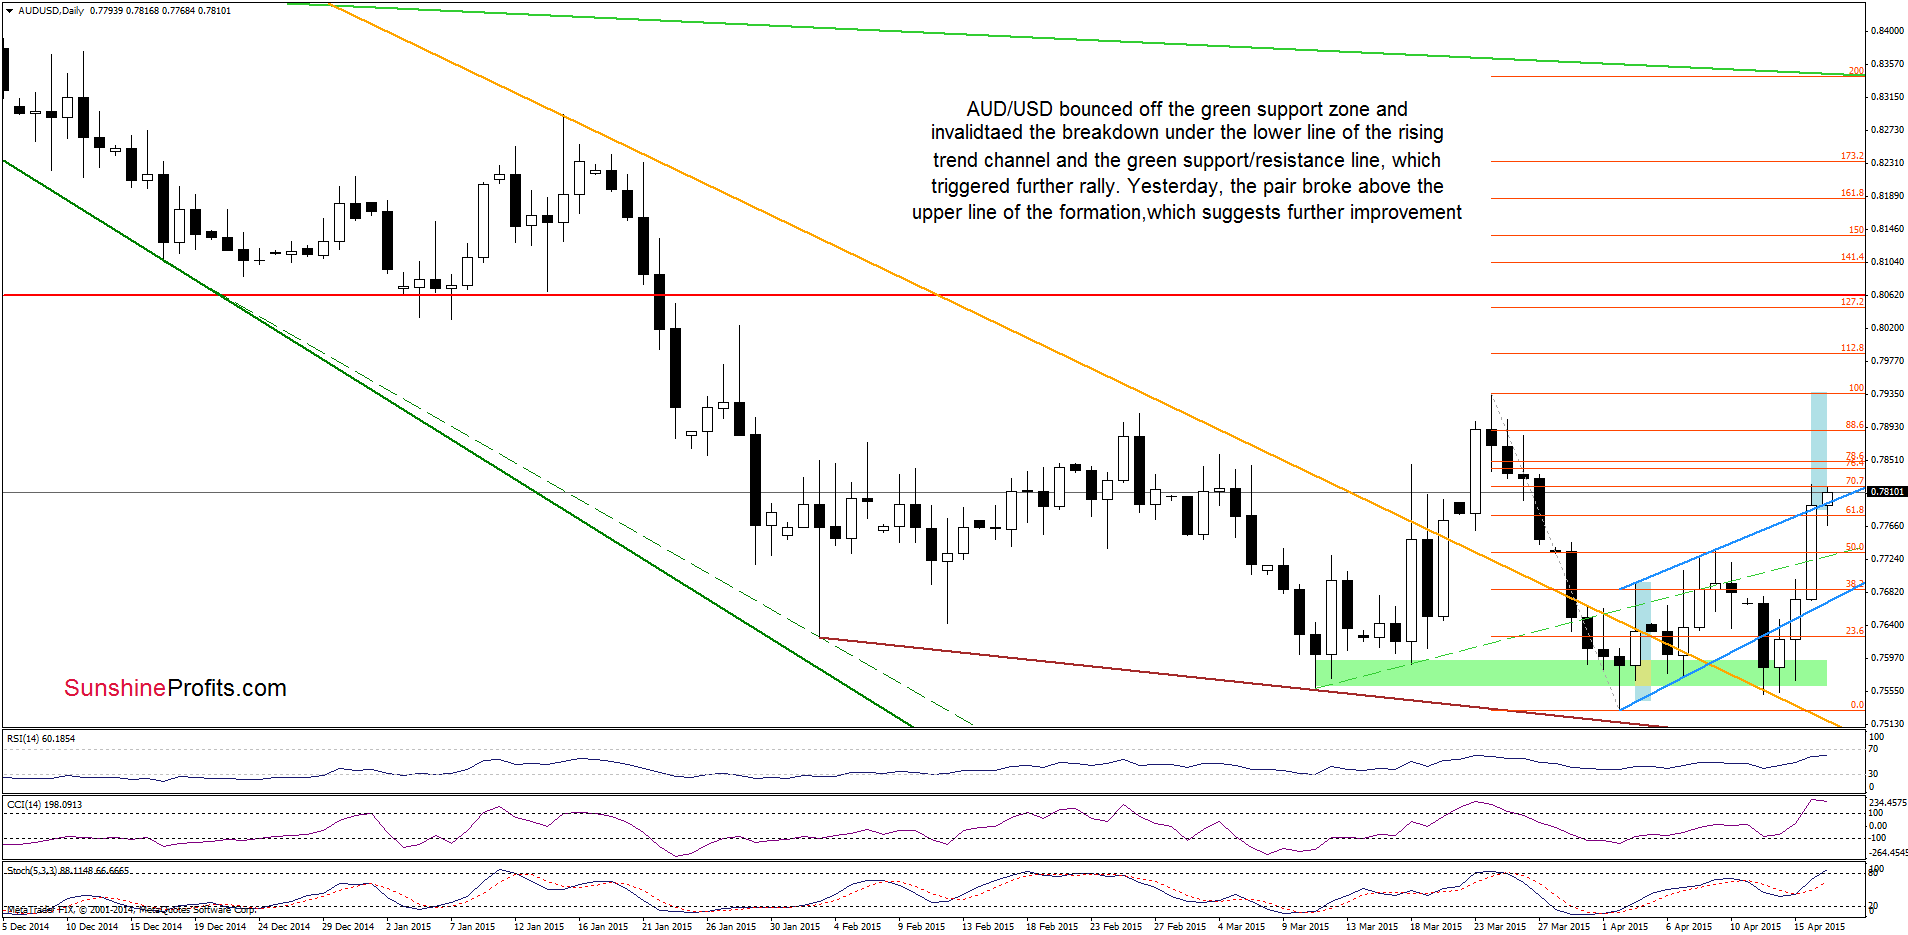
As you see on the above chart, AUD/USD bounced off the green support zone and invalidated the breakdown under the lower line of the blue trend channel and the green support/resistance line, which triggered a sharp rally yesterday. With this upward move the pair broke above the upper line of the rising trend channel, which suggests further improvement and an increase to around 0.7937, where the size of the upswing will correspond to the height of the formation and where the March 24 high is. Additionally, buy signals generated by the indicators remain in place, supporting the bullish case at the moment.
Very short-term outlook: bullish
Short-term outlook: mixed with bullish bias
MT outlook: mixed
LT outlook: mixed
Trading position (short-term; our opinion): No positions are justified from the risk/reward perspective at the moment. We will keep you informed should anything change, or should we see a confirmation/invalidation of the above.
Thank you.
Nadia Simmons
Forex & Oil Trading Strategist
Przemyslaw Radomski, CFA
Founder, Editor-in-chief
Gold & Silver Trading Alerts
Forex Trading Alerts
Oil Investment Updates
Oil Trading Alerts

