

Earlier today, the minutes of the Bank of England’s April meeting showed that policymakers voted for keeping rates unchanged at a record low 0.5%. This news supported the pound against the greenback and pushed GBP/USD to the solid resistance zone. Will we finally see a successful breakout and higher values of the exchange rate?
In our opinion the following forex trading positions are justified - summary:
- EUR/USD: none
- GBP/USD: none
- USD/JPY: none
- USD/CAD: short (stop loss order at 1.2876)
- USD/CHF: none
- AUD/USD: none
EUR/USD
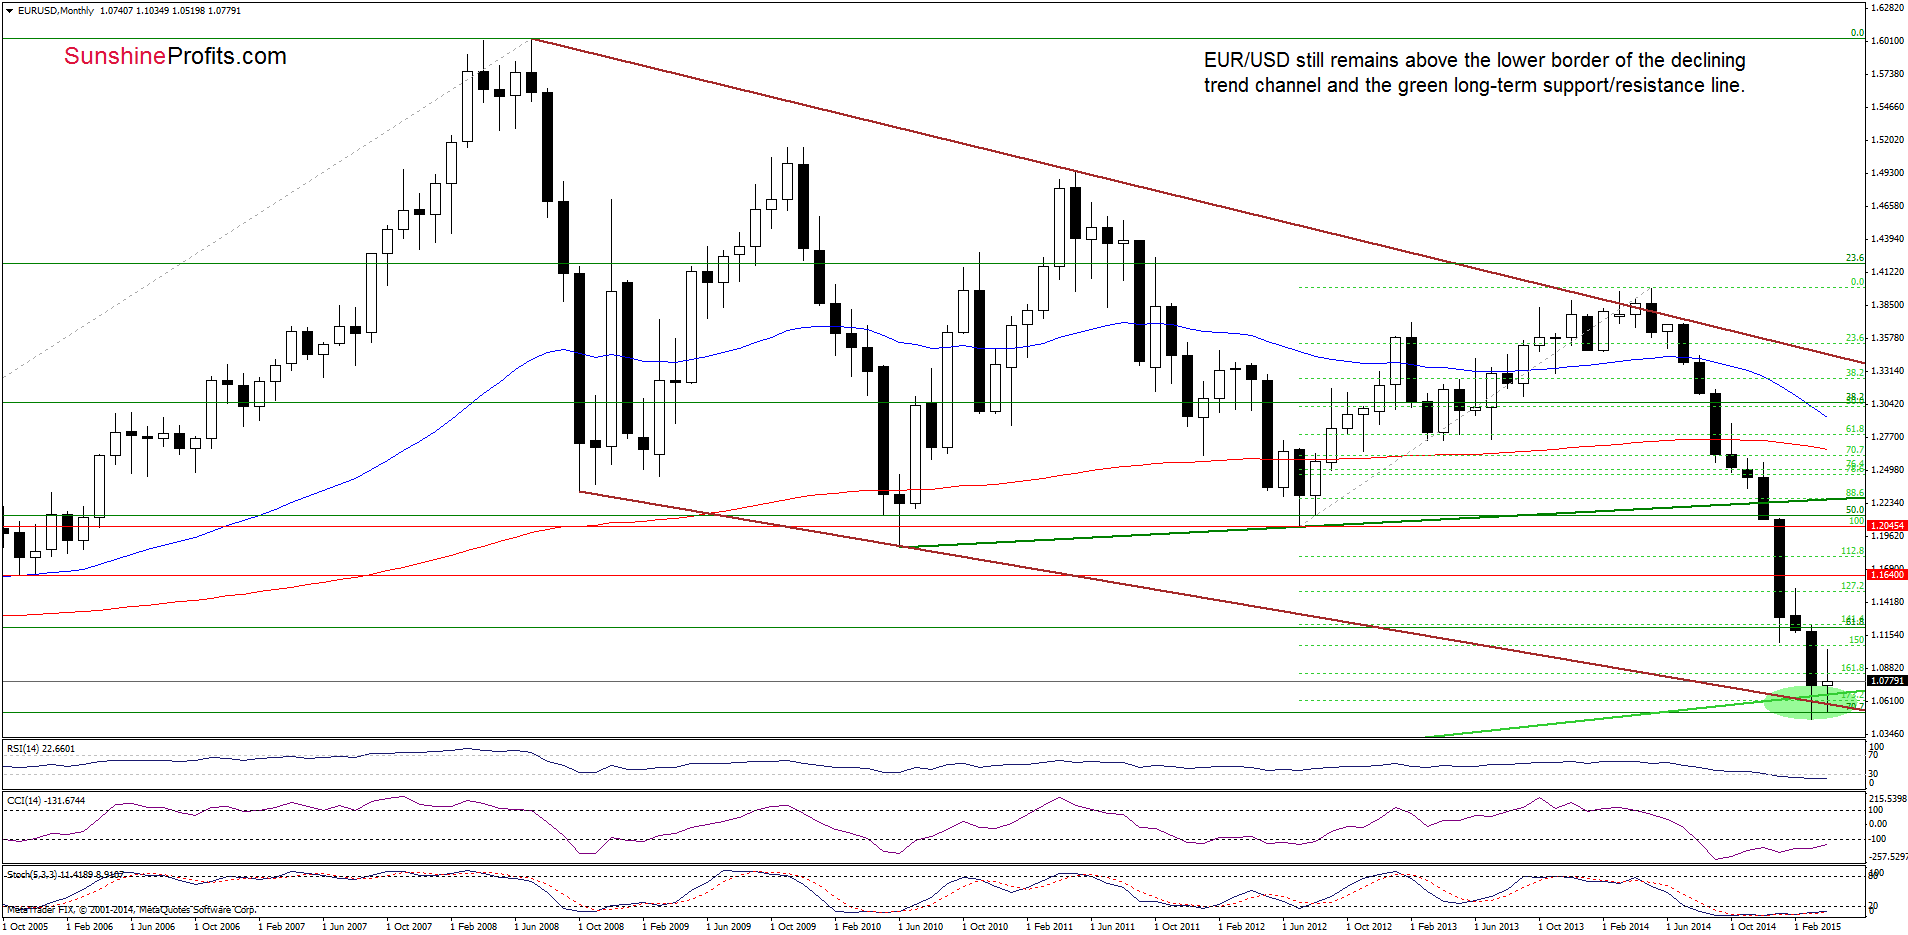
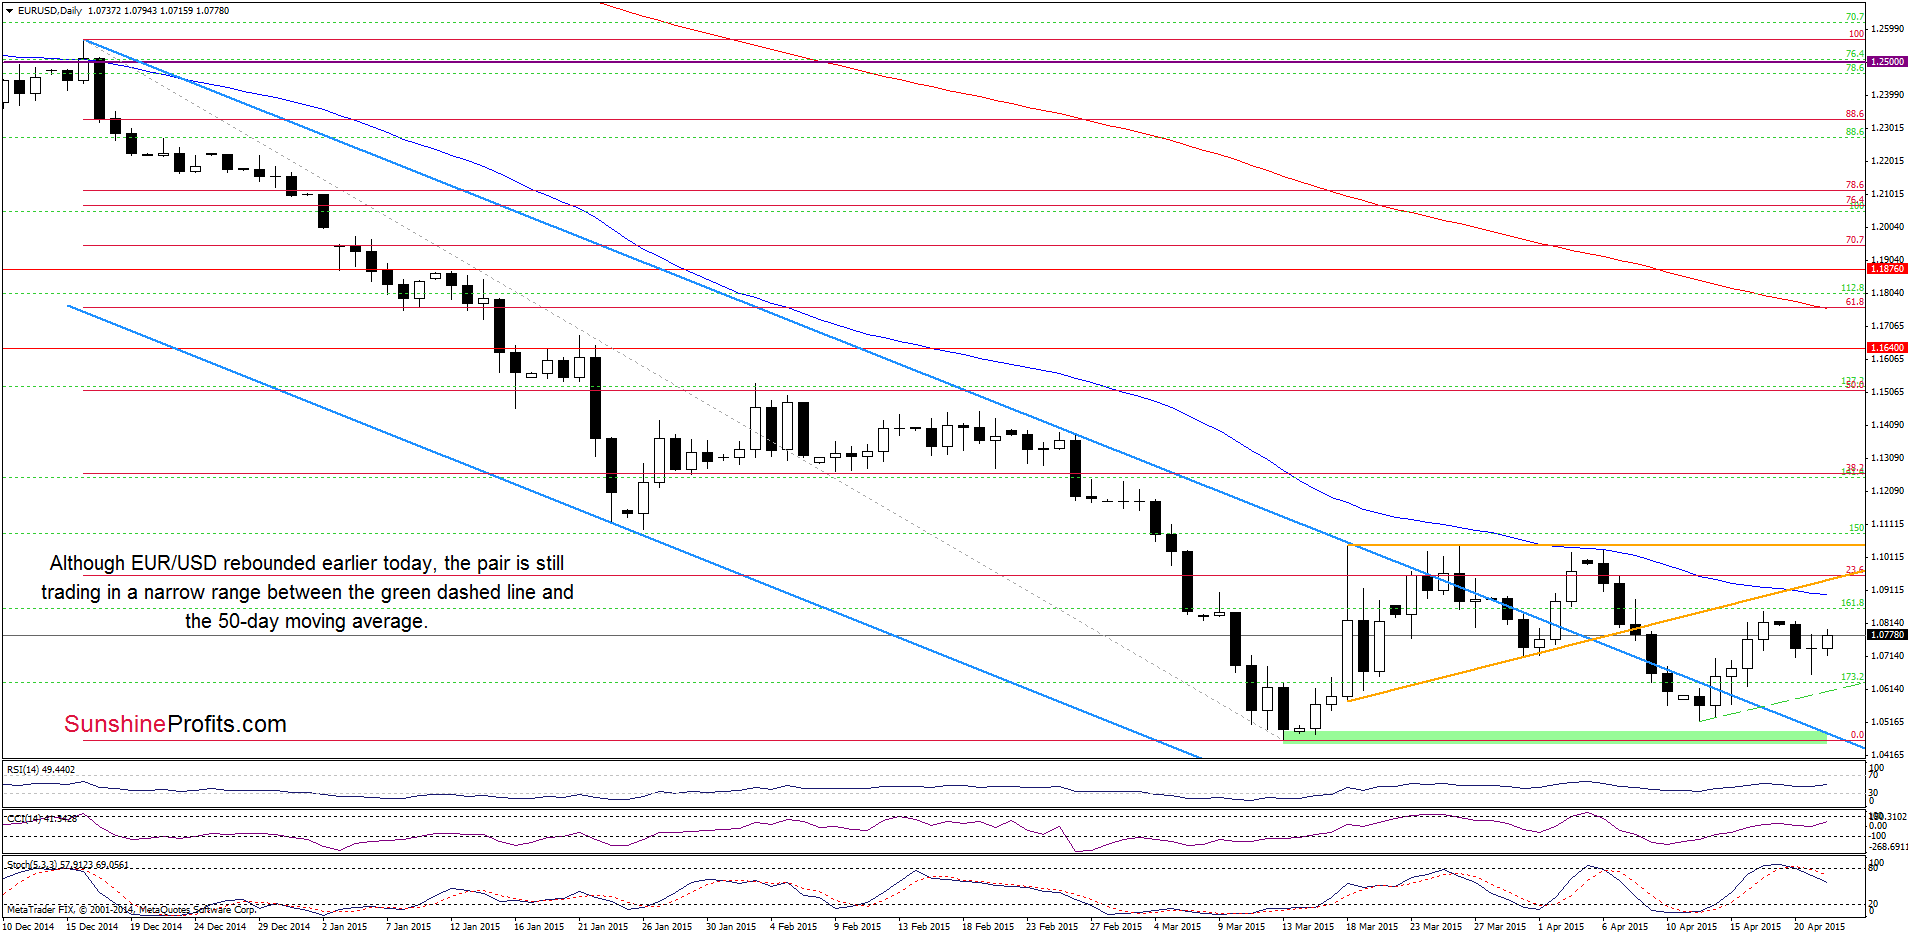
Yesterday, EUR/USD hit an intraday low of 1.0659 and approached the long-term green line. As you see on the charts, this support encouraged currency bulls to act and resulted in a rebound. Despite this upswing, the exchange rate is still trading in a narrow range between the above-mentioned long-term support (in this area is also the green dashed line marked on the daily chart) and the resistance zone created by the 50-day moving average and the orange resistance line. In our opinion, as long as there is no breakout/breakdown, a sizable move is not likely to be seen (please keep in mind that the sell signal generated by the Stochastic Oscillator remains in place, supporting another downswing).
Very short-term outlook: mixed with bearish bias
Short-term outlook: mixed
MT outlook: mixed
LT outlook: mixed
Trading position (short-term; our opinion): No positions are justified from the risk/reward perspective at the moment. We will keep you informed should anything change, or should we see a confirmation/invalidation of the above.
GBP/USD
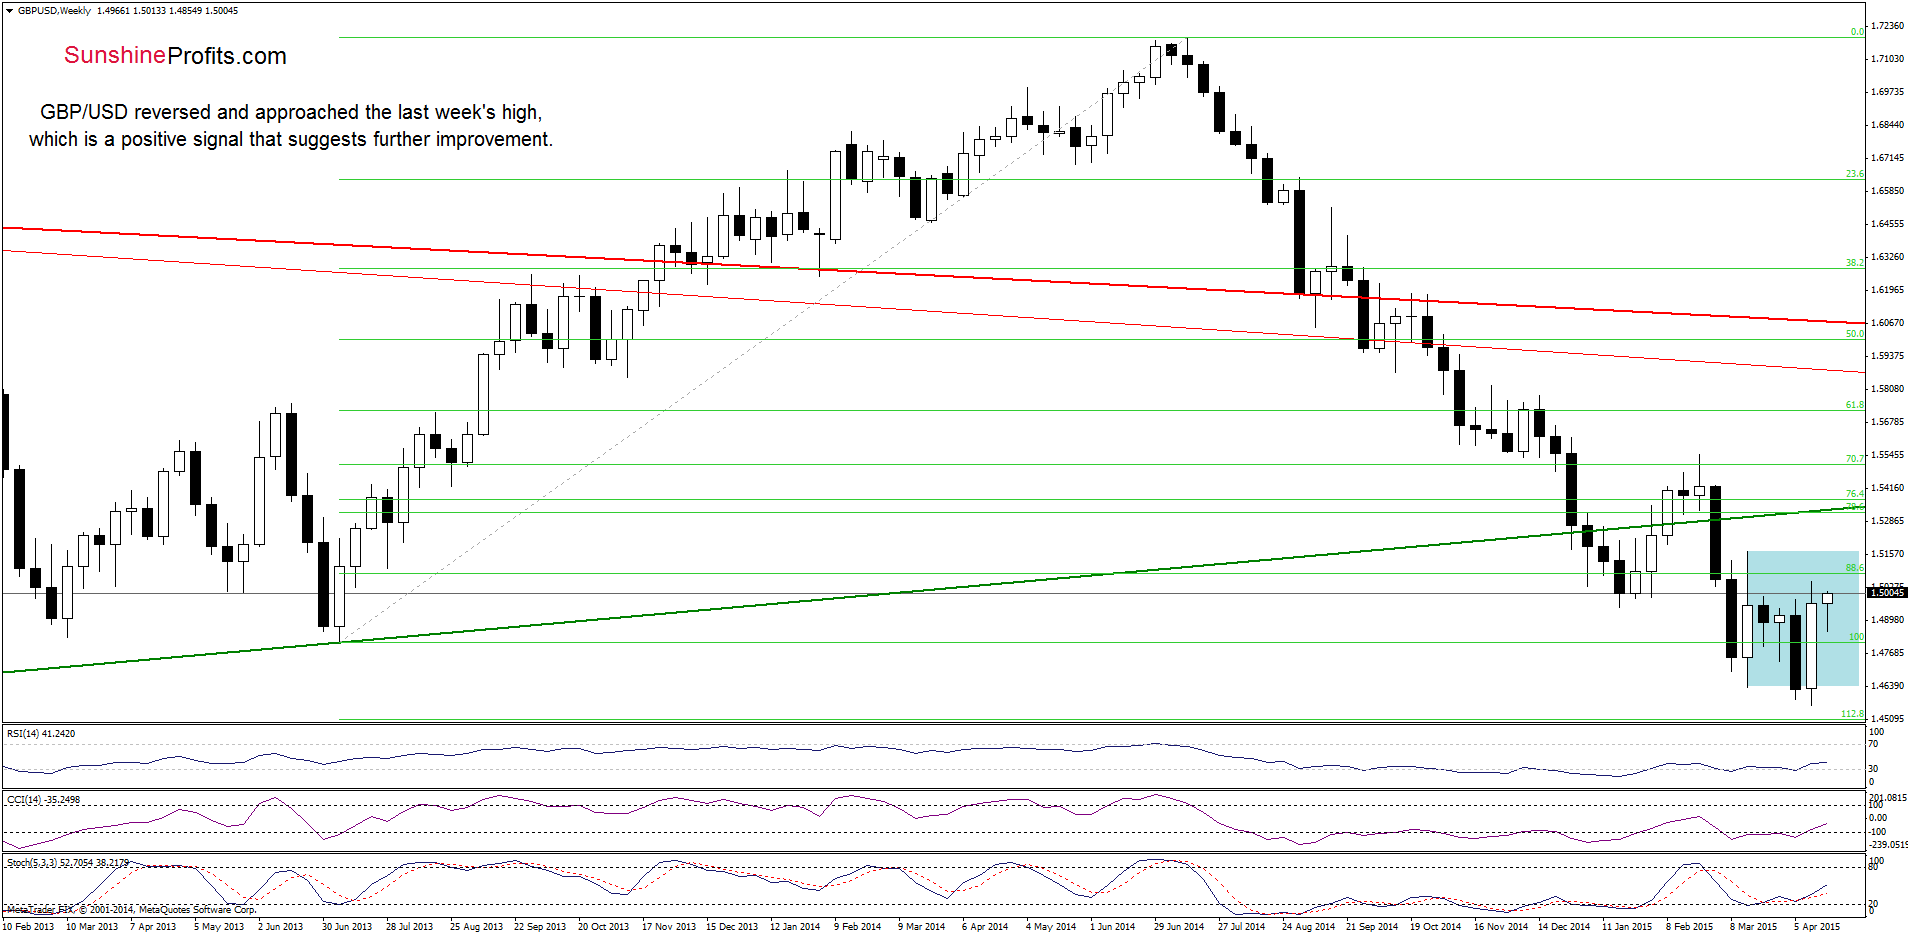
The situation in the medium term hasn’t changed much as GBP/USD is still trading in the consolidation. Nevertheless, the exchange rate reversed and approached the last week’s high, which is a positive signal that suggests further improvement (especially when we take into account the fact that an invalidation of small breakdown under the lower border of the formation and its positive impact on future moves is still in effect).
Can we infer something more from the daily chart? Let’s check.

On Monday, we wrote the following:
(…) currency bulls tried to push the pair above the orange zone. Despite their efforts they failed, which resulted in an invalidation of early small breakout. This negative signal triggered a pullback earlier today, which in combination with the current position of the inicators (the CCI and Stochstic Oscillator generated sell signals) suggests further deterioration in the coming day(s). If ths is the case, and GBP/USD moves lower from here, the initial dowside target would be around 1.4870, where the 38.2% Fibonacci retracement (based on the entire recent rally) is.
From today’s point of view, we see that currency bears pushed GBP/USD lower as we expected and took the pair to our initial downside target. As you see on the daily chart, the 38.2% Fibonacci retracement triggered an upward move, which resulted in an increase to the orange resistance zone. In the previous weeks this area was strong enough to stop further improvement, which suggests that we could see similar price action later in the day. Nevertheless, if currency bulls manage to push the pair higher (and if GBP/USD closes the day above this zone), the initial upside target would be around 1.5153, where the long-term crimson resistance line (based on the Jul and Feb highs) is. At this point it is worth noting that slightly above this line is also another resistance zone created by the 23.6% Fibonacci retracement (based on the entire Jul-Apr orrection), 61.8% retracement (based on the Feb-Apr declines), the Mar 18 and the upper line of the consolidation marked on the weekly chart.
Very short-term outlook: mixed
Short-term outlook: mixed
MT outlook: mixed
LT outlook: mixed
Trading position (short-term; our opinion): No positions are justified from the risk/reward perspective at the moment. We will keep you informed should anything change, or should we see a confirmation/invalidation of the above.
USD/CAD
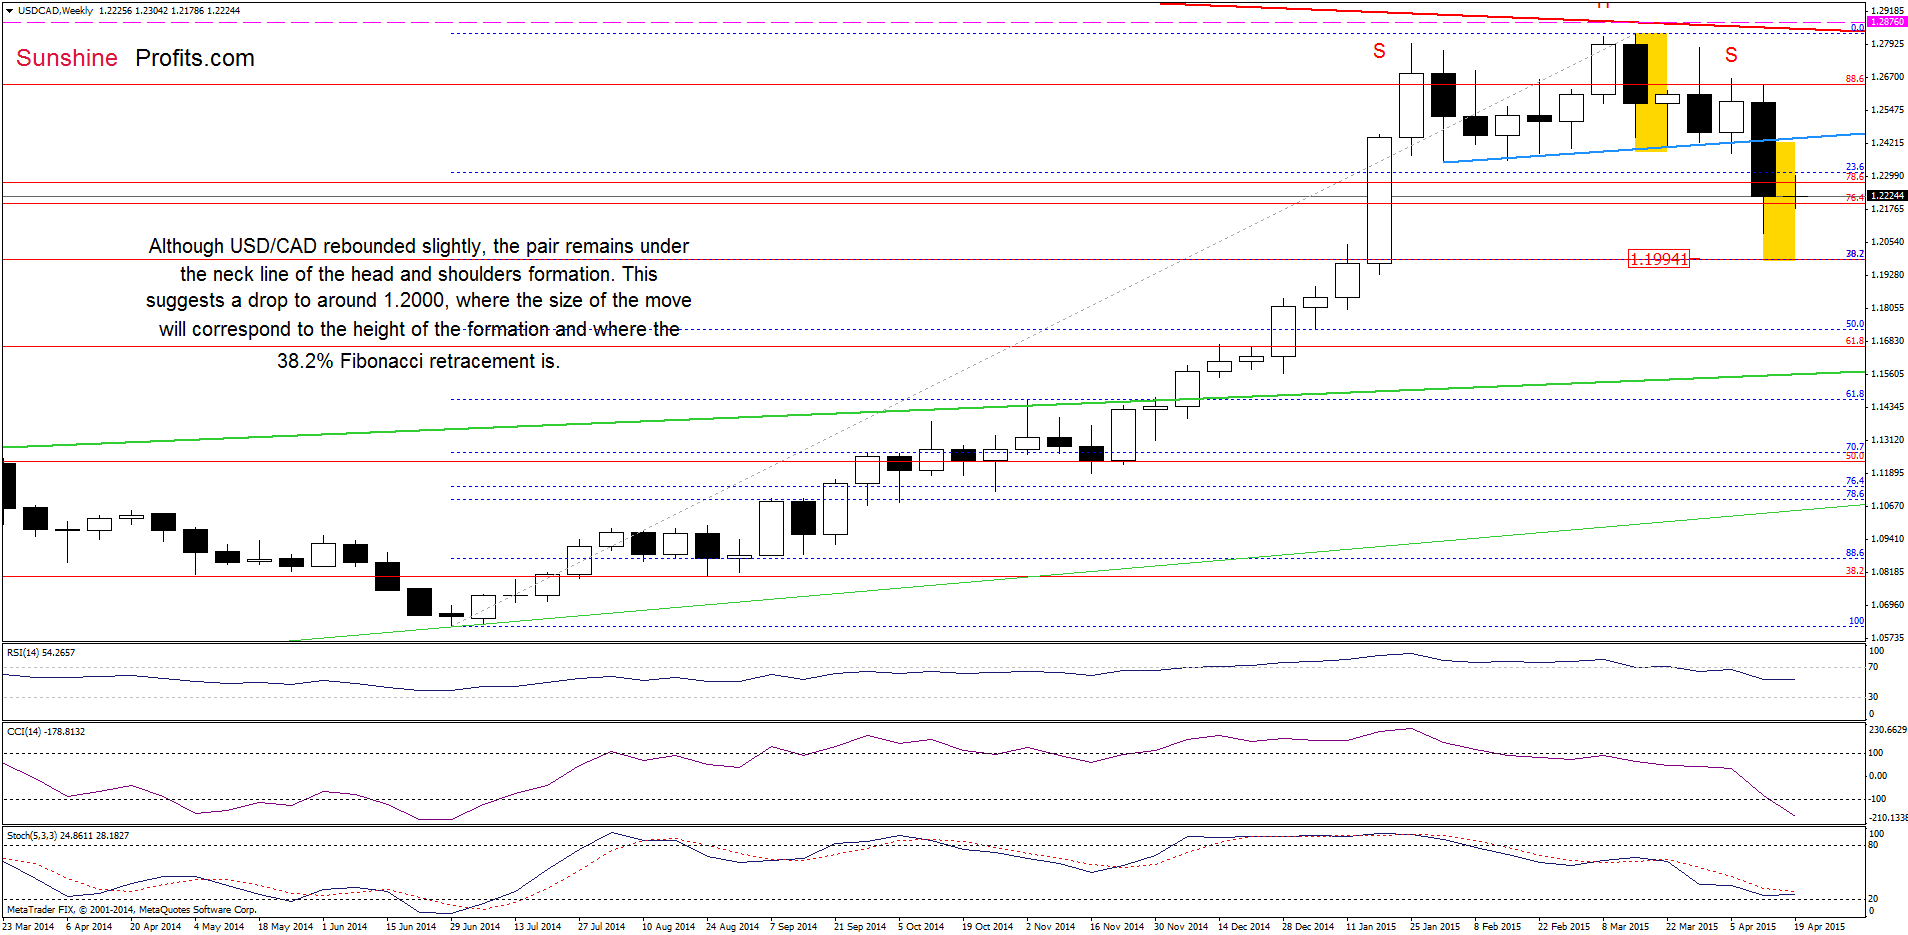
On the weekly chart we see that although USD/CAD rebounded slightly, the pair still remains under the neck line (marked with blue) of the head and shoulders formation. This means that what we wrote on Friday is still valid:
(…) USD/CAD moved sharply lower and broke below the neck line, which suggests further correction and a drop to around 1.2000, where the size of the downward move will correspond to the height of the formation and where the 38.2% Fibonacci retracement level is.
How did this rebound affect the very short-term picture? Let’s find out.
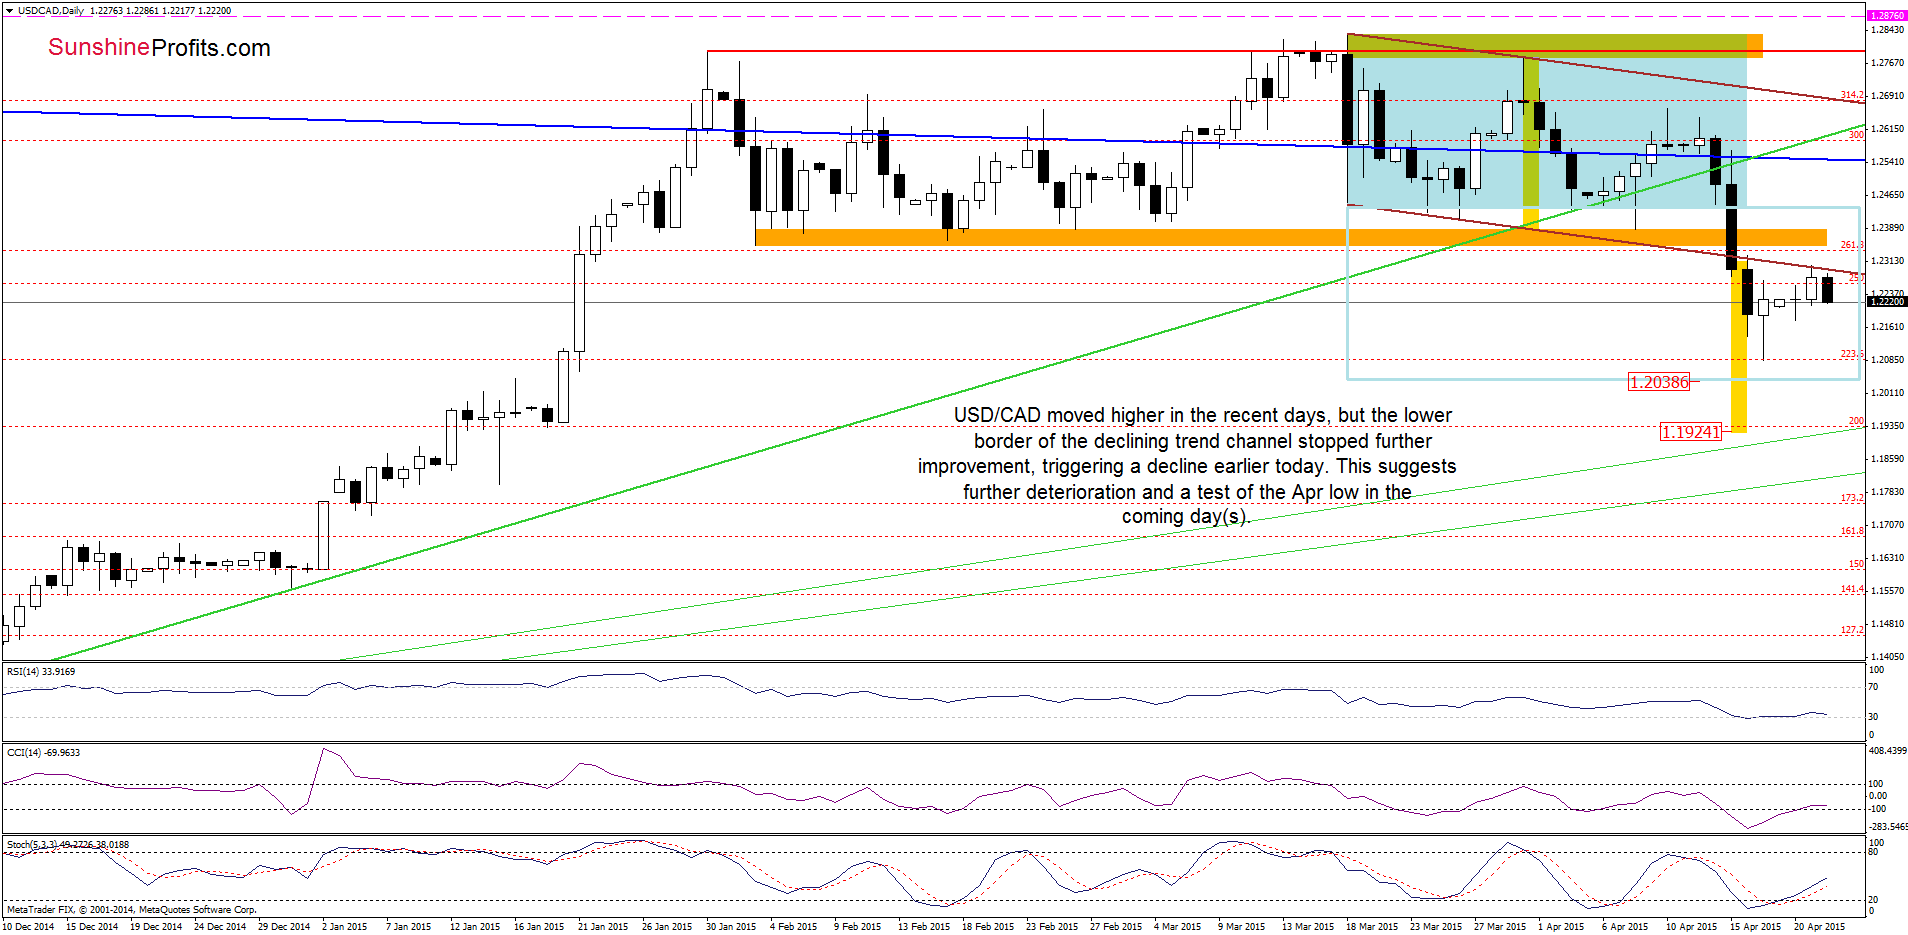
From this perspective, we see that the recent upward move took USD/CAD to the lower border of the declining trend channel. As you see, this strong resistance stopped further improvement and triggered a decline earlier today. This suggests that the last upswing was nothing more than another verification of the breakdown below the lower line of the formation. If this is the case, we’ll see further deterioration and a test of the Apr low of 1.2086 in the coming days. If it is broken, the next downside target for currency bears would be around 1.2040, where the size of the downward move will correspond to the height of the consolidation.
Very short-term outlook: bearish
Short-term outlook: bearish
MT outlook: bearish
LT outlook: mixed
Trading position (short-term; our opinion): Short positions (which are already profitable) with a stop loss order at 1.2876 are still justified from the risk/reward perspective. We will keep you informed should anything change, or should we see a confirmation/invalidation of the above.
Thank you.
Nadia Simmons
Forex & Oil Trading Strategist
Przemyslaw Radomski, CFA
Founder, Editor-in-chief
Gold & Silver Trading Alerts
Forex Trading Alerts
Oil Investment Updates
Oil Trading Alerts

