
On Friday, market research firm Markit showed that its U.K. manufacturing PMI dropped to 52.5 in December missing analysts’ expectations for an increase to 53.6, which pushed GBP/USD sharply lower. Earlier today, the data showed that Markit’s U.K. construction purchasing managers' index dropped to 57.6 in the previous month from a reading of 59.4 in November, which watered down the pair as well. In this way, the exchange rate reached two important support lines. Will they withstand the selling pressure in the coming days?
In our opinion the following forex trading positions are justified - summary:
EUR/USD
In our Forex Trading Alert posted on Friday, we wrote the following:
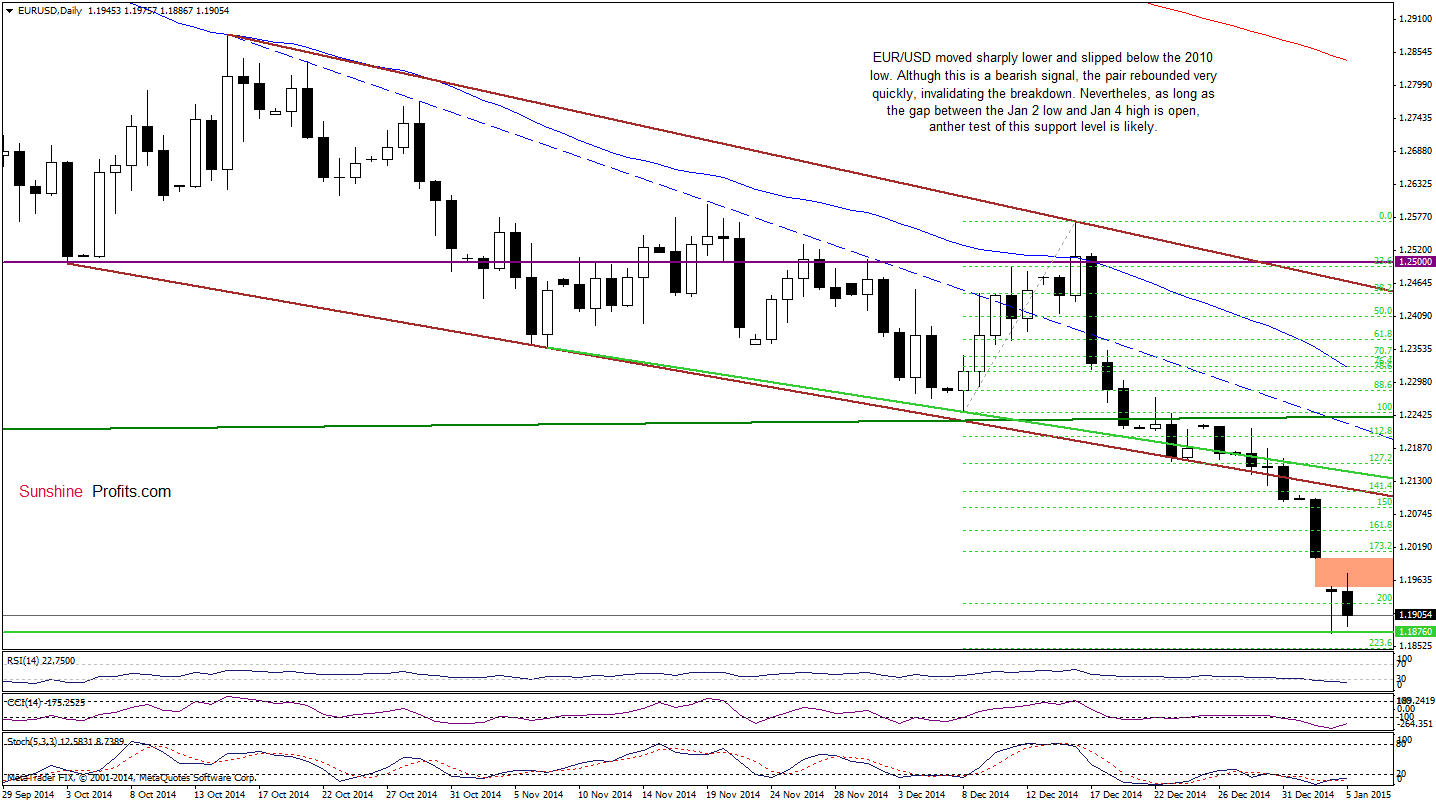
(…) the exchange rate declined below the 161.8% Fibonacci extension and the 2012 low. Although this is a bearish signal, which suggests further deterioration, the breakdown is not confirmed. However, if the pair closes the day below these levels, we could see further deterioration and a drop to the next Fibonacci extensions (173.2% at 1.2010, 200% at 1.1924) or even to the above-mentioned 2010 low of 1.1876 in the coming days.
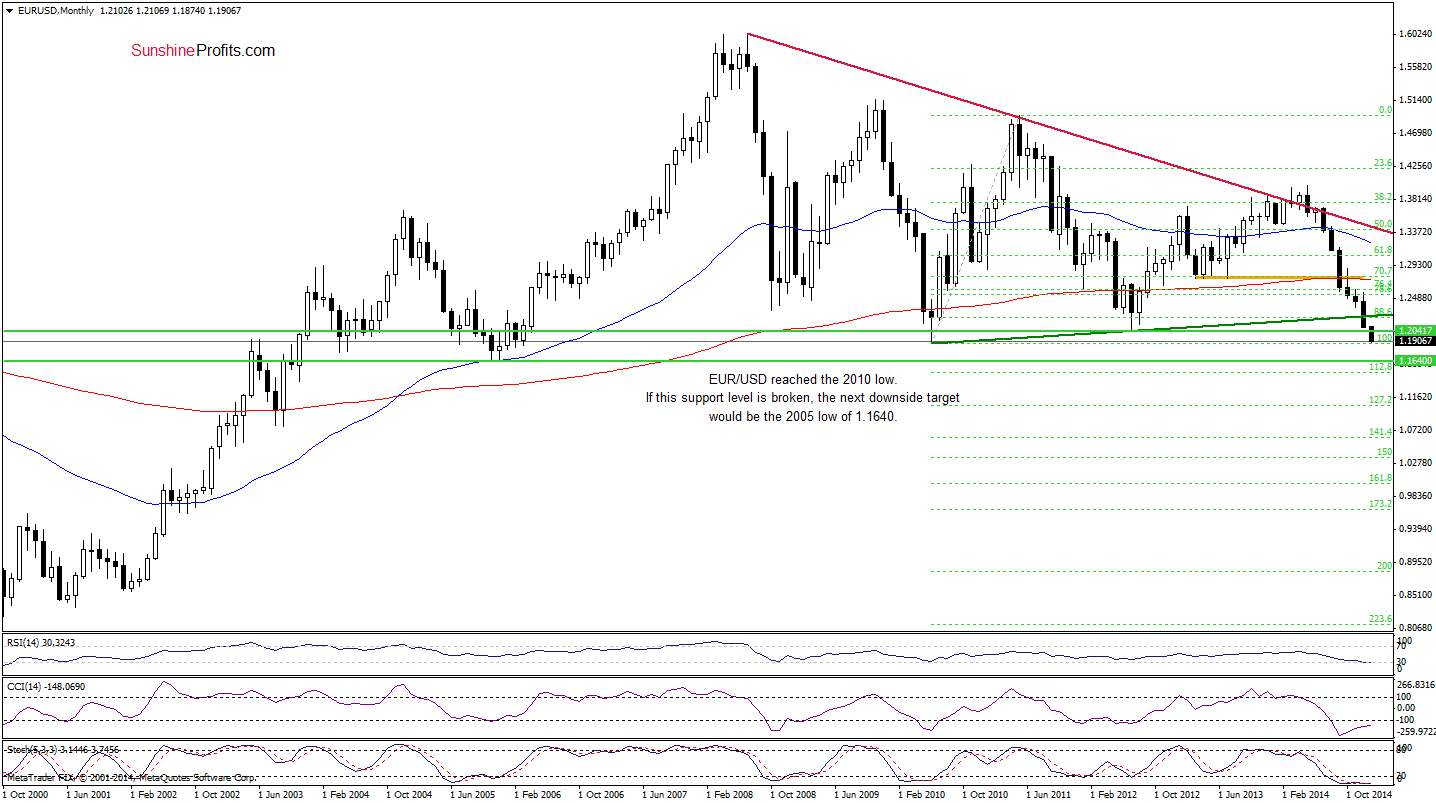
Looking at the charts, we see that the situation developed in tune with the above-mentioned scenario as EUR/USD extended losses and dropped to our downside target earlier today. As you see on the daily chart, the exchange rate slipped below the 2010 low, but the pair reversed very quickly, invalidating this small breakdown. Although this is a positive signal, we should keep in mind that as long as the gap between the Jan 2 low and the Jan 4 high is open, another test of this very important support level is likely. Why this support is so important? When we take a closer look at the monthly chart, we see that if this area is broken, the next downside target would be around 1.1640, where the 2005 low is.
Very short-term outlook: bearish
Short-term outlook: mixed
MT outlook: mixed
LT outlook: bearish
Trading position (short-term): In our opinion, no positions are justified from the risk/reward perspective at the moment. We will keep you informed should anything change, or should we see a confirmation/invalidation of the above.
GBP/USD
Quoting our last commentary on this currency pair:
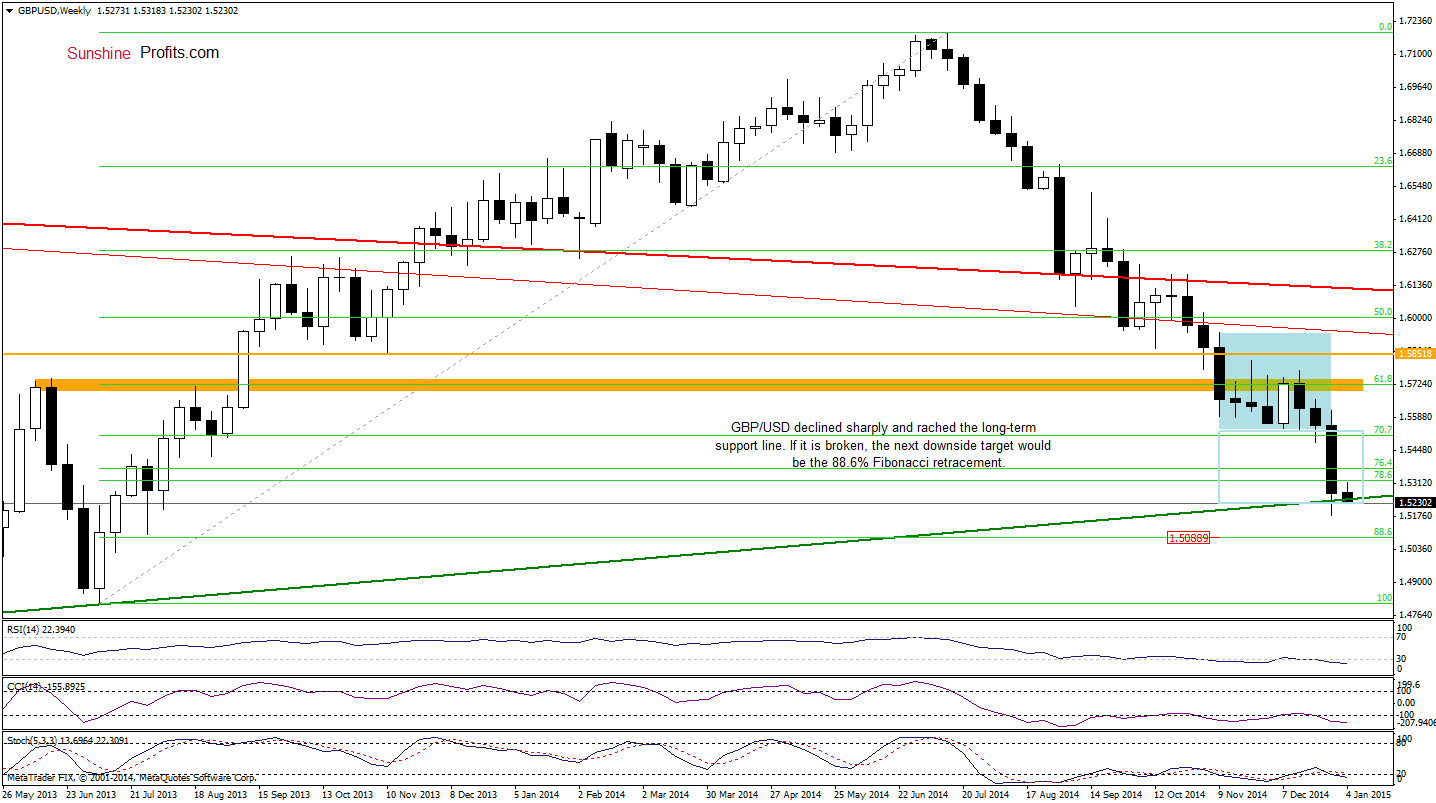
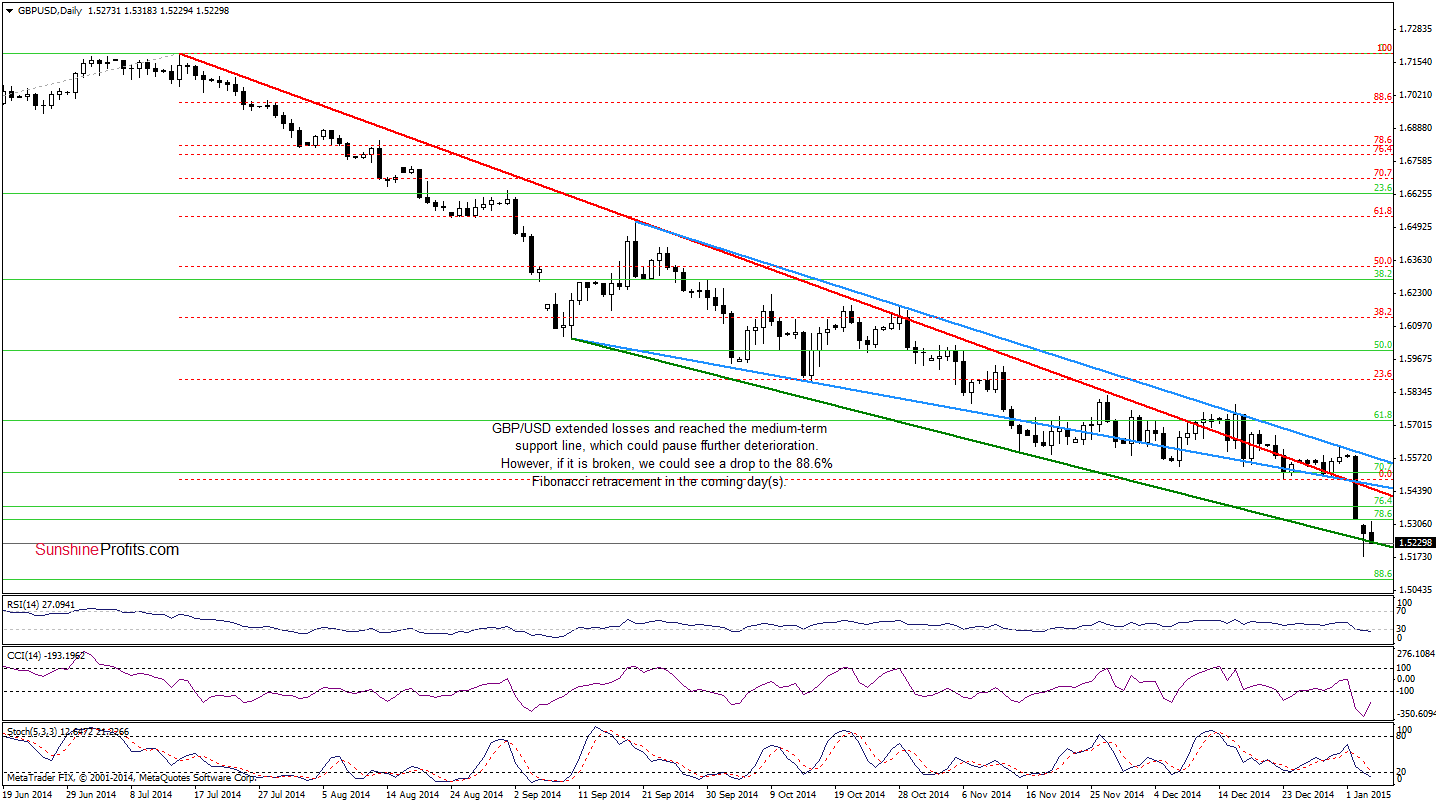
The first thing that catches the eye on the above chart is a breakdown below the lower border of the declining wedge and an invalidation of the breakout above the red declining line. (…) Taking into account the current position of the indicators, we think that the pair will move lower and test the lower border of the support zone (the 78.6% Fibonacci retracement at 1.5326) in the coming days. What could happen if GBP/USD breaks below this support area? (…) we could see a droop even to around 1.5251, where the long-term green support line is (at this point, it’s worth noting that in this area the size of the downward move will correspond to the height of the consolidation).
As you see on the charts, currency bears not only pushed the pair below the 78.6% Fibonacci retracement, but also took GBP/USD to the long-term green support line. At this point, it’s worth noting that this area is also supported by the medium-term support line based on the Sep 10 and Nov 14 lows. Therefore, if they withstand the selling pressure, we’ll see a rebound from here and an increase to the previously-broken declining red resistance line (currently around 1.5450). However, if the pair drops lower, it would be a strong bearish signal, which could push GBP/USD to (at least) the 88.6% Fibonacci retracement (at 1.5089). Taking all the above into account, we think that the most important event, which could affect future moves will be today’s closing price because if we see a daily close under these lines, the probability of further declines will increase.
Very short-term outlook: mixed
Short-term outlook: mixed
MT outlook: mixed
LT outlook: mixed
Trading position (short-term): In our opinion, no positions are justified from the risk/reward perspective at the moment. We will keep you informed should anything change, or should we see a confirmation/invalidation of the above.
USD/JPY
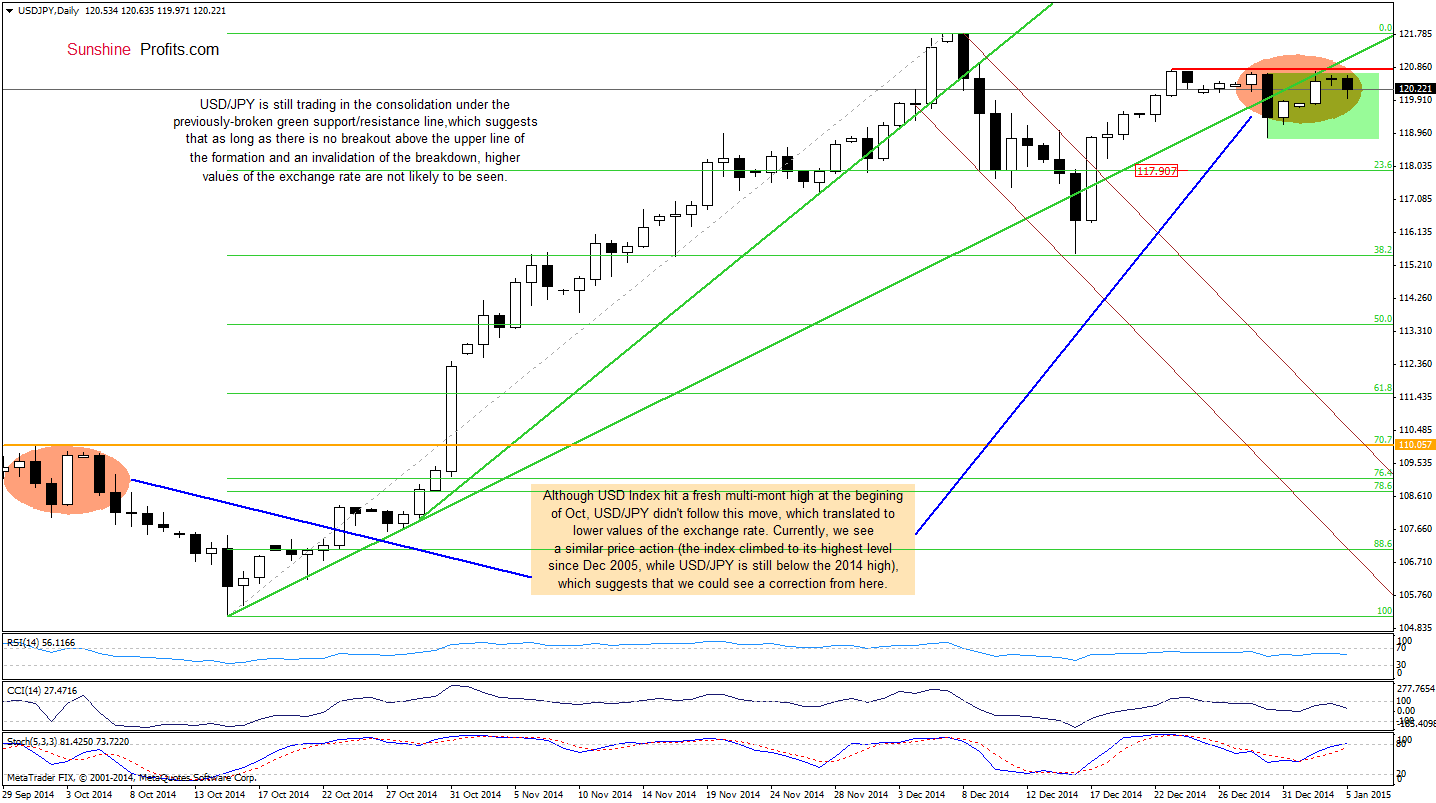
Looking at the daily chart, we see that although USD/JPY moved higher on Friday (and also earlier today), the previously-broken green support/resistance line still keeps gains in check. Therefore, what we wrote in our previous Forex Trading Alert is up-to-date:
(…) If currency bulls manage to push the pair higher and invalidate the breakdown it would be a strong positive signal, which could trigger further improvement and a test of the Dec high. Nevertheless, as long as there is no such price action, we should consider a bearish scenario. In this case, today’s upswing is a verification of the breakdown below the green support/resistance line, which will translate to lower values of USD/JPY in the coming days. In our opinion, this scenario will be more likely, if the pair drops under the lower border of the consolidation (marked with green) at 118.85. If we see such drop, the initial downside target would be around 117.90, where the 23.6% Fibonacci retracement (based on the entire Oct-Dec rally) is.
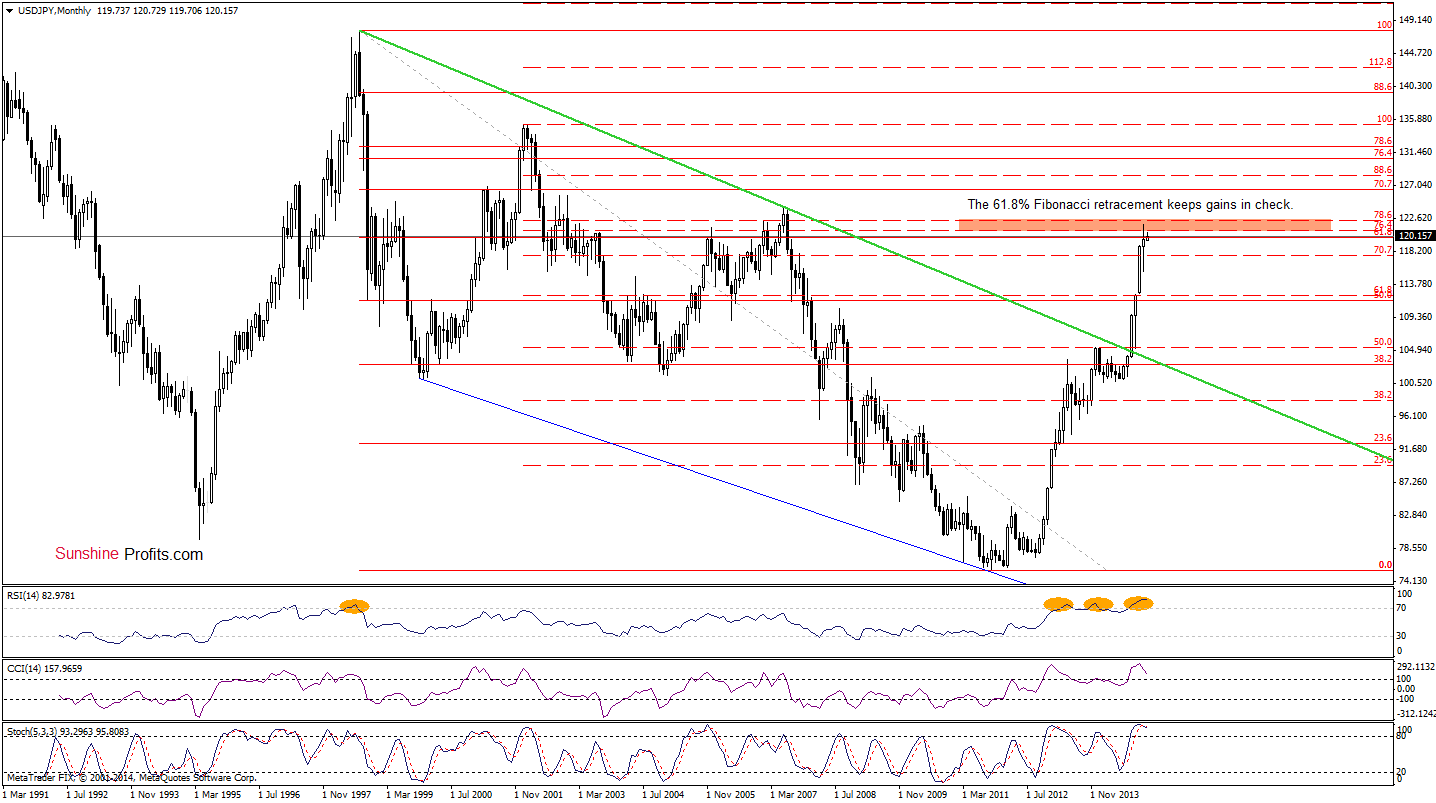
Before we summarize the current outlook of USD/JPY, we would like to draw your attention to two important facts. Firstly, the pair is still trading under the 61.8% Fibonacci retracement (based on the entire 1998-2011 declines), which successfully supports the resistance area marked on the daily chart. Secondly, although the USD Index hit fresh multi-year highs in the recent days, USD/JPY didn’t follow this move and still remains under the 2014 high. We saw similar price action at the beginning of Oct (marked with orange). Back then, such lack of a new high translated to lower values of the exchange rate. Therefore, we think that we could see a correction from here in the coming days (especially if the pair drops under 118.85).
Very short-term outlook: mixed with bearish bias
Short-term outlook: mixed with bearish bias
MT outlook: mixed
LT outlook: bullish
Trading position (short-term; our opinion): No positions are justified from the risk/reward perspective at the moment. We will keep you informed should anything change, or should we see a confirmation/invalidation of the above.
On an administrative note, there will be no regular Forex Trading Alert tomorrow - we will post the next one on Wednesday. Thank you for understanding.
Thank you.
Nadia Simmons
Forex & Oil Trading Strategist
Przemyslaw Radomski, CFA
Founder, Editor-in-chief
Gold & Silver Trading Alerts
Forex Trading Alerts
Oil Investment Updates
Oil Trading Alerts

