
Although the Institute of Supply Management showed that its manufacturing purchasing managers' index fell to a five-month low of 55.5 this month, the USD Index (which tracks the U.S. dollar’s value against a basket of other currencies) surged to its highest level since Dec 2005 on expectations that the Federal Reserve will raise interest rates this year. How did this rally affect the short-term picture of currency pairs?
In our opinion the following forex trading positions are justified - summary:
EUR/USD
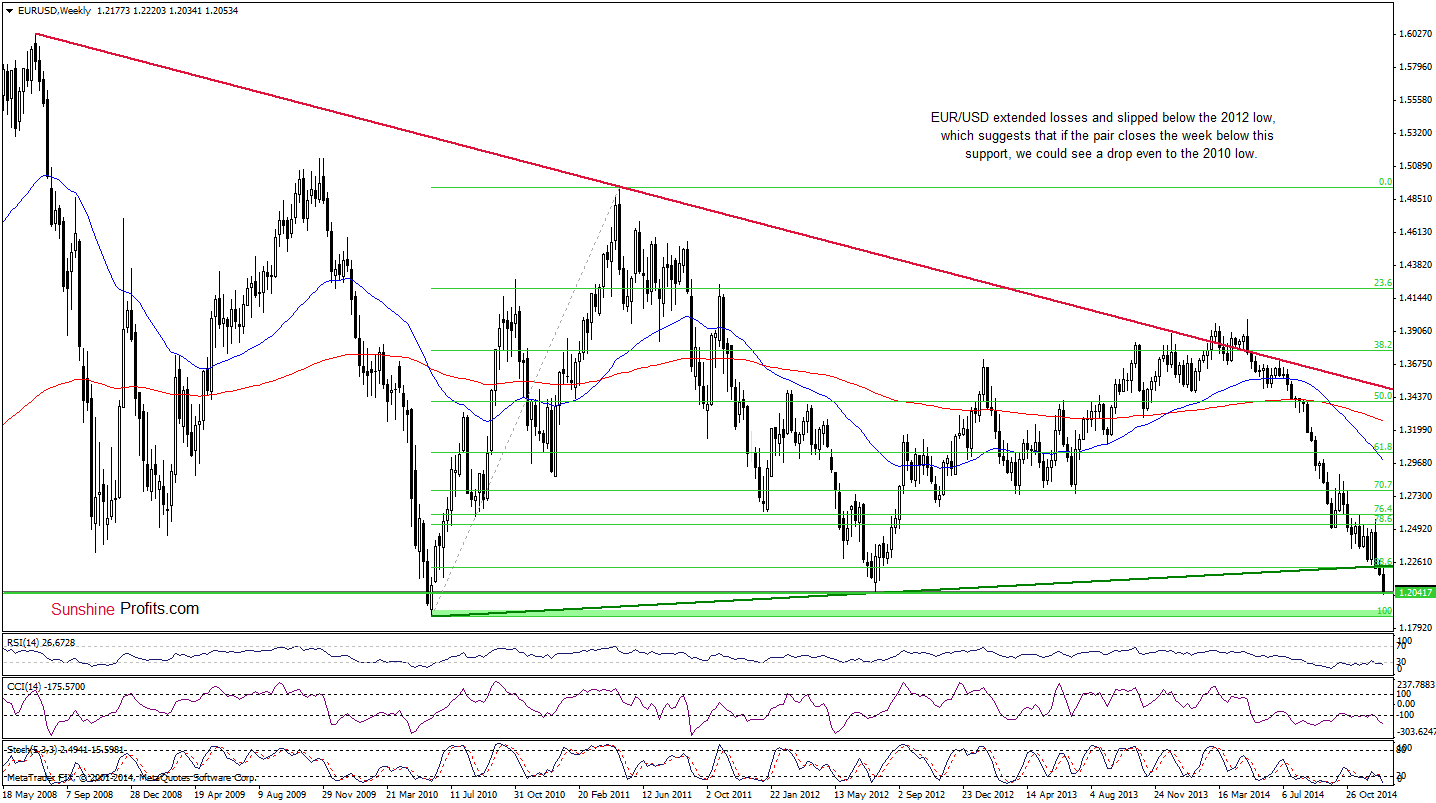
The situation in the medium-term has deteriorated slightly as EUR/USD moved lower and broke below the 2012 low. This is a strong bearish signal, which suggests that if the pair closes the week below this support, we could see a drop even to around the 2010 low.
Will the very short-term picture give us more clues about future moves?
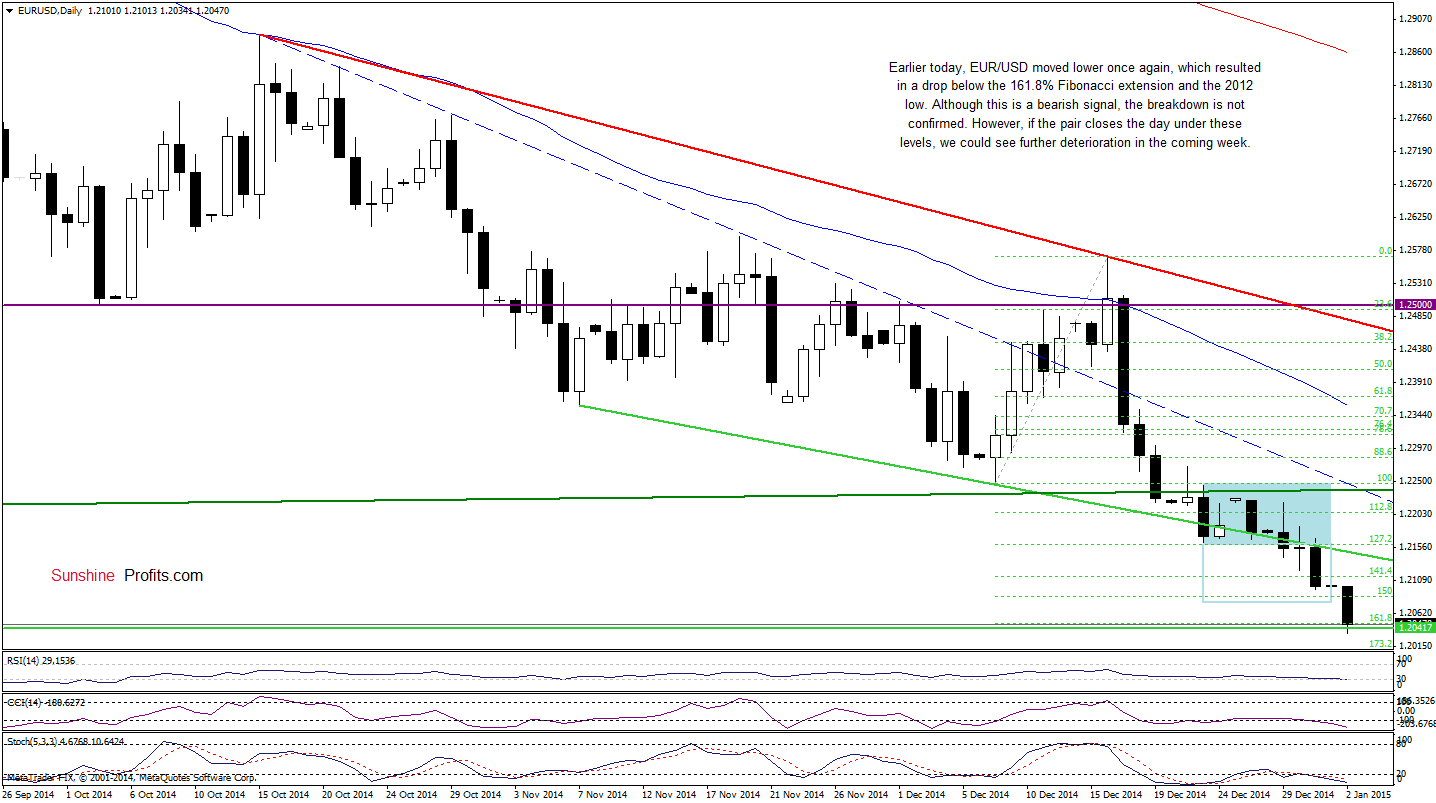
In our Forex Trading Alert posted on Tuesday, we wrote the following:
(…) EUR/USD extended declines and dropped below the lower border of the consolidation and the green support line (based on the Nov 7 and Dec 8 lows). This is a bearish signal, which suggests further deterioration and a pullback to around 1.2080, where the size of the downswing will correspond to the height of the consolidation (this area is also supported by the 150% Fibonacci extension based on the Dec 8-Dec 16 rally).
As you see on the daily chart, currency bears not only realized the above-mentioned scenario, but also managed to push the pair to a fresh multi-year low earlier today. With this downward move, the exchange rate declined below the 161.8% Fibonacci extension and the 2012 low. Although this is a bearish signal, which suggests further deterioration, the breakdown is not confirmed. However, if the pair closes the day below these levels, we could see further deterioration and a drop to the next Fibonacci extensions (173.2% at 1.2010, 200% at 1.1924) or even to the above-mentioned 2010 low of 1.1876 in the coming days.
Very short-term outlook: bearish
Short-term outlook: mixed
MT outlook: mixed
LT outlook: bearish
Trading position (short-term): In our opinion, no positions are justified from the risk/reward perspective at the moment. We will keep you informed should anything change, or should we see a confirmation/invalidation of the above.
GBP/USD
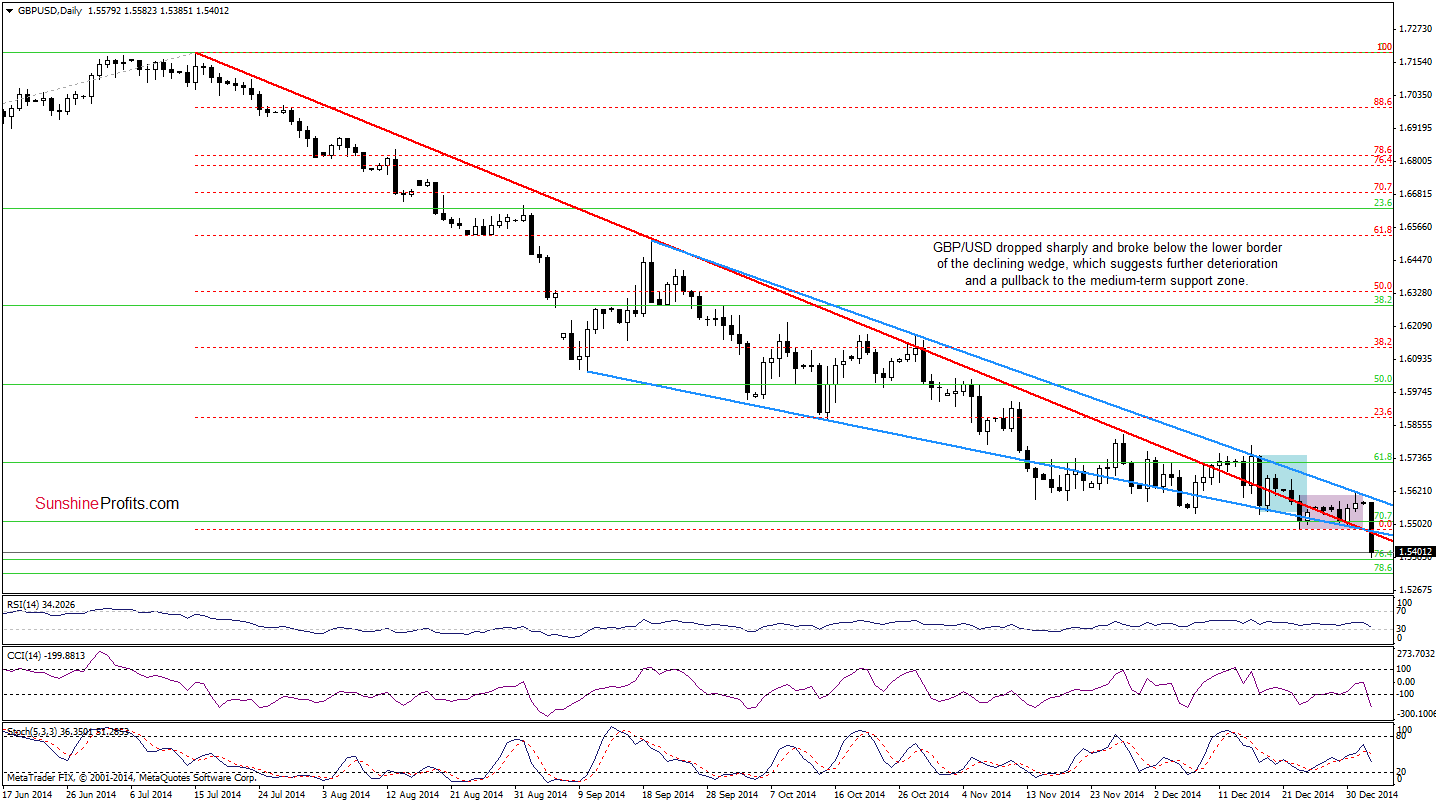
Quoting our last commentary on this currency pair:
(…) we think that as long as the exchange rate is trading in a consolidation (marked with purple) inside of the declining wedge a sizable upward/downward move is not likely to be seen. In our opinion, if currency bulls (…) fail, and the pair drops lower, GBP/USD could decline to around 1.5326-1.5376, where the support zone created by the 76.4% and 78.6% Fibonacci retracement levels (based on the entire Jul 2013-Jul 2014 rally) is.
The first thing that catches the eye on the above chart is a breakdown below the lower border of the declining wedge and an invalidation of the breakout above the red declining line. This strong bearish signals triggered a sharp decline, which approached the exchange rate to our downside target earlier today. Taking into account the current position of the indicators we think that the pair will move lower and test the lower border of the support zone (the 78.6% Fibonacci retracement at 1.5326) in the coming days. What could happen if GBP/USD breaks below this support area? We think that the best answer to this question will be the medium-term picture.
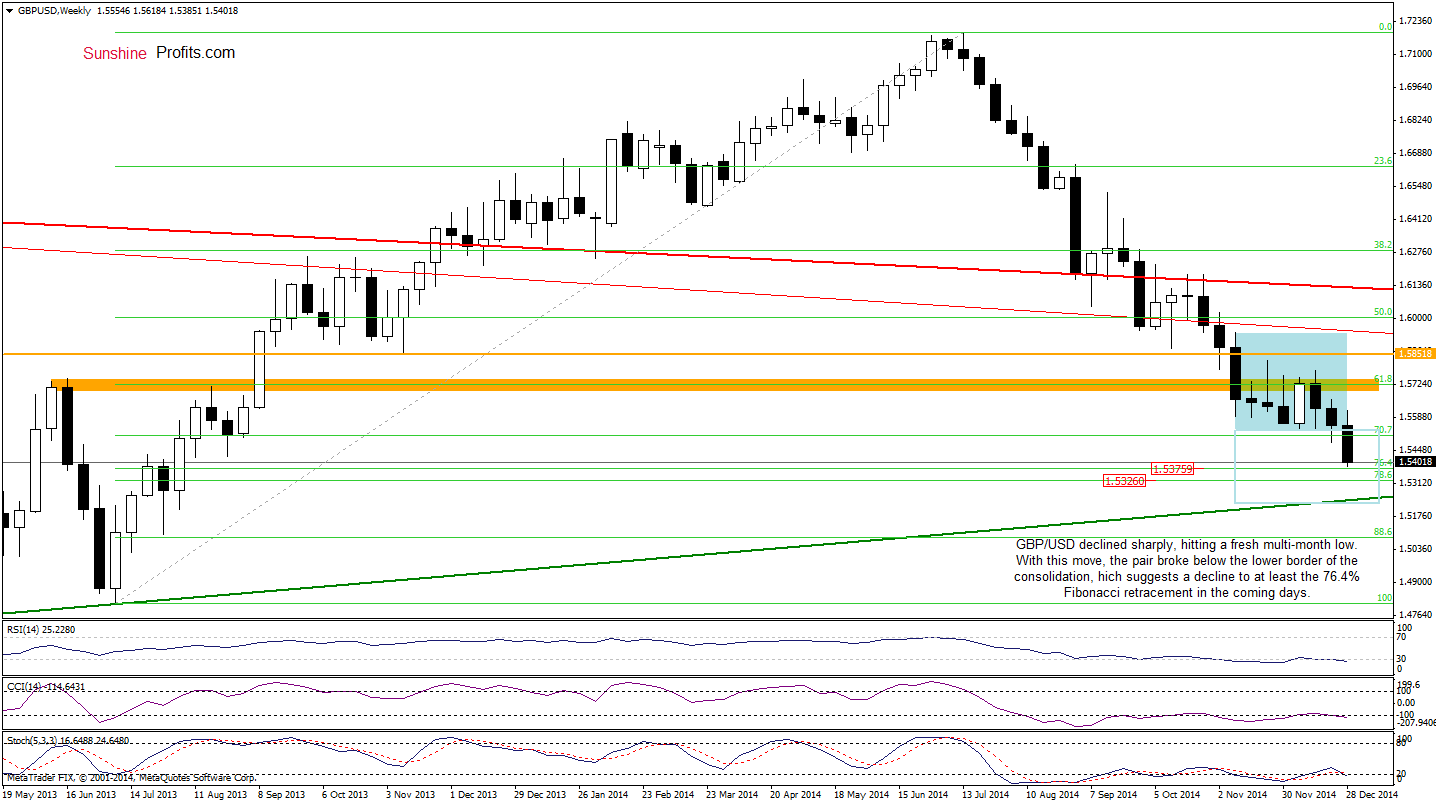
Quoting our last commentary on this currency pair:
(…) GBP/USD is still trading in the consolidation under the previously-broken 61.8% Fibonacci retracement and the orange resistance zone. Taking this fact into account, we believe that a breakout above the upper line of the formation (or a breakdown below the 70.7% Fibonacci retracement) will show us the direction of future moves.
From this perspective, we see that GBP/USD moved sharply lower, breaking not only below the recent lows, but also under the lower border of the consolidation. This is a bearish signal, which suggests that we could see a droop even to around 1.5251, where the long-term green support line is (at this point, it’s worth noting that in this area the size of the downward move will correspond to the height of the consolidation).
Very short-term outlook: bearish
Short-term outlook: mixed with bearish bias
MT outlook: mixed
LT outlook: mixed
Trading position (short-term): In our opinion, no positions are justified from the risk/reward perspective at the moment. We will keep you informed should anything change, or should we see a confirmation/invalidation of the above.
USD/JPY
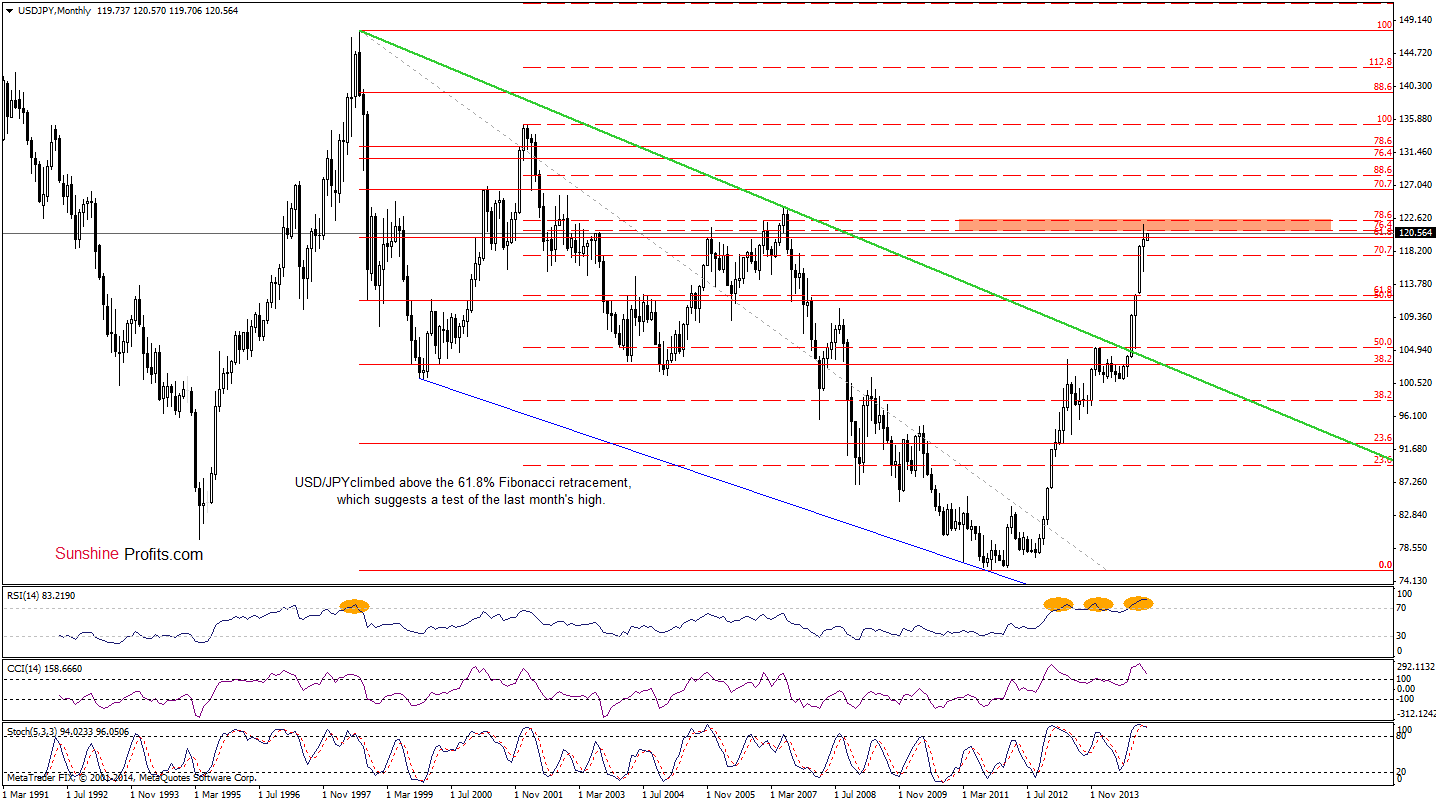
The medium-term picture has improved slightly as USD/JPY climbed above the 61.8% Fibonacci retracement, which suggests that we could see a test of the last month’s high and the orange resistance zone in the coming week(s).
Are there any short-term resistances that could hinder the realization of the above-mentioned scenario? Let’s check.
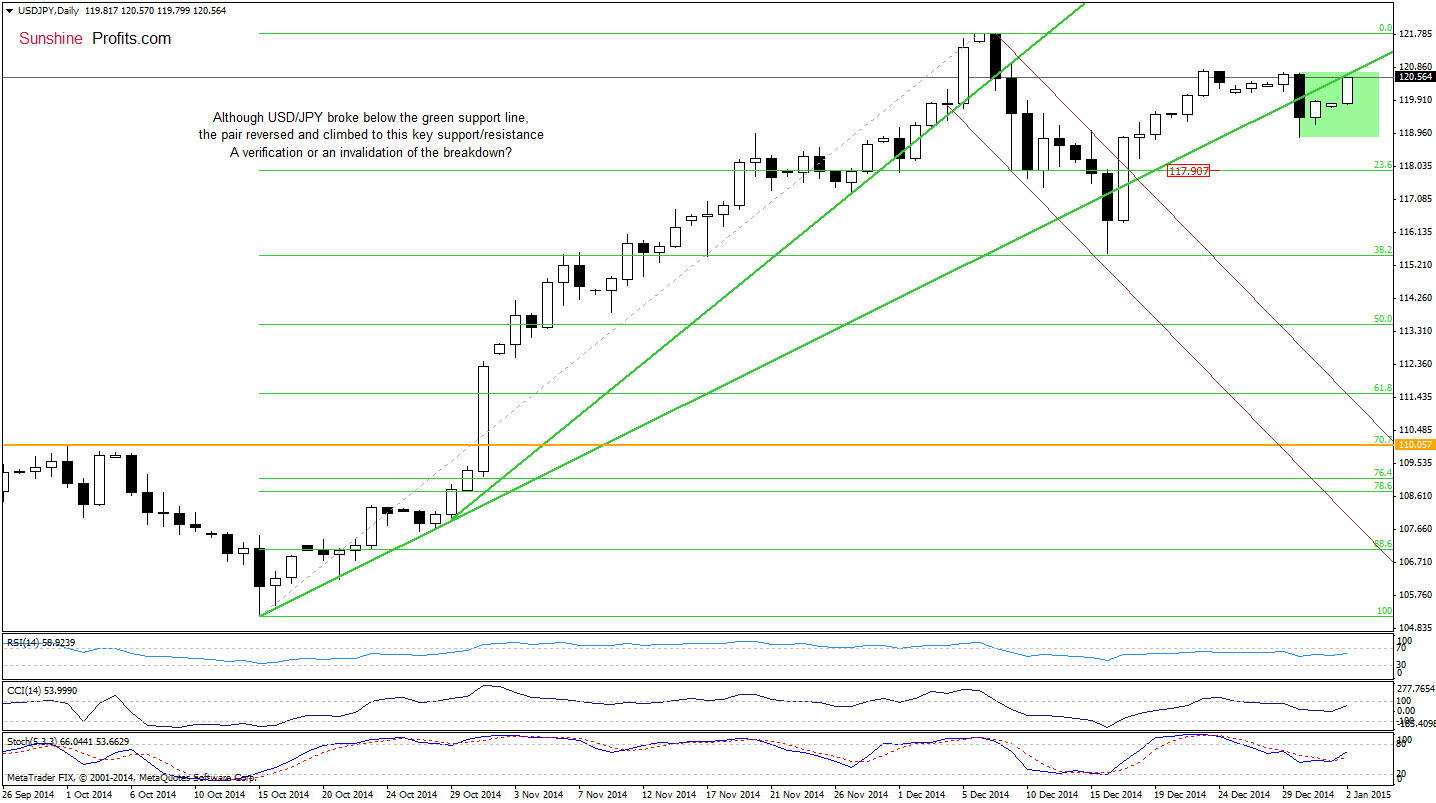
Looking at the above charts, we see that although USD/JPY moved higher earlier today, the previously-broken green support/resistance line still keeps gains in check. What’s next? If currency bulls manage to push the pair higher and invalidate the breakdown it would be a strong positive signal, which could trigger further improvement and a test of the Dec high. Nevertheless, as long as there is no such price action, we should consider a bearish scenario. In this case, today’s upswing is a verification of the breakdown below the green support/resistance line, which will translate to lower values of USD/JPY in the coming days. In our opinion, this scenario will be more likely, if the pair drops under the lower border of the consolidation (marked with green) at 118.85. If we see such drop, the initial downside target would be around 117.90, where the 23.6% Fibonacci retracement (based on the entire Oct-Dec rally) is.
Very short-term outlook: mixed with bearish bias
Short-term outlook: mixed with bearish bias
MT outlook: mixed
LT outlook: bullish
Trading position (short-term; our opinion): No positions are justified from the risk/reward perspective at the moment. We will keep you informed should anything change, or should we see a confirmation/invalidation of the above.
USD/CAD
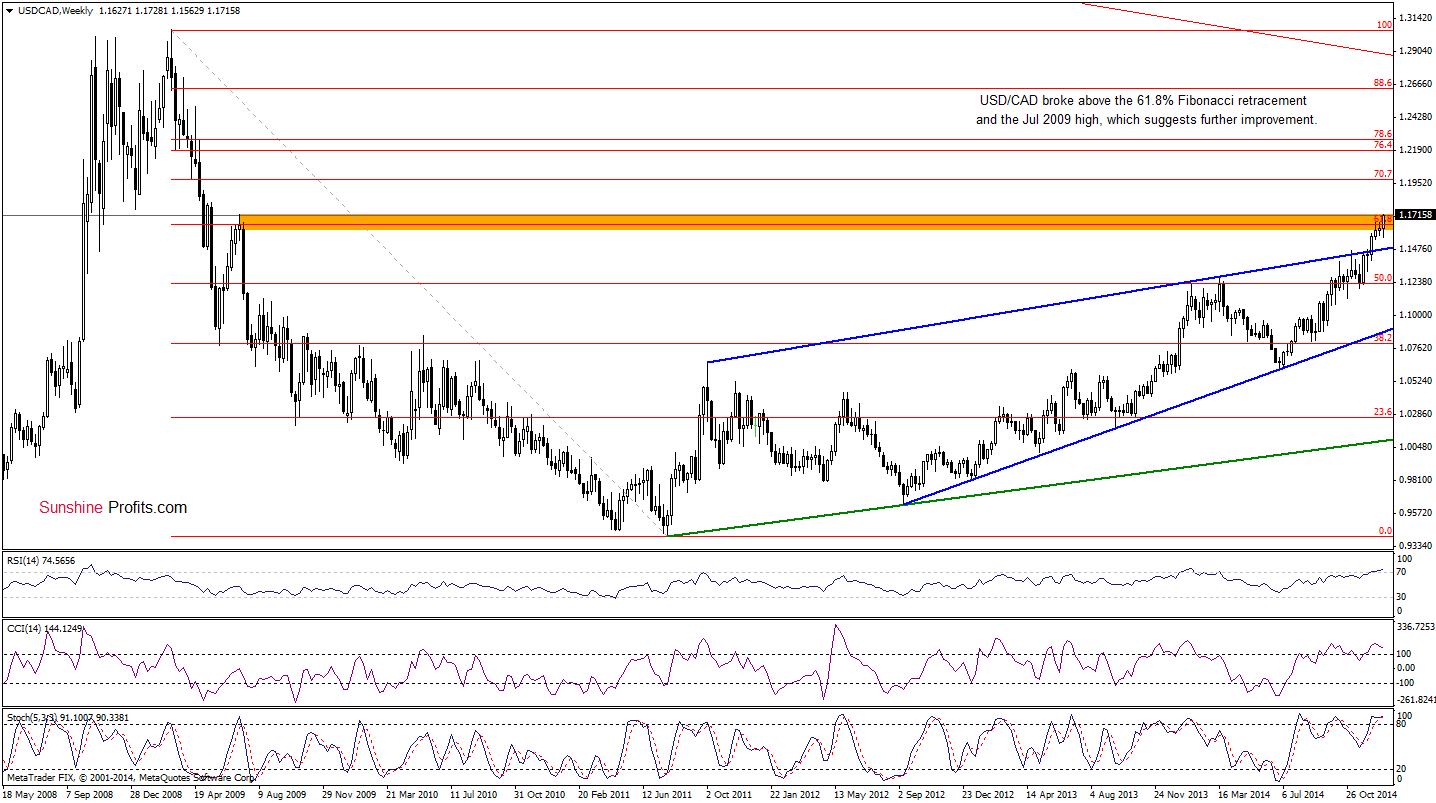
The situation in the medium term has improved slightly as USD/CAD broke above the recent high, the 61.8% Fibonacci retracement and the Jul 2009 high, which suggests further improvement. How high could the pair go? Let’s examine the daily chart and find out.
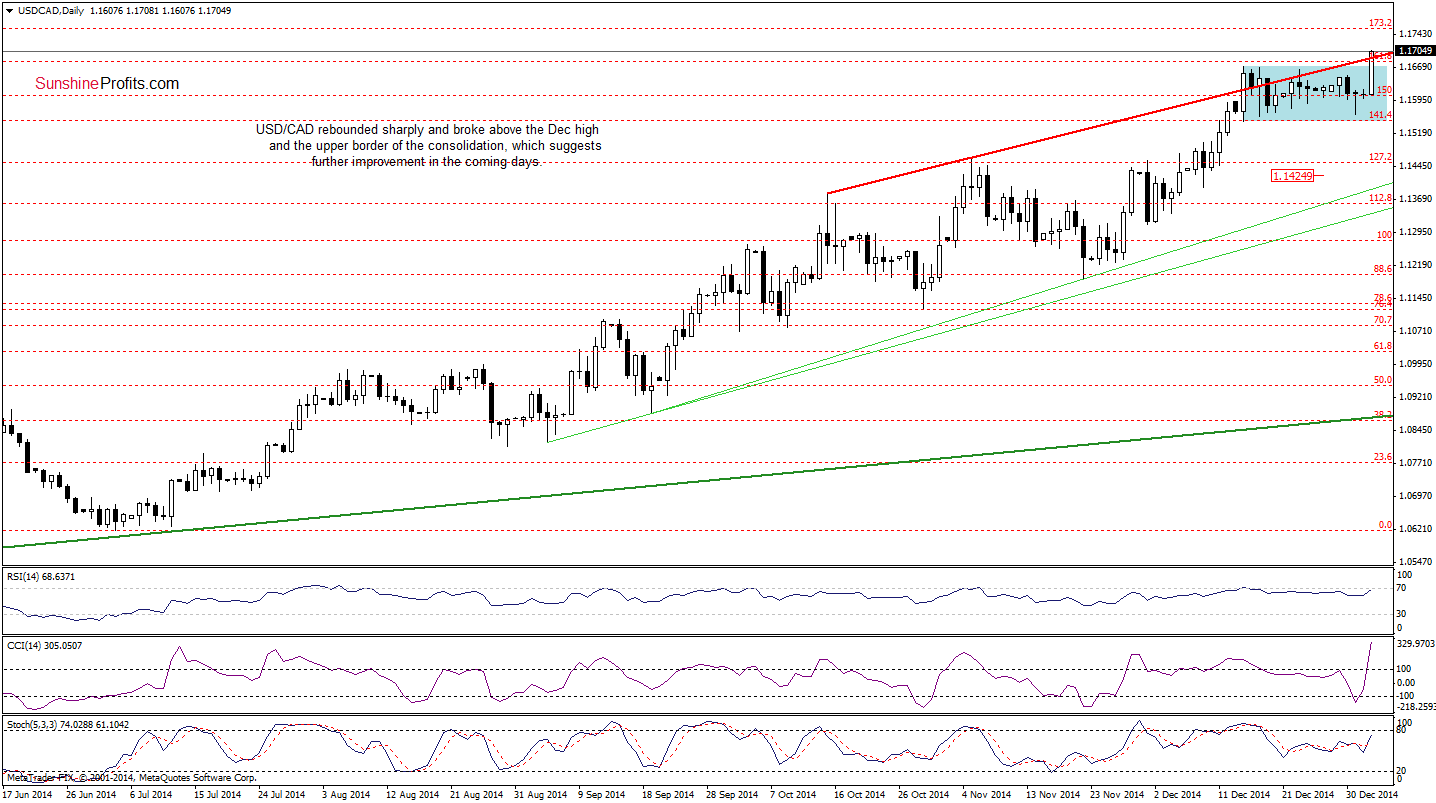
From this perspective, we see that USD/CAD moved sharply higher, breaking not only above the Dec highs, but also above the upper line of the consolidation (marked with blue). With today’s upswing the exchange rate also broke above the red resistance line, which suggests further improvement and an increase to at least 1.1756, where the 173.2% Fibonacci extension is. However, taking into account the breakout from the consolidation, USD/CAD could increase even to around 1.1800, where the size of the upward move will correspond to the height of the consolidation.
Very short-term outlook: bullish
Short-term outlook: mixed with bullish bias
MT outlook: mixed
LT outlook: mixed
Trading position (short-term; our opinion): No positions are justified from the risk/reward perspective at the moment. We will keep you informed should anything change, or should we see a confirmation/invalidation of the above.
USD/CHF
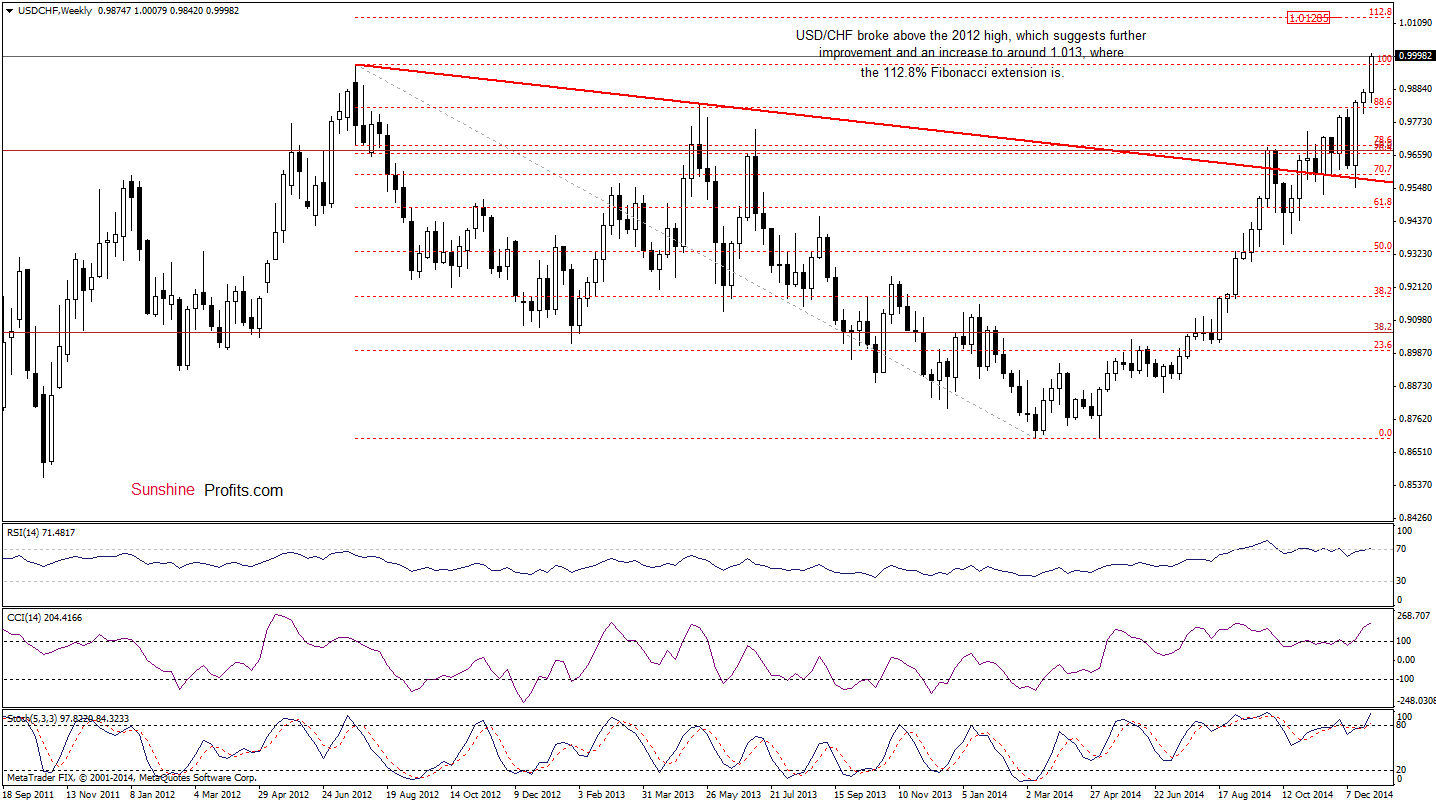
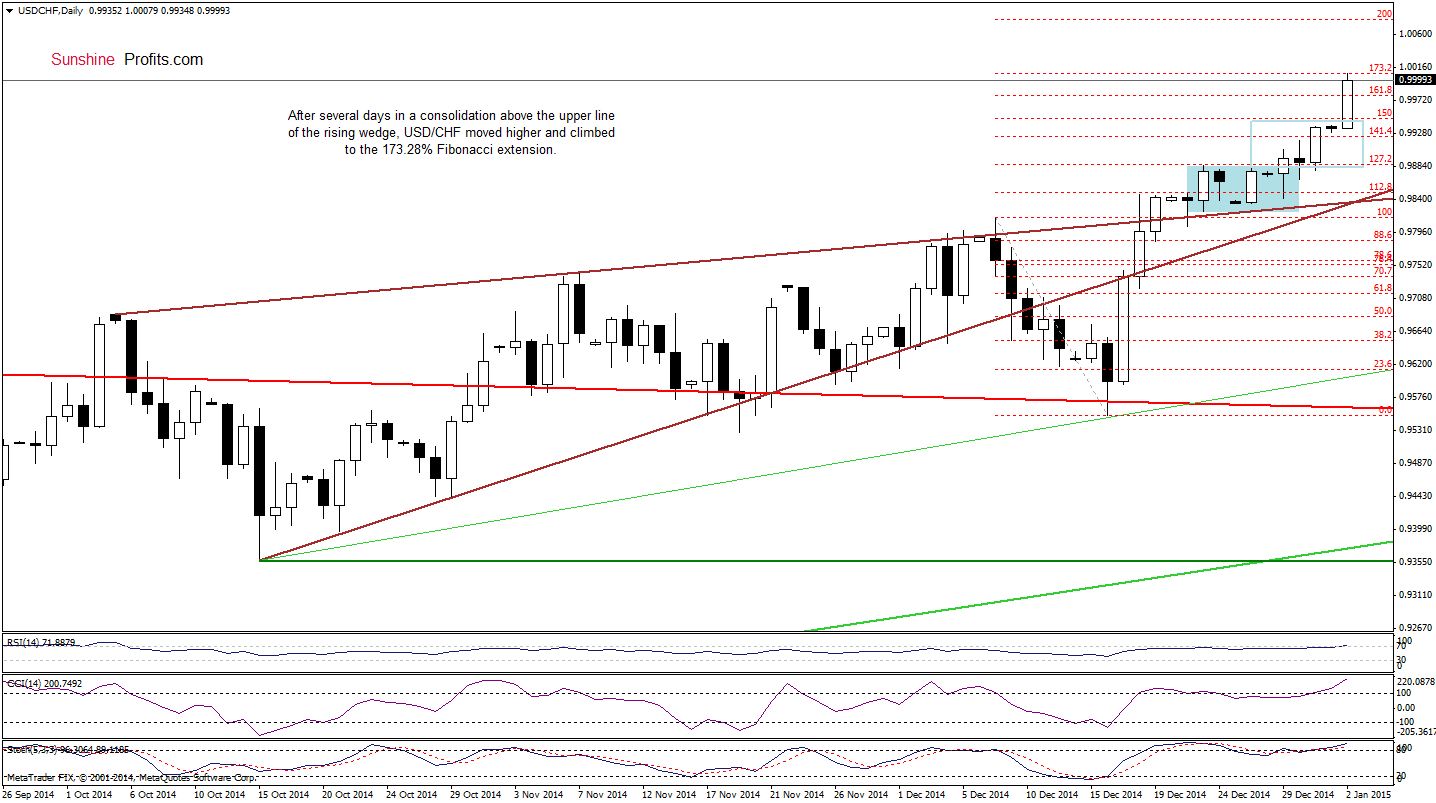
On the daily chart, we see that after several days in a consolidation (marked with blue) USD/CHF moved higher and broke above the upper line of the formation, which triggered further improvement and an increase to the 173.2% Fibonacci extension. With this move, the pair broke above the 2012 high, which suggests further improvement and an increase to around 1.013, where the 112.8% Fibonacci extension is (seen more clearly on the weekly chart). Finishing today’s commentary on this currency pair, please note that the (daily and also weekly) CCI and Stochastic Oscillator are overbought (over the level of 90), while the RSI climbed above the level of 70, which suggests that a pause or even a trend reversal in the coming week should not surprise us.
Very short-term outlook: bullish
Short-term outlook: mixed
MT outlook: mixed
LT outlook: bearish
Trading position (short-term; our opinion): No positions are justified from the risk/reward perspective at the moment. We will keep you informed should anything change, or should we see a confirmation/invalidation of the above.
AUD/USD
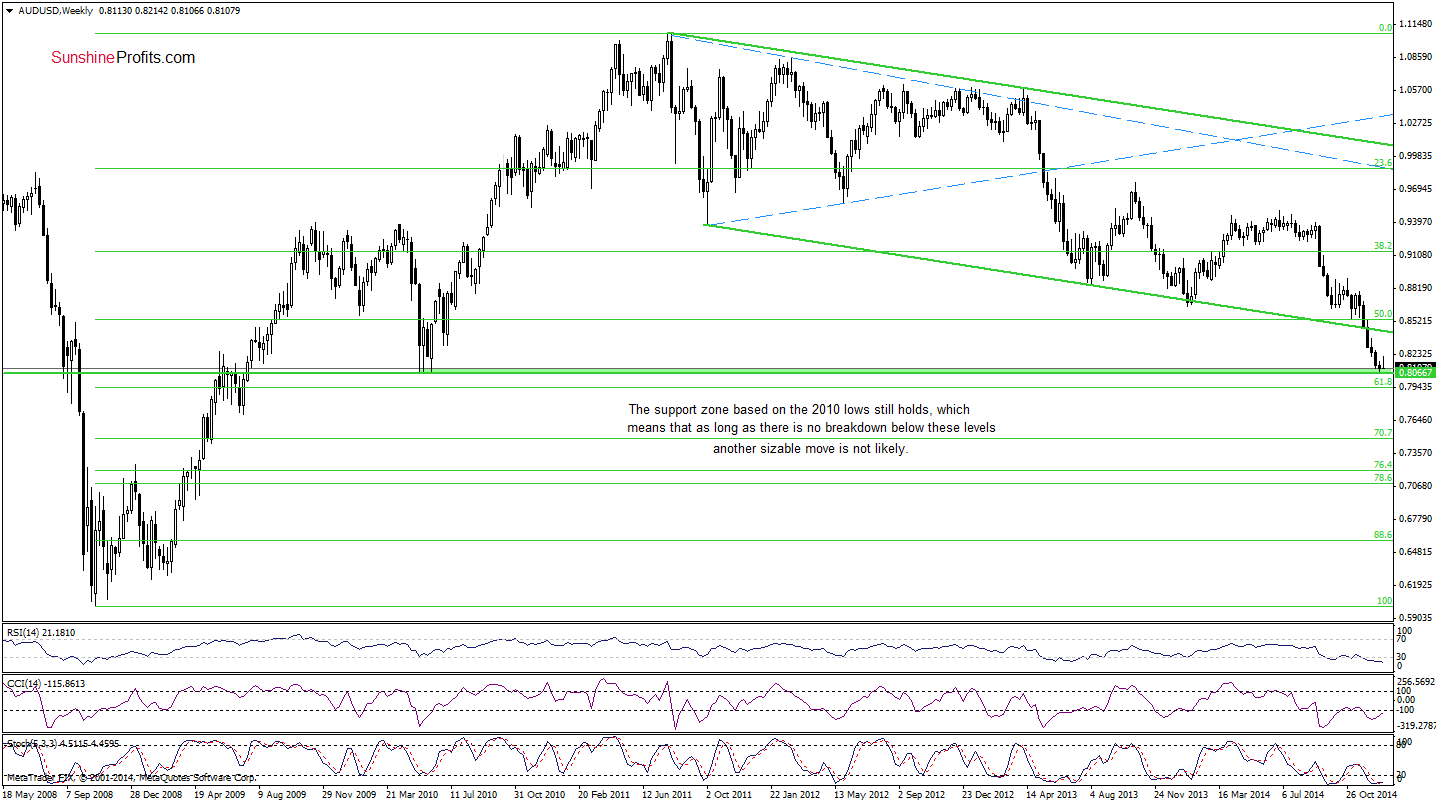
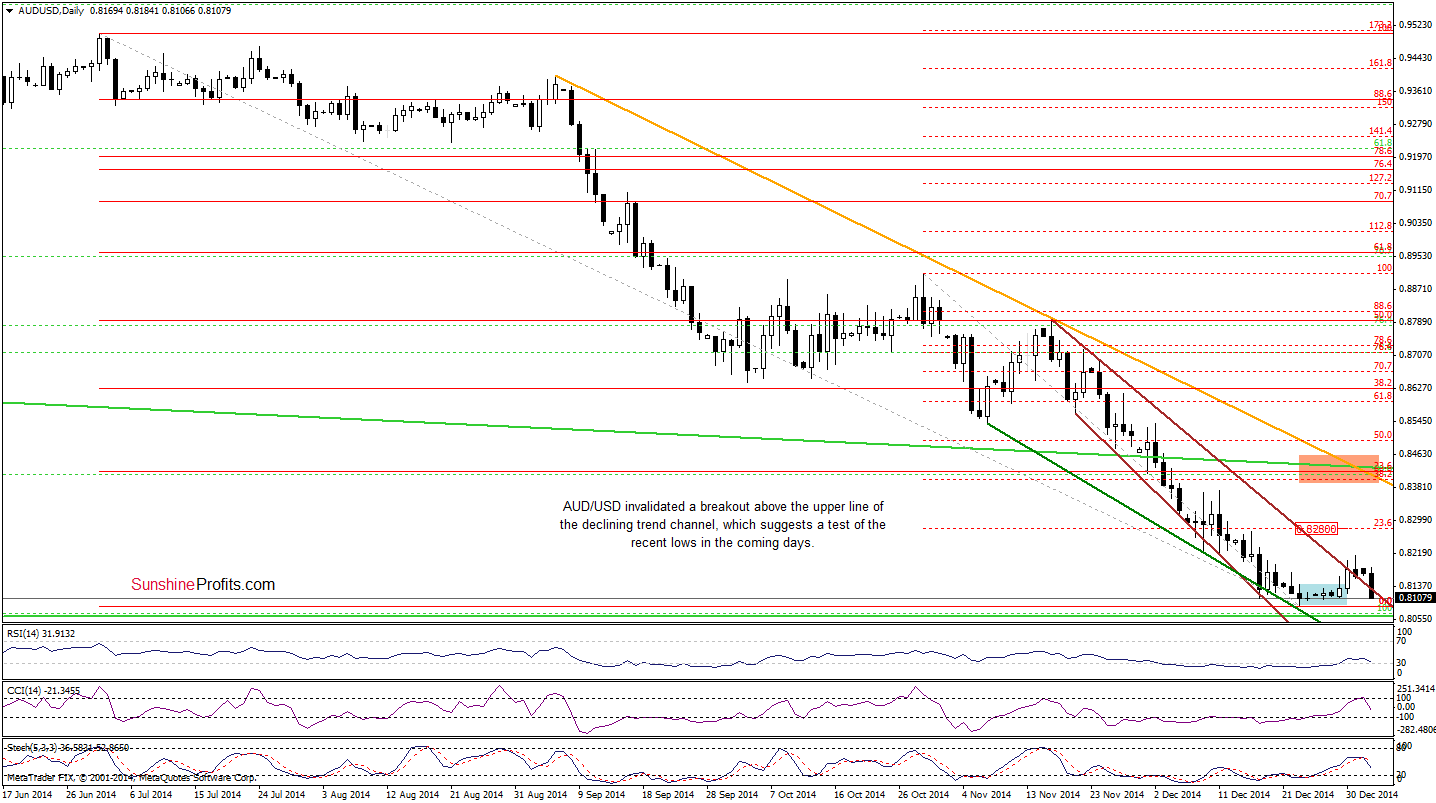
As you see on the daily chart, the situation in the very short term has deteriorated as AUD/USD reversed and declined, invalidating a breakout above the upper line of the declining trend channel. This is a bearish signal (especially when we factor in the fact that the CCI and Stochastic Oscillator generated sell signals), which suggests further deterioration and a test of the recent low and the support zone created by the 2010 lows.
Very short-term outlook: mixed with bearish bias
Short-term outlook: mixed
MT outlook: mixed
LT outlook: mixed
Trading position (short-term): In our opinion, no positions are justified from the risk/reward perspective at the moment. However, if the pair confirms the breakout above the upper line of the declining trend channel, we’ll consider opening long positions. We will keep you informed should anything change, or should we see a confirmation/invalidation of the above.
Thank you.
Nadia Simmons
Forex & Oil Trading Strategist
Przemyslaw Radomski, CFA
Founder, Editor-in-chief
Gold & Silver Trading Alerts
Forex Trading Alerts
Oil Investment Updates
Oil Trading Alerts

