
Earlier today, official data showed that consumer price inflation in Australia rose 0.5% in the second quarter, beating analysts’ expectations of 0.6% increase. Additionally, on a yearly basis, Australia CPI rose to 3.0% in the last quarter, compared to expectations for an increase to 3.1%. These lower than expected numbers pushed the Australian dollar to one-and-a-half week high against its U.S. counterpart. As a result, AUD/USD broke above its key resistance line. Is this event as bullish as it seems at the first sight?
In our opinion the following forex trading positions are justified - summary:
- EUR/USD: short (stop-loss order: 1.3670)
- GBP/USD: none
- USD/JPY: none
- USD/CAD: none
- USD/CHF: none
- AUD/USD: none
EUR/USD
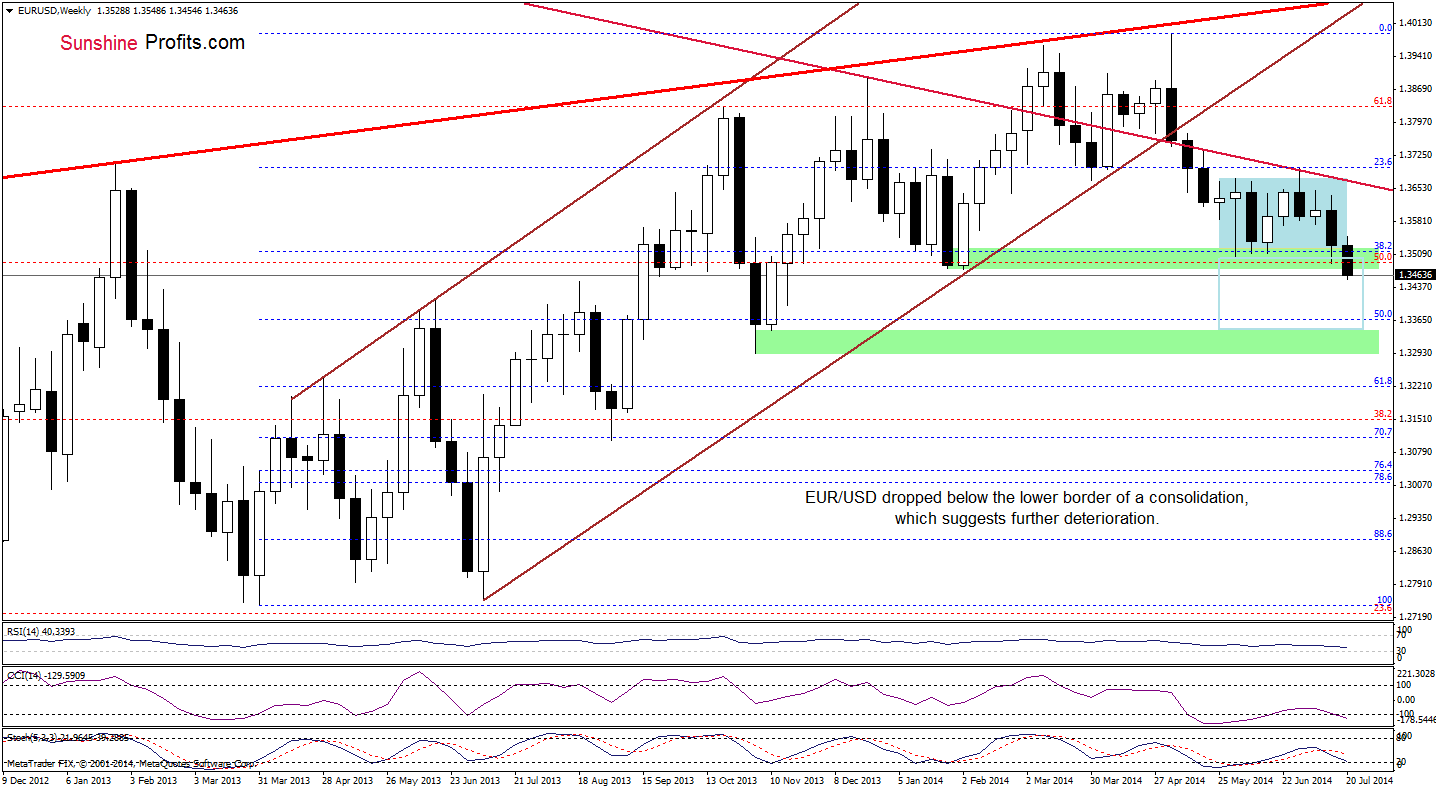
The medium-term picture remains bearish as EUR/USD still remains not only below the lower border of the consolidation, but also under the February lows. Therefore, what we wrote yesterday is up-to-date:
(…) we may see a drop even to around 1.3320, where the size of the downswing will correspond to the height of the consolidation.
Please keep in mind that before currency bears will be able to realize the above-mentioned scenario, they will have to break below the 50% Fibonacci retracement level (around 1.3367), which serves as the nearest medium-term support at the moment.
Having discussed the medium-term outlook, let’s check the daily chart.
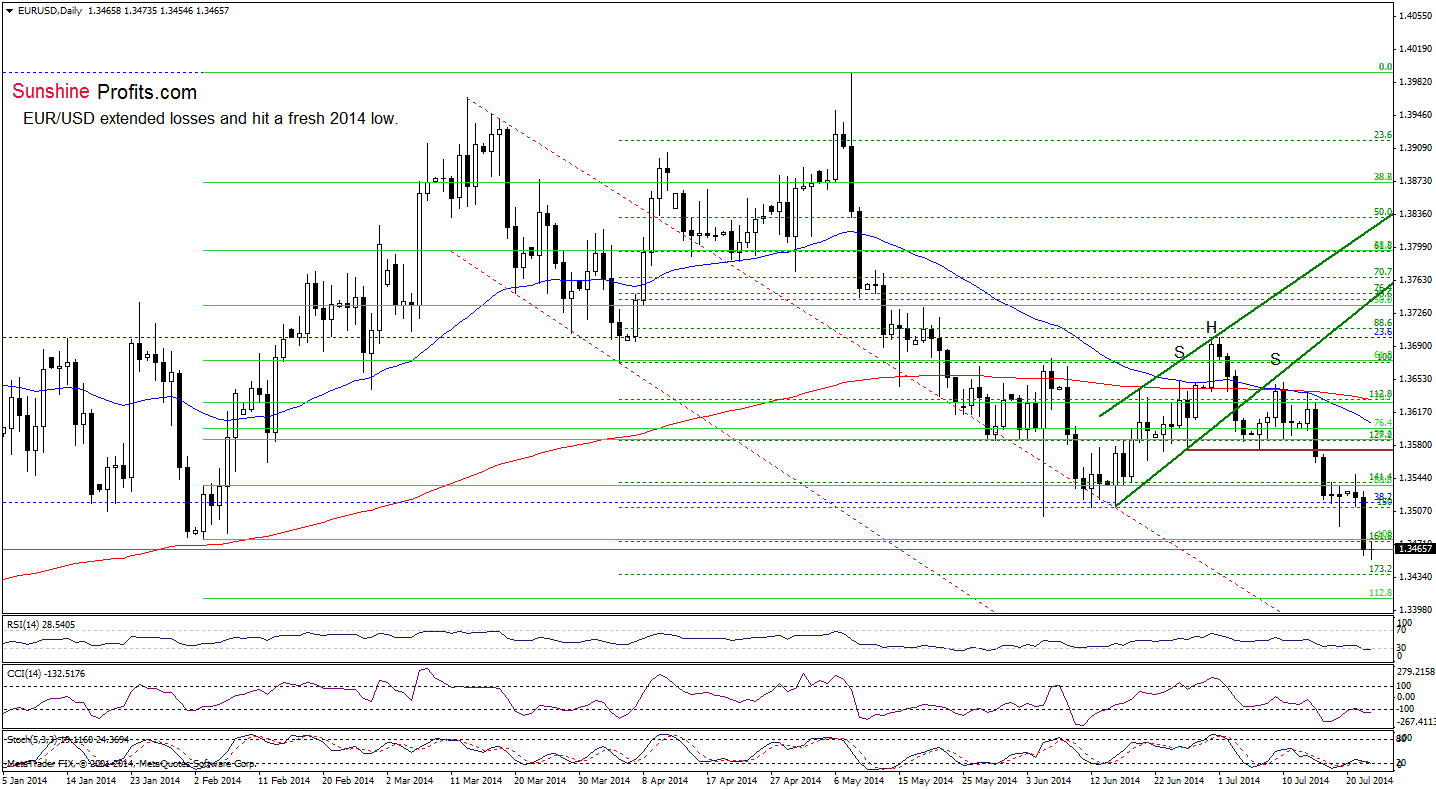
From this perspective, we see that EUR/USD moved lower once again and is on track to reach our next downside target. That’s why we believe that our last commentary is still valid:
(…) the RSI dropped to its lowest level since mid-June, while the CCI and Stochastic Oscillator are oversold (additionally, there are positive divergences between these two indicators and the pair), which suggests that a pause or corrective upswing is just around the corner (on the short-term basis). Nevertheless, as long as there are no buy signals and EUR/USD remains below the recent lows, another move lower is more likely than not. If this is the case, the nearest support will be around 1.3436 (the 1.732% Fibonacci extension based on the April-May rally), and if it is broken, the pair will likely drop to 1.3411, where the 112.8% Fibonacci extension (based on the entire Feb-May rally) is.
Very short-term outlook: bearish
Short-term outlook: bearish
MT outlook: bearish
LT outlook: bearish
Trading position (short-term): Small short positions (using half of the capital that one would normally use). Stop-loss order: 1.3670. The probability for the continuation of the decline is not extremely high, which is why we are not doubling the short position at the moment. We’ll do it, when the breakdown is confirmed. We will keep you informed should anything change, or should we see a confirmation/invalidation of the above.
GBP/USD
The medium-term outlook hasn’t changed much and remains mixed as GBP/USD is trading in the consolidation range around the key support line created by the 2009 high.
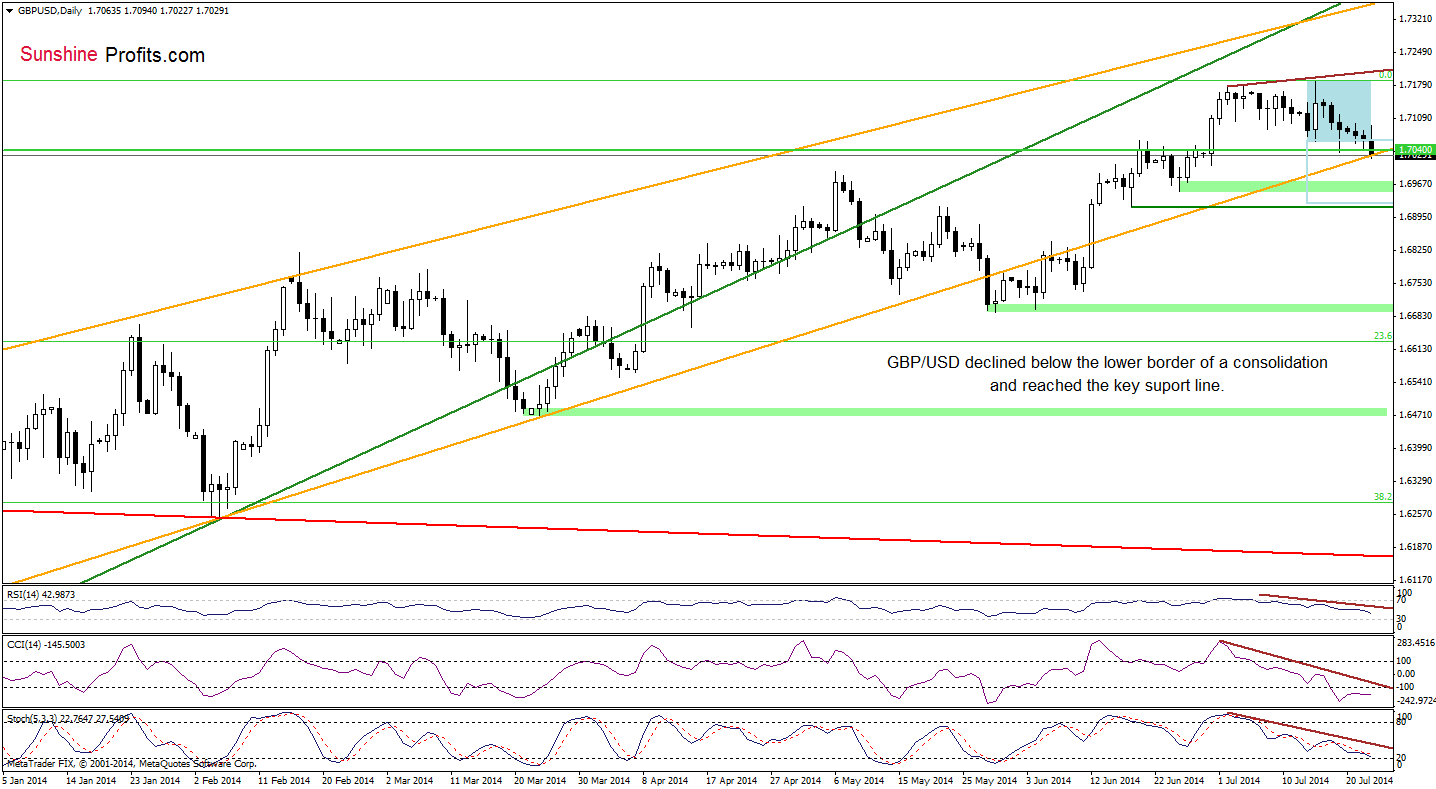
What can we infer from the daily chart?
On Monday, we wrote the following:
(...) we are convinced that as long as there is no breakout/breakdown we won’t see another bigger move. So, where the pair head next? (…) In our opinion, the next move will be to the downside. (..) if the pair breaks below the lower border of the consolidation, the nearest downside target will be the 2009 high, and the next - the medium-term orange line. Please note that only if the pair breaks below these lines, we’ll see a correction to around June 18 low, where the size of a pullback will correspond to the height of the formation.
As you see on the above chart, the exchange rate moved visibly lower and broke below the lower border of the consolidation range earlier today. With this downswing, the pair reached the medium-term orange line. If it withstand the selling pressure, we’ll likely see a rebound from here and a comeback to around recent highs. However, if this key support line is broken, we believe that currency bears will realize the above-mentioned scenario in the coming days.
Very short-term outlook: bearish
Short-term outlook: mixed with bearish bias
MT outlook: bearish
LT outlook: mixed
Trading position (short-term): In our opinion, no positions are justified from the risk/reward perspective. We will keep you informed should anything change, or should we see a confirmation/invalidation of the above.
AUD/USD
The medium-term outlook remains mixed as AUD/USD is still trading in a consolidation slightly below the 2014 high. Will the very short-term picture give us more learly clues where the pair head next? Let’s check.
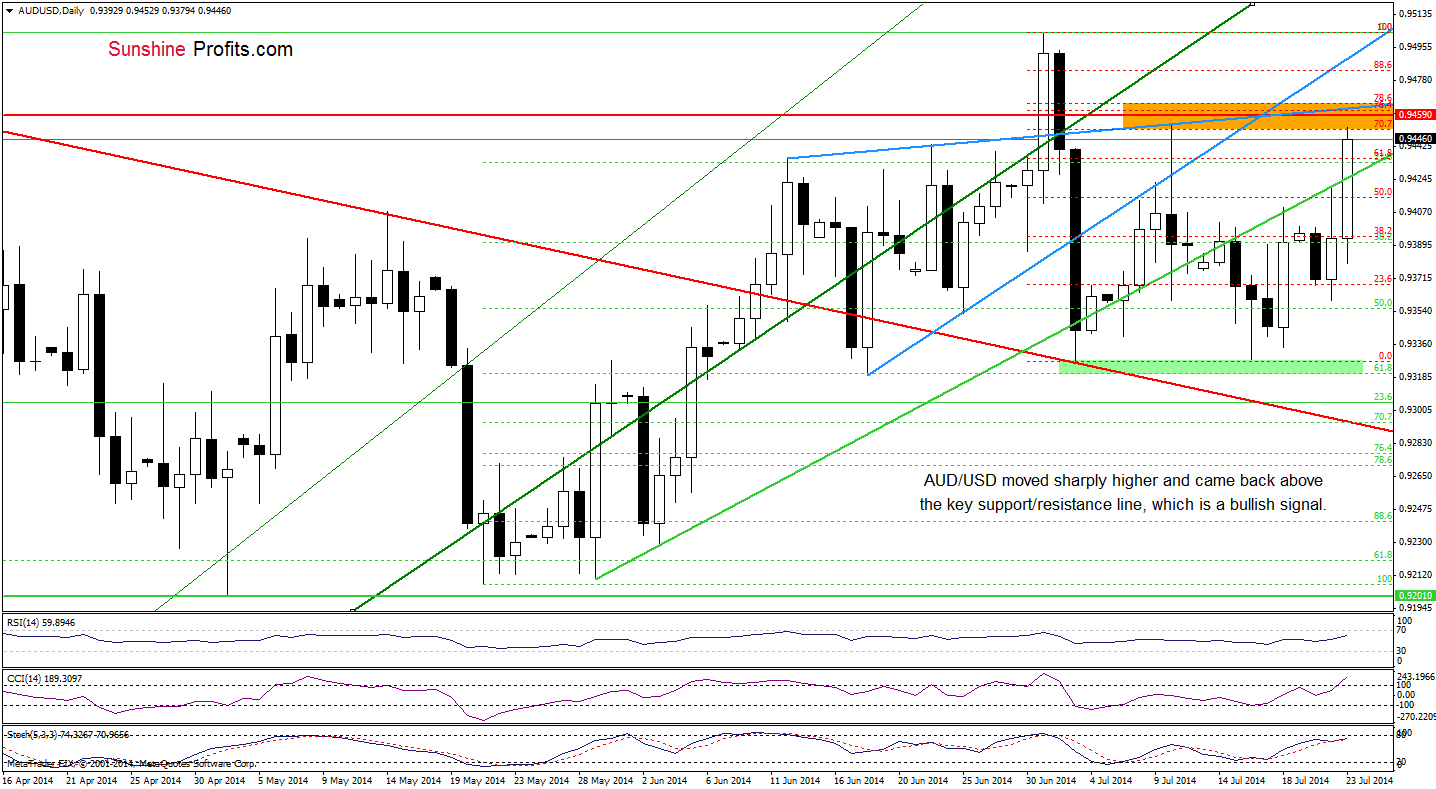
The first thing that catches the eye on the above chart is a strong and sharp upswing, which took AUD/USD above the key green support/resistance line. Although this is a strong bullish signal, we should keep in mind that the pair reached the resistance zone created by the upper line of the blue rising wedge and the 76.4% and 78.6% Fibonacci retracement levels. As you see on the daily chart, this area stopped further improvement earlier this month. Therefore, if history repeats itself once again, we may see a similar pullback to the one that we saw on July 10 (at this point it’s worth noting that today all indicators are even higher, which increases the risk of a correction). If this is the case, the nearest support will be the green support/resistance. Nevertheless, as long as there is no sell signals, an attempt to move higher can’t be ruled out. In this scenario, if currency bulls manage to push the pair above the above-mentioned strong resistance, the next upside target will be around 0.9483, where the next Fibonacci retracement level and the lower border of the rising wedge are.
Very short-term outlook: mixed
Short-term outlook: mixed
MT outlook: mixed
LT outlook: bearish
Trading position (short-term): In our opinion, no positions are justified from the risk/reward perspective. We will keep you informed should anything change, or should we see a confirmation/invalidation of the above.
Thank you.
Nadia Simmons
Forex & Oil Trading Strategist
Przemyslaw Radomski, CFA
Founder, Editor-in-chief
Gold & Silver Trading Alerts
Forex Trading Alerts
Oil Investment Updates
Oil Trading Alerts

