
Earlier today, the U.S. dollar increased to a two-week high against its Canadian counterpart, but declined to a fresh 2014 low against the Swiss franc. What happened with other currency pairs? What is their current outlook? We invite you to read our today's Forex Trading Alert.
In our opinion the following forex trading positions are justified - summary:
EUR/USD
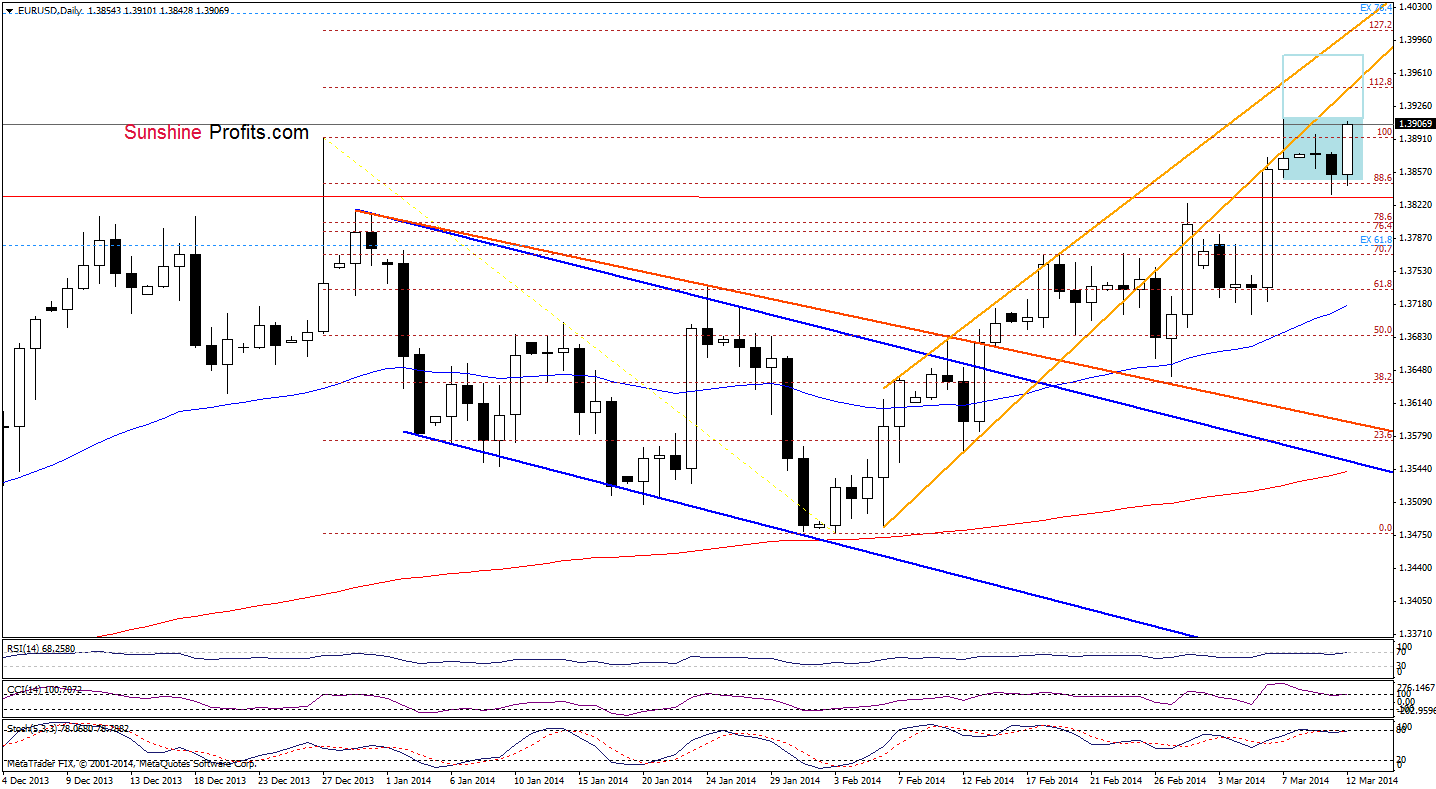
Despite, today’s increase EUR/USD still remains in a consolidation around the 2013 high. If the pair climbs above the 2014 high, we may see further improvement and the first upside target will be the lower orange line (currently at 1.39462), which corresponds to the 112.8% Fibonacci extension (based on the Dec.-Feb. decline). On the other hand, if the pair reverses and sellers successfully push the exchange rate below yesterday’s low, we may see a post double top decline to around 1.37517, where the 38.2% Fibonacci retracement based on the recent rally is. Looking at the current position of the indicators, we see that there is a negative divergence between the CCI and the exchange rate, while the Stochastic Oscillator is very close to generating sell signal, which suggests that a correction is just around the corner.
Very short-term outlook: mixed
Short-term outlook: bullish
MT outlook: mixed
LT outlook: bearish
Trading position (short-term): In our opinion no positions are justified from the risk/reward perspective. We will keep you informed should anything change, or should we see a confirmation/invalidation of the above.
GBP/USD
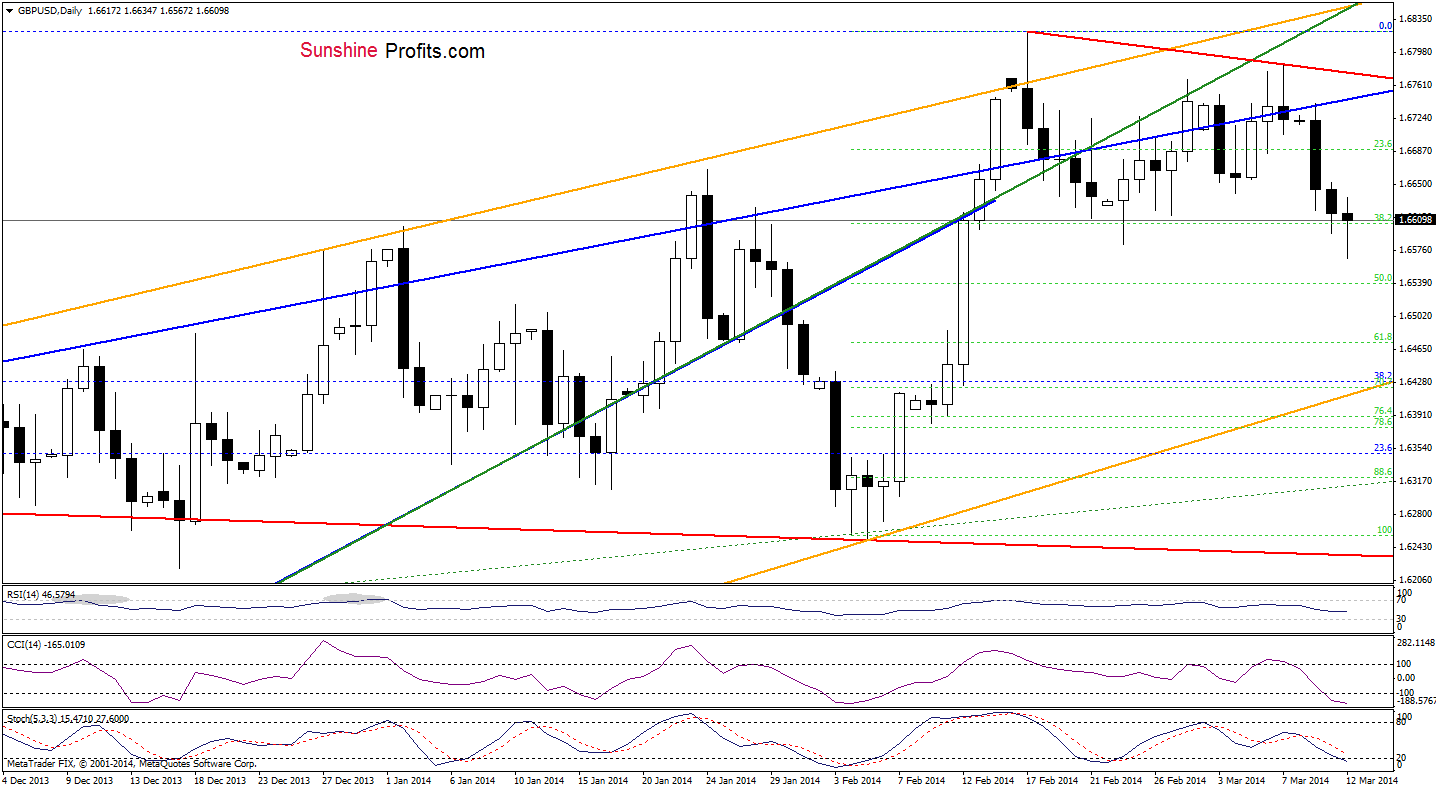
Earlier today, GBP/USD extended losses and declined below the 38.2% Fibonacci retracement. As you see on the above chart, this deterioration was only temporary and the pair reversed in the following hours. On one hand, if this strong support level encourages buyers to push the order button, we may see a corrective upswing in the coming day (or days) – similarly to what we saw during the last month. Nevertheless, we should keep in mind that sell signals remain in place, supporting sellers. Connecting the dots, the current situation is a bit unclear. Will the 4-hour chart give us any clues?
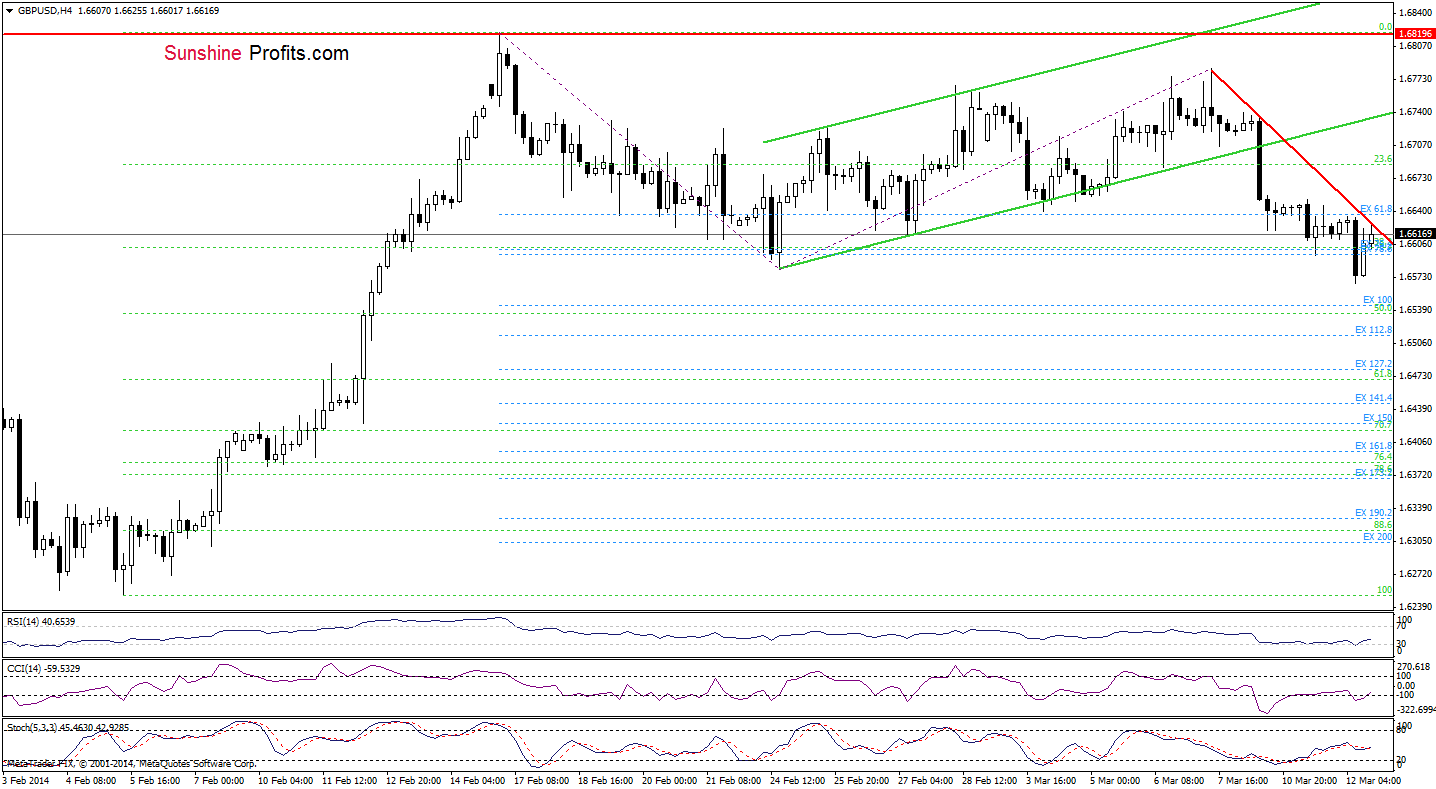
From this perspective, we see that the exchange rate remains in a consolidation below the red declining resistance line. If GBP/USD breaks above it, we will likely see a corrective upswing. However, if the pair declines once again and drop below today’s low, the next downside target will be between 1.65365 and 1.65437 (the space between 50% Fibonacci retracement and the 100% Fibonacci projection).
Very short-term outlook: mixed
Short-term outlook: mixed
MT outlook: mixed
LT outlook: mixed
Trading position (short-term): In our opinion no positions are justified from the risk/reward perspective at the moment. We will keep you informed should anything change, or should we see a confirmation/invalidation of the above.
USD/JPY
Quoting our last Forex Trading Alert:
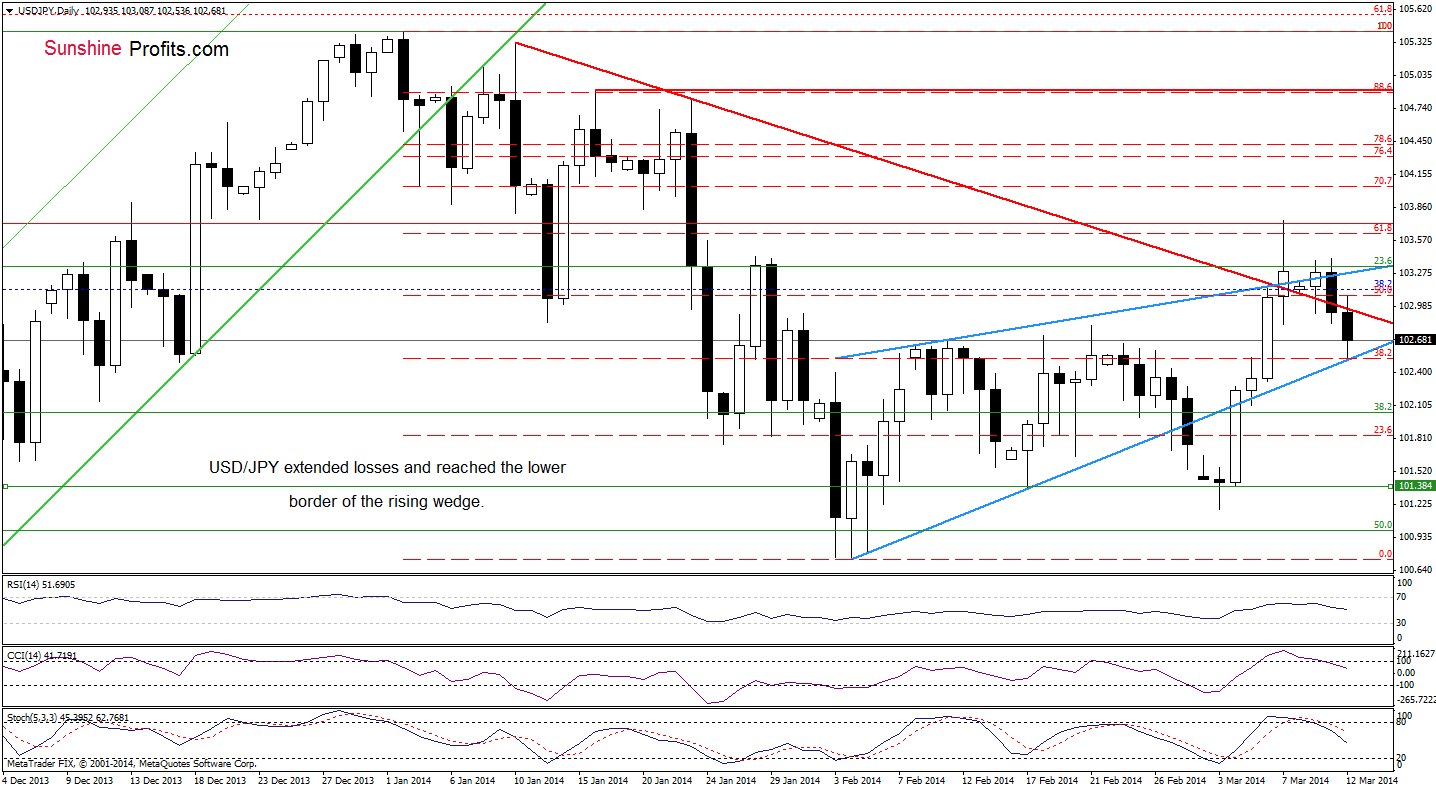
(…) if the buyer fail and the exchange rate drops below the red declining line (which serves as support now), we will likely see a downswing to the lower border of the rising wedge. Looking at the current position of the indicators (very close to generating sell signals), a bearish scenario seems more likely.
As you see on the above chart, USD/JPY closed Tuesday below the support/resistance line, which was a negative signal. Earlier today, the pair extended losses (after an unsuccessful attempt to come back above the red line) and sellers realized their scenario. If to the lower border of the rising wedge encourage buyers to act, we may see a corrective upswing to the upper line of this formation. However, if they fail, we may see a drop even to around 101.38 (the March 4 low). At this point, it’s worth noting that sell signals generated by the indicators support sellers at the moment, which suggests further deterioration.
Very short-term outlook: mixed
Short-term outlook: mixed with bullish bias
MT outlook: bullish
LT outlook: bearish
Trading position (short-term): In our opinion no positions are justified from the risk/reward perspective at the moment. We will keep you informed should anything change, or should we see a confirmation/invalidation of the above.
USD/CAD
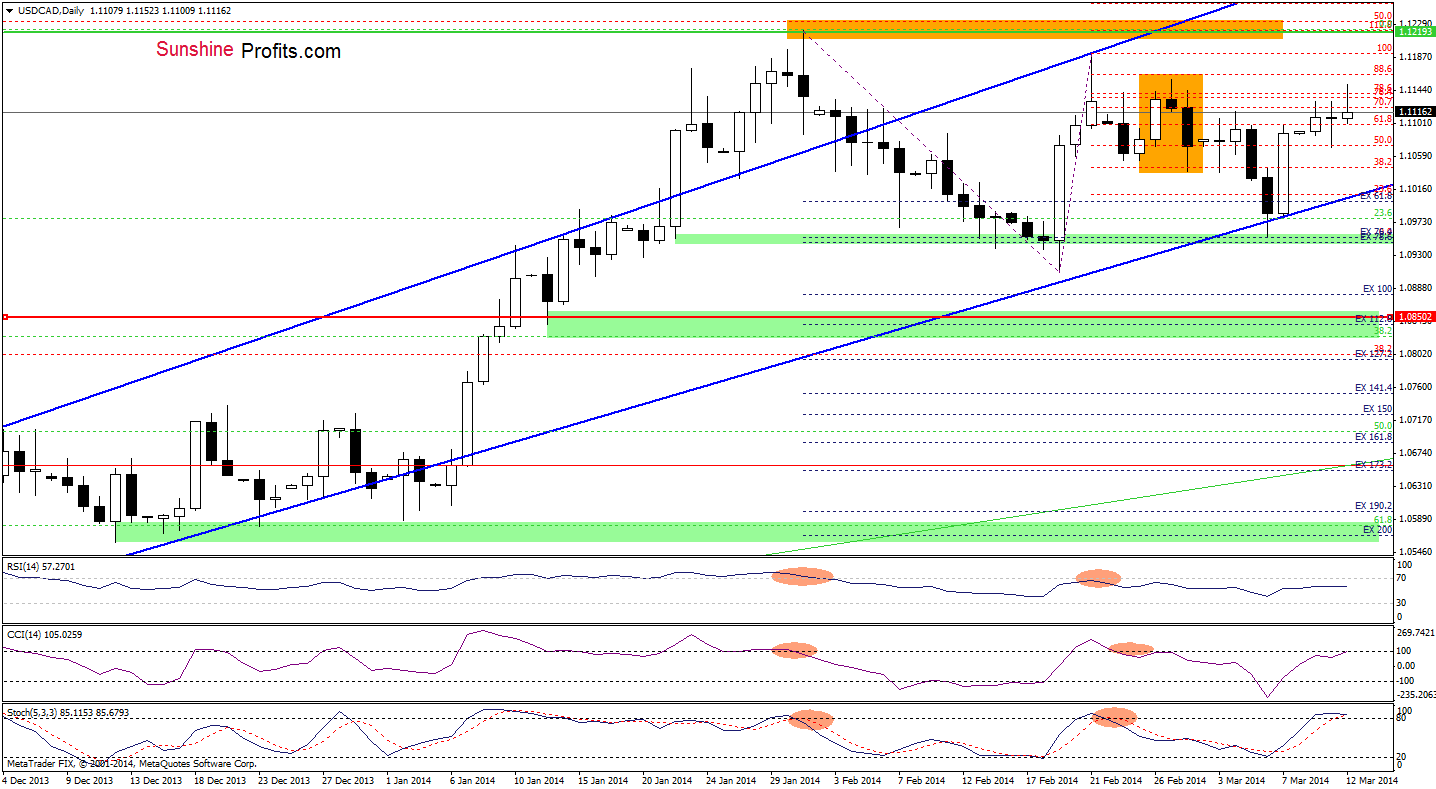
Looking at the above chart, we see that USD/CAD extended gains and approached its next upside target – the Feb.27 high. However, as we mentioned in our Forex Trading Alert posted on Friday - this is also a top of a bearish candlestick pattern – an evening star (as a reminder, this formation helped push the exchange rate lower at the beginning of the month). Taking into account the proximity to this resistance level and combining it with the 78.6% Fibonacci retracement (reached earlier today), we may see a pullback in the near future – especially if the indicators generate sell signals.
Very short-term outlook: bullish
Short-term outlook: mixed with bullish bias
MT outlook: bullish
LT outlook: bearish
Trading position (short-term): In our opinion no positions are justified from the risk/reward perspective. We will keep you informed should anything change, or should we see a confirmation/invalidation of the above.
USD/CHF
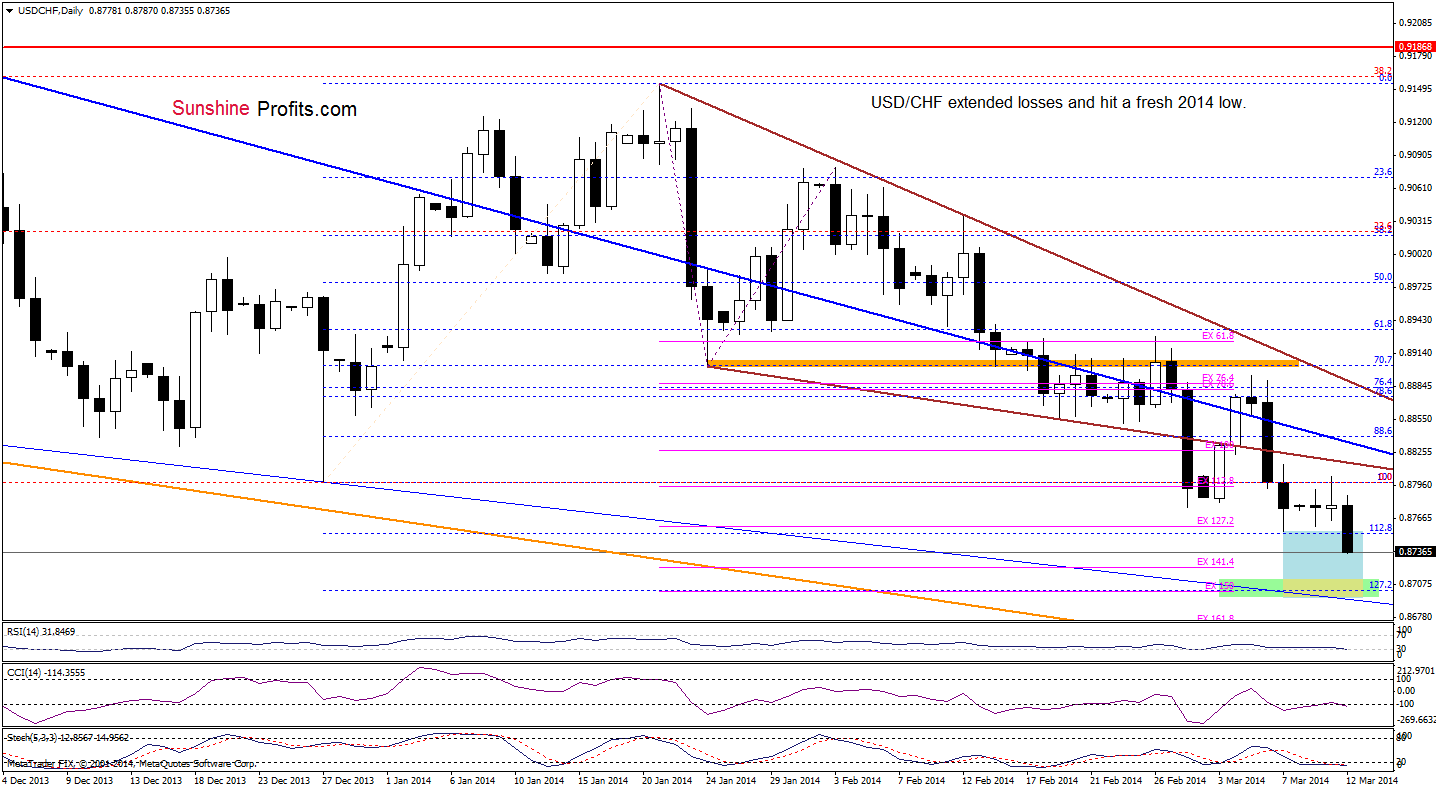
As you see on the above chart, the situation has deteriorated significantly as USD/CHF broke below the lower border of the consolidation range. According to theory, such price action may trigger further declines and downside target (marked with a blue rectangle) would be around 0.86965. At this point it’s worth noting that this level is in the next support zone created by the 127.2% Fibonacci extension, the 150% Fibonacci projection and the medium-term thin blue support line (currently around 0.86921). Looking at the position of the indicators, we see that although there is a positive divergence between the CCI and the exchange rate, the Stochastic Oscillator is oversold and the RSI slipped to its lowest level since the beginning of the month, there are no buy signals at the moment, which favors the sellers.
Very short-term outlook: bearish
Short-term outlook: bearish
MT outlook: bearish
LT outlook: bearish
Trading position (short-term): In our opinion, the space for further declines seems limited, so opening short positions at the moment is not a good idea. We will keep you informed should anything change, or should we see a confirmation/invalidation of the above.
AUD/USD
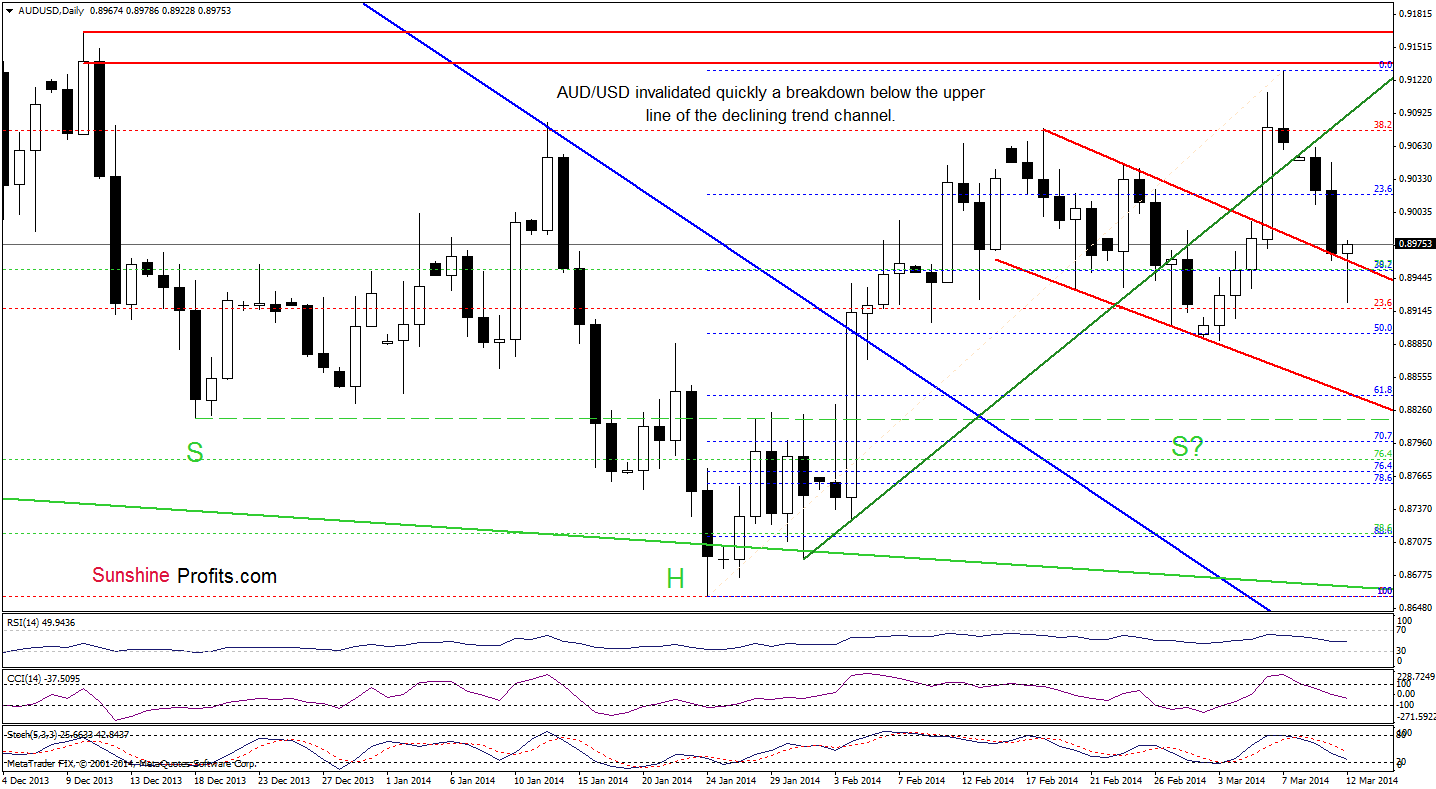
Earlier today, AUD/USD extended losses and declined below the upper line of the trend channel. However, as you see on the daily chart, this deterioration was only temporarily and the pair rebounded, invalidating the breakdown. This is a bullish signal, which suggests that we may see further improvement. Nevertheless, we should keep in mind that sell signals generated by the indicators still support sellers.
Very short-term outlook: mixed
Short-term outlook: bullish
MT outlook: bearish
LT outlook: bearish
Trading position (short-term): In our opinion no positions are justified from the risk/reward perspective at the moment. We will keep you informed should anything change, or should we see a confirmation/invalidation of the above.
Thank you.
Nadia Simmons
Forex & Oil Trading Strategist
Forex Trading Alerts
Oil Investment Updates
Oil Trading Alerts

