
The U.S. dollar climbed to a one-week high against its Canadian counterpart earlier today. The greenback also moved higher against the Australian dollar as weaker-than-expected Chinese economic data (released over the weekend) weighed on the Australian currency. What happened with other currency pairs? What is their current outlook? We invite you to read our today's Forex Trading Alert.
In our opinion the following forex trading positions are justified - summary:
EUR/USD
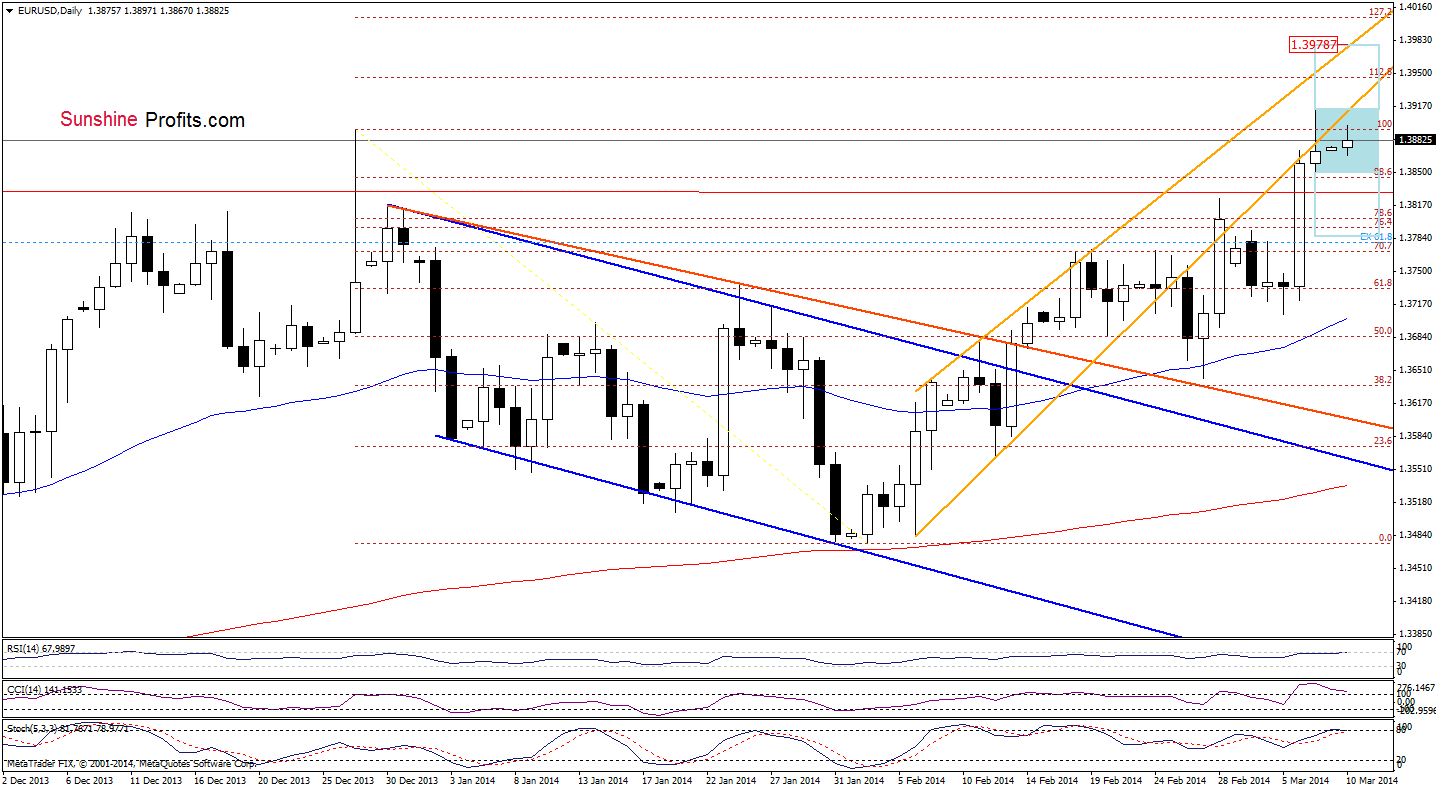
As you see on the above chart, EUR/USD remains in a consolidation slightly below the lower border of the rising channel and the 2013 high. So, we should consider two scenarios. On one hand, if the pair climbs above the 2014 high, we may see further improvement and the upside target will be the upper orange line (currently at 1.39787). On the other hand, if the sellers push the exchange rate below Friday low, we will likely see a drop to around 1.37855, where the downside target is. Looking at the current position of the indicators, we see that the RSI remains between the level of 66 and 70, the CCI and Stochastic Oscillator are still overbought (and very close to generating sell signals), which suggests that a bearish scenario is more likely in the coming days.
Let’s take a look at the 4-hour chart.
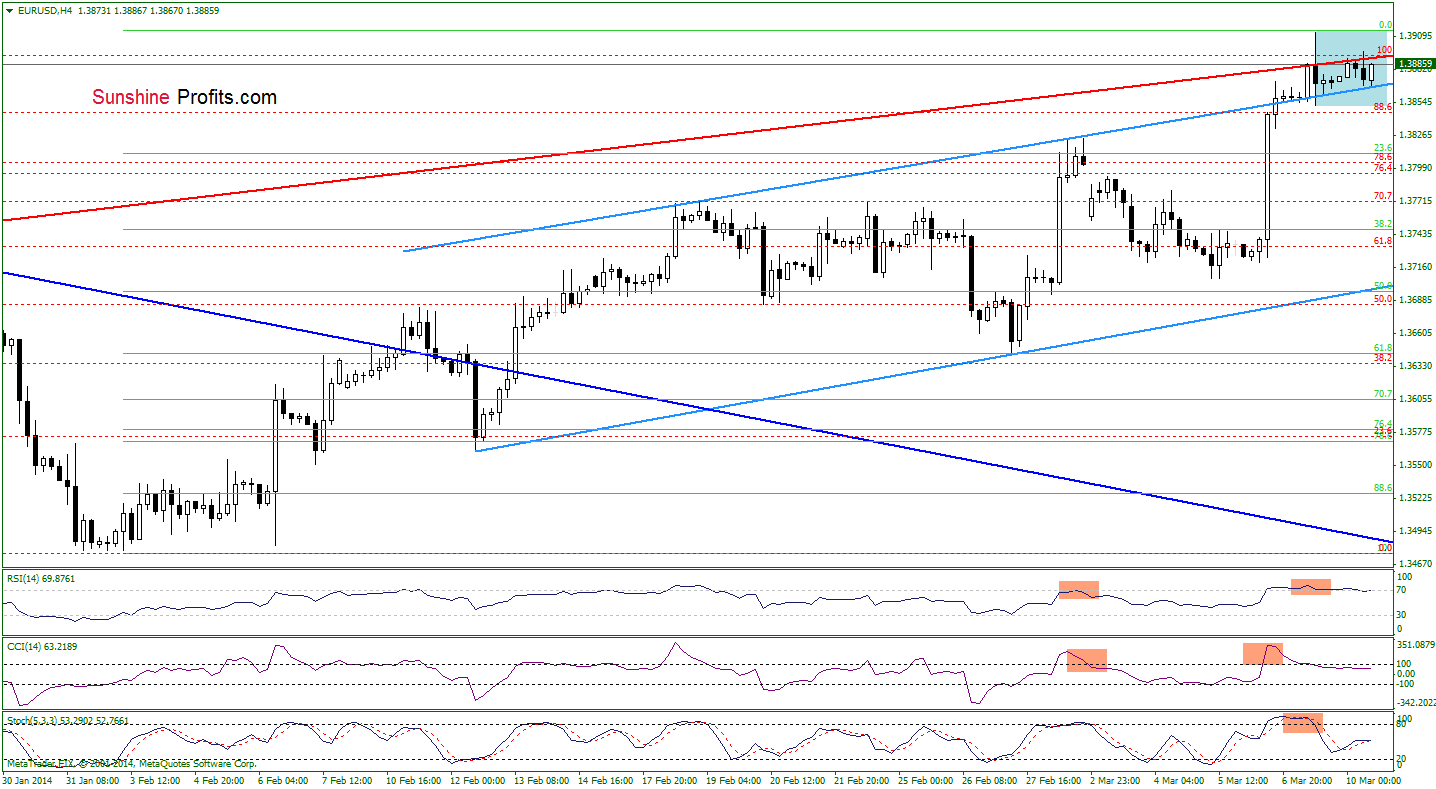
From this perspective, we see that EUR/USD still remains between the short-term red resistance line and the upper line of the rising trend channel (marked with blue). Therefore, what we wrote in our last Forex Trading Alert is still up-to-date.
(…) if the exchange rate declines below this important line, we will likely see a pullback to (at least) 23.6% Fibonacci retracement level based on the entire recent rally. If it is broken, the next downside target will be the 38.2% Fibonacci retracement around 1.37477.
Please note that sell signals generated by the indicators remain in place, supporting sellers.
Very short-term outlook: mixed
Short-term outlook: bullish
MT outlook: mixed
LT outlook: bearish
Trading position (short-term): In our opinion no positions are justified from the risk/reward perspective. We will keep you informed should anything change, or should we see a confirmation/invalidation of the above.
GBP/USD
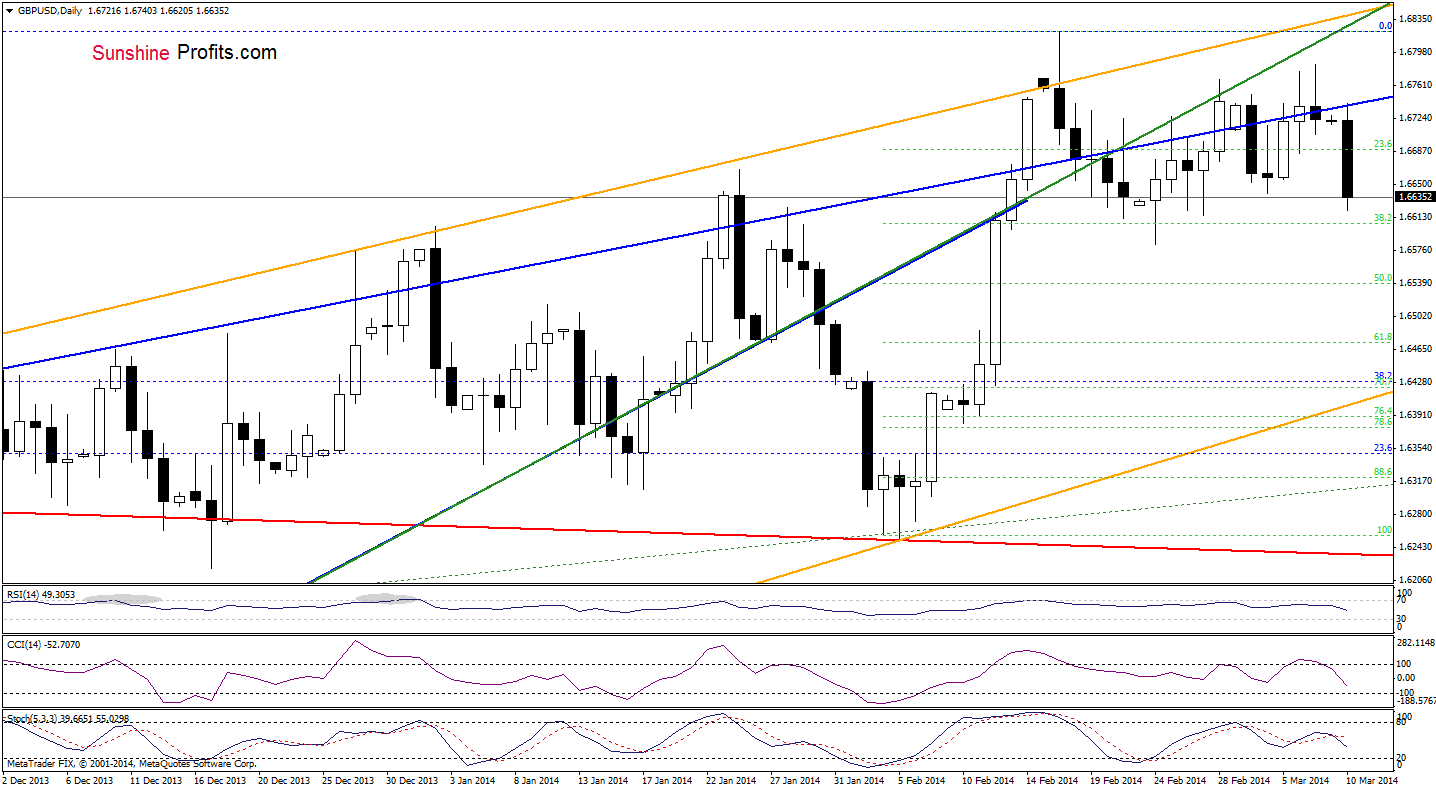
Looking at the above chart, we see that the situation has deteriorated as GBP/USD declined sharply below the upper line of the rising wedge and approached the 38.2% Fibonacci retracement earlier today. Additionally, all indicators support sellers, which suggests that further deterioration should not surprise us.
Before we summarize this currency pair, let’s take a look at the 4-hour chart.
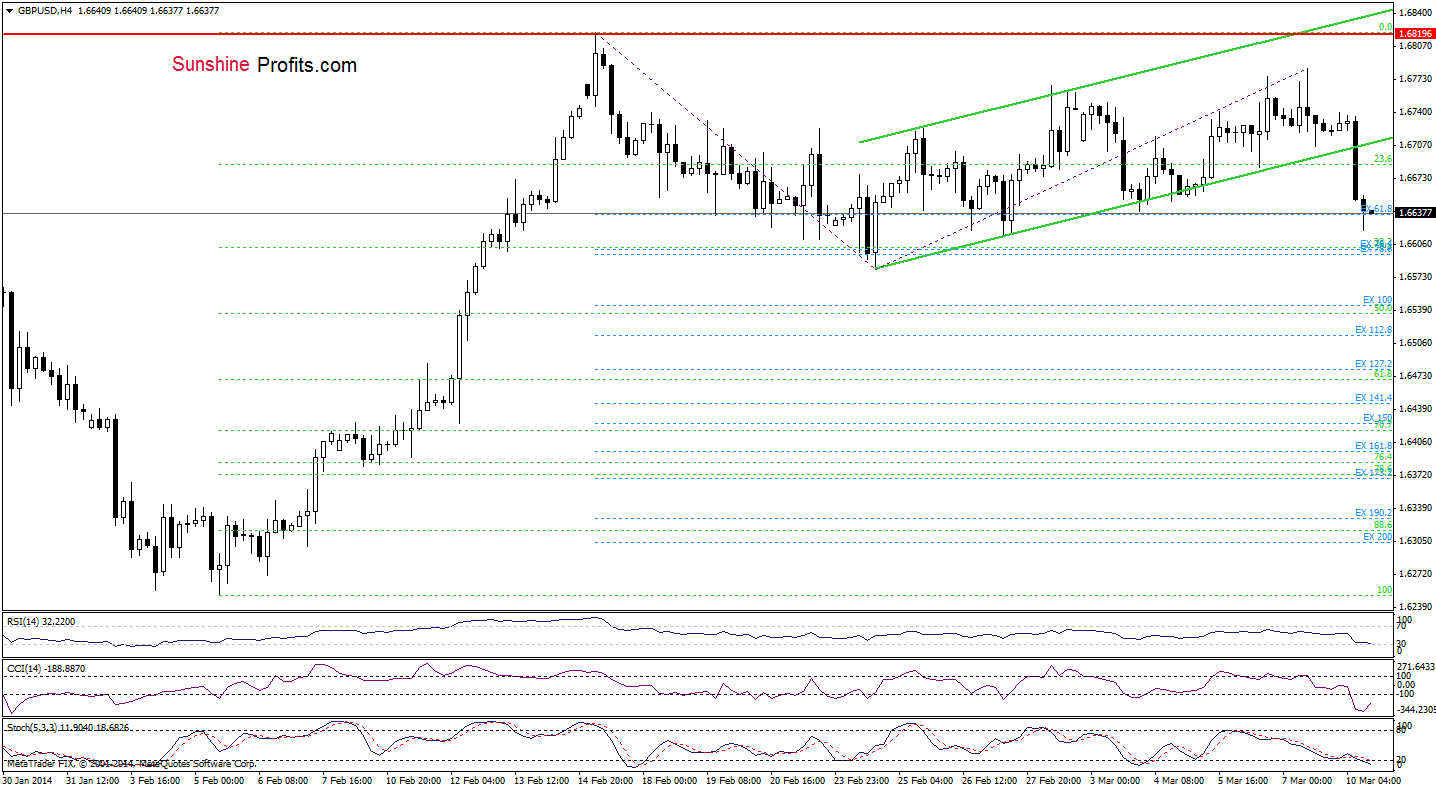
Quoting our last Forex Trading Alert:
(…) sell signals generated by the indicators remain in place, therefore, if the par declines below the lower line of the trend channel, we will likely see a drop to the March 4 low or even to the 38.2% Fibonacci retracement based on the recent rally.
Earlier today, we saw such price action as GBP/USD declined below the lower line of the trend channel. According to theory, such drop may trigger further deterioration and the downside target would be around the Feb.24 (1.65823). Nevertheless, we should keep in mind that the indicators are oversold, which suggests that we may see a corrective upswing in the very near future.
Very short-term outlook: bearish
Short-term outlook: mixed
MT outlook: mixed
LT outlook: mixed
Trading position (short-term): In our opinion no positions are justified from the risk/reward perspective at the moment. We will keep you informed should anything change, or should we see a confirmation/invalidation of the above.
USD/JPY
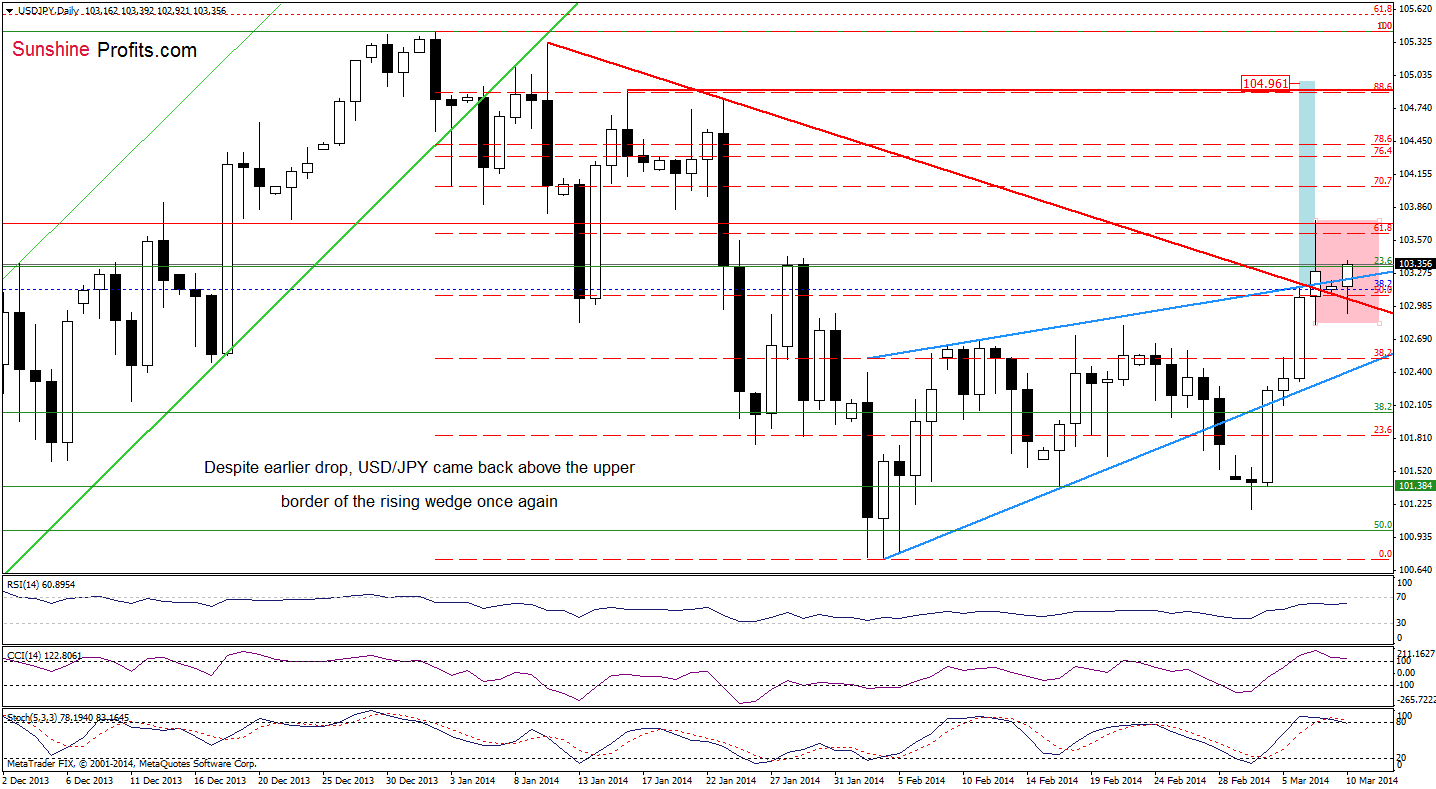
Looking at the above chart, we see that USD/JPY remains in a consolidation between Friday low and high. At this point (similarly to what we wrote in the case of EUR/USD), we should consider two scenarios. If the pair increases above the upper line (and also above the 61.8% Fibonacci retracement level), we may see further improvement and the upside target would be around 104.61. However, if the buyer fail and the exchange rate drops below the red declining line (which serves as support now), we will likely see a downswing to the lower border of the rising wedge. Looking at the current position of the indicators (very close to generating sell signals), a bearish scenario seems more likely.
Very short-term outlook: mixed
Short-term outlook: mixed with bullish bias
MT outlook: bullish
LT outlook: bearish
Trading position (short-term): In our opinion, the situation is not enough bullish to go long at the moment. So, no positions are justified from the risk/reward perspective. We will keep you informed should anything change, or should we see a confirmation/invalidation of the above.
USD/CAD
Quoting our last Forex Trading Alert:
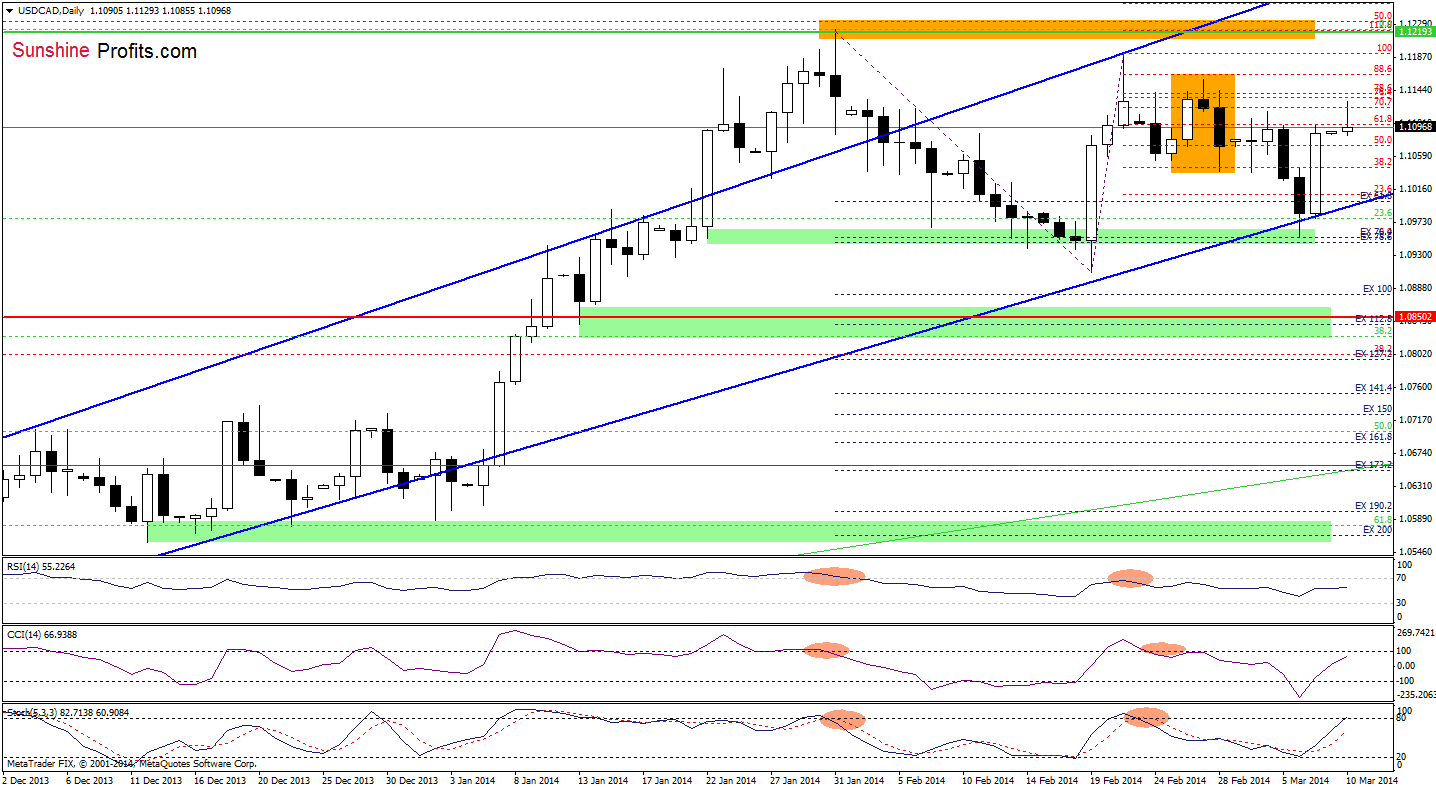
(…) the exchange rate erased over 50% of earlier losses and it seems that we may see further improvement – especially when we factor in the current position of the indicators (the CCI and Stochastic Oscillator generated buy signals, which support buyers at the moment). If the buyers do not give up, we will likely see an increase to the March 4 high or even to the Feb.27 high (as a reminder this is also a top of a bearish candlestick pattern – an evening star) in the near future.
Looking at the above chart, we see that USD/CAD extended gains and reached its first upside target - March 4 high (with this upswing, the pair also broke above the 70.7% Fibonacci retracement). If the buyers do not give up, we may see further improvement – to the next upside target. All indicators are not overbought and support buyers.
Very short-term outlook: bullish
Short-term outlook: mixed with bullish bias
MT outlook: bullish
LT outlook: bearish
Trading position (short-term): In our opinion no positions are justified from the risk/reward perspective. We will keep you informed should anything change, or should we see a confirmation/invalidation of the above.
USD/CHF
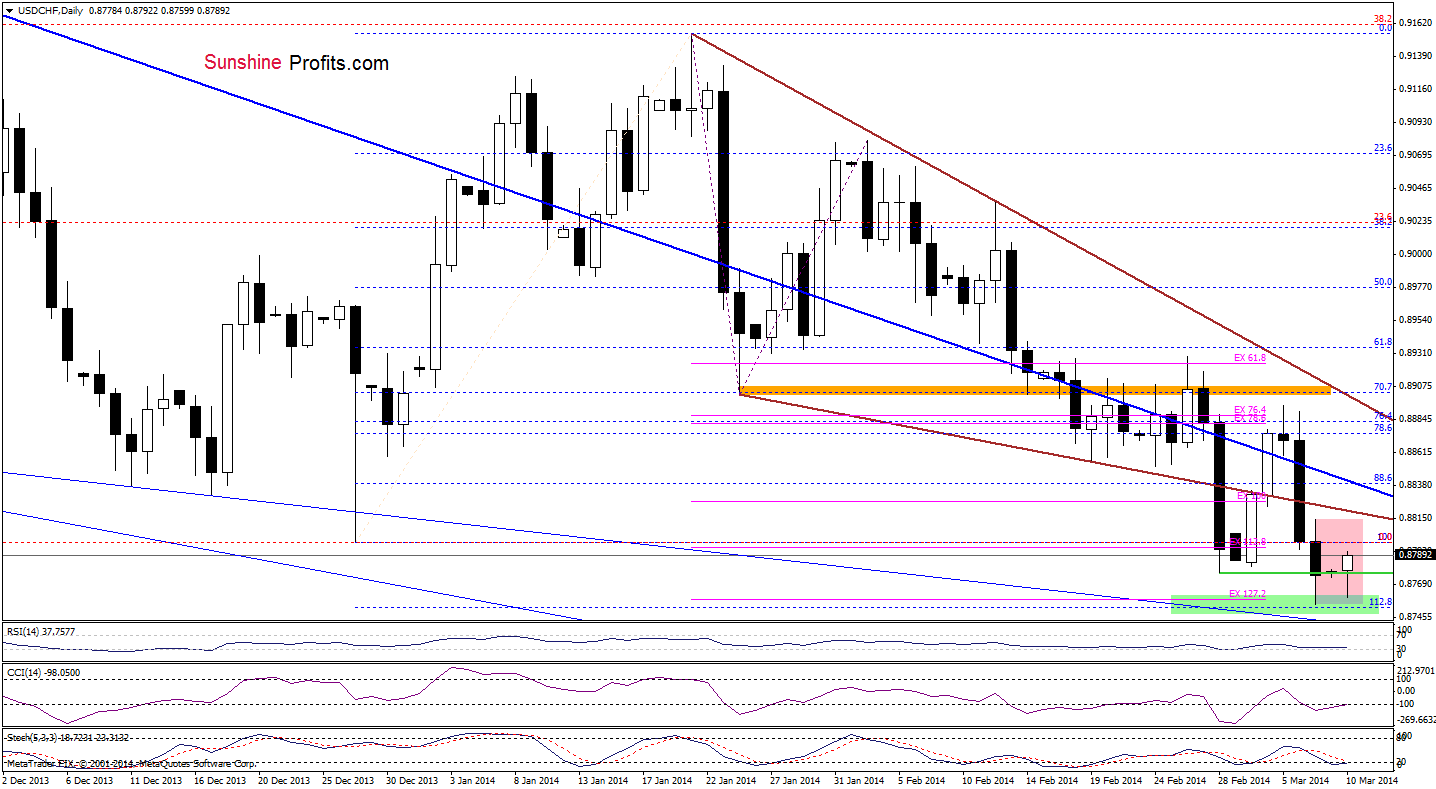
As you see on the above chart, the situation hasn’t changed much as USD/CHF remains between Friday high and low. So, what we wrote in our last Forex Trading Alert is still up-to-date.
(…) USD/CHF declined sharply, broke below the February low and reached the support zone. If this support encourages buyers, we may see an attempt to break above the lower border of the declining wedge. However, if they fail, we will likely see a drop to the medium-term thin blue support line (currently around 0.8743).
Please note that the indicators are oversold and very close to generating buy signals, which is the first bullish signal. Is it possible that we’ll find more bullish signs on the 4-hour chart? Let’s take a look.
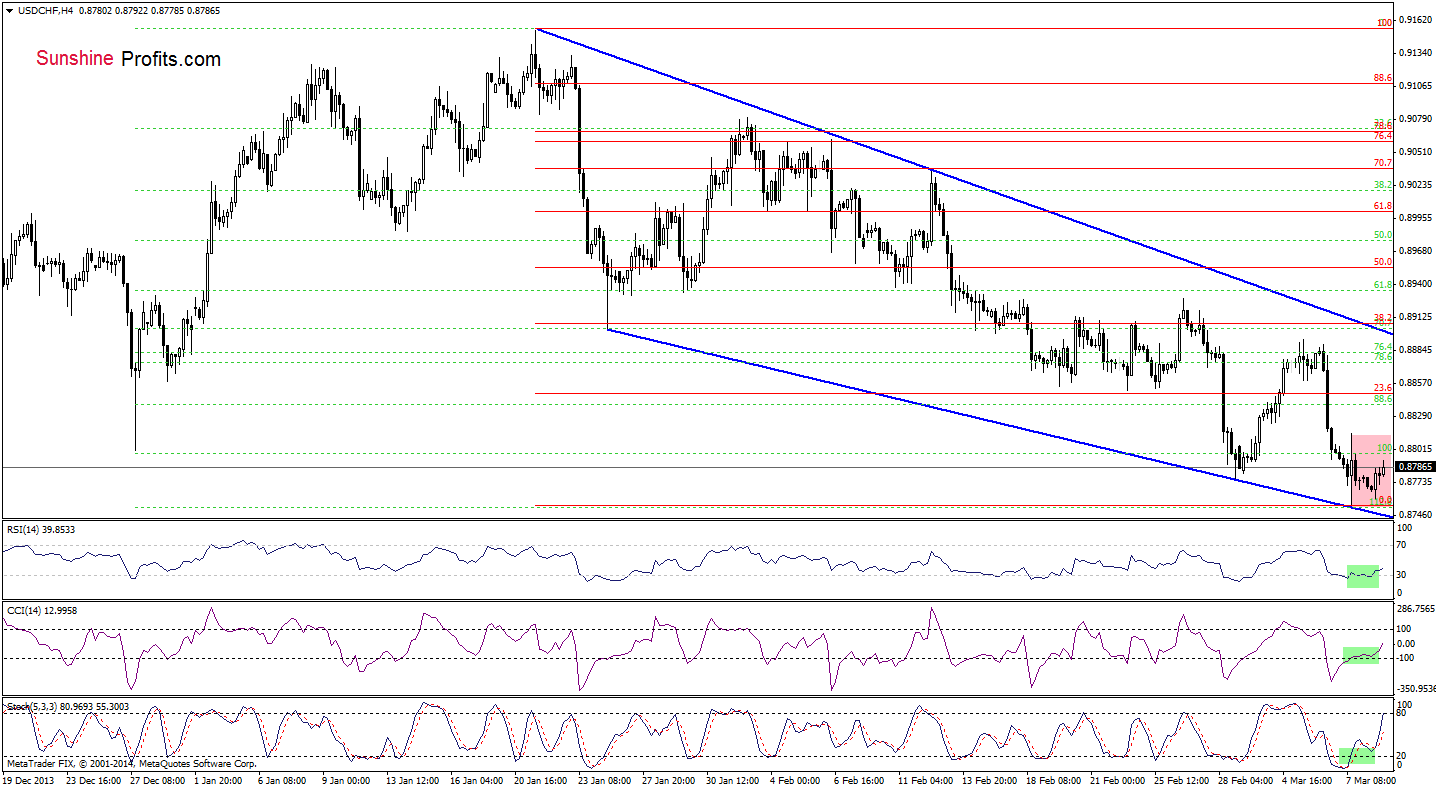
From this perspective, we see that the support zone marked on the daily chart is reinforced by the upper line of the declining trend channel. Additionally, all indicators generated by signals, which suggests further improvement in the following hours. Despite these positive signals, as long as the pair remains below the lower border of the declining wedge (marked with brown on the daily chart) and the short-term declining resistance line, a bigger corrective upswing is not likely to be seen.
Very short-term outlook: mixed
Short-term outlook: bearish
MT outlook: bearish
LT outlook: bearish
Trading position (short-term): In our opinion, the situation is too unclear to go long or short at the moment. We will keep you informed should anything change, or should we see a confirmation/invalidation of the above.
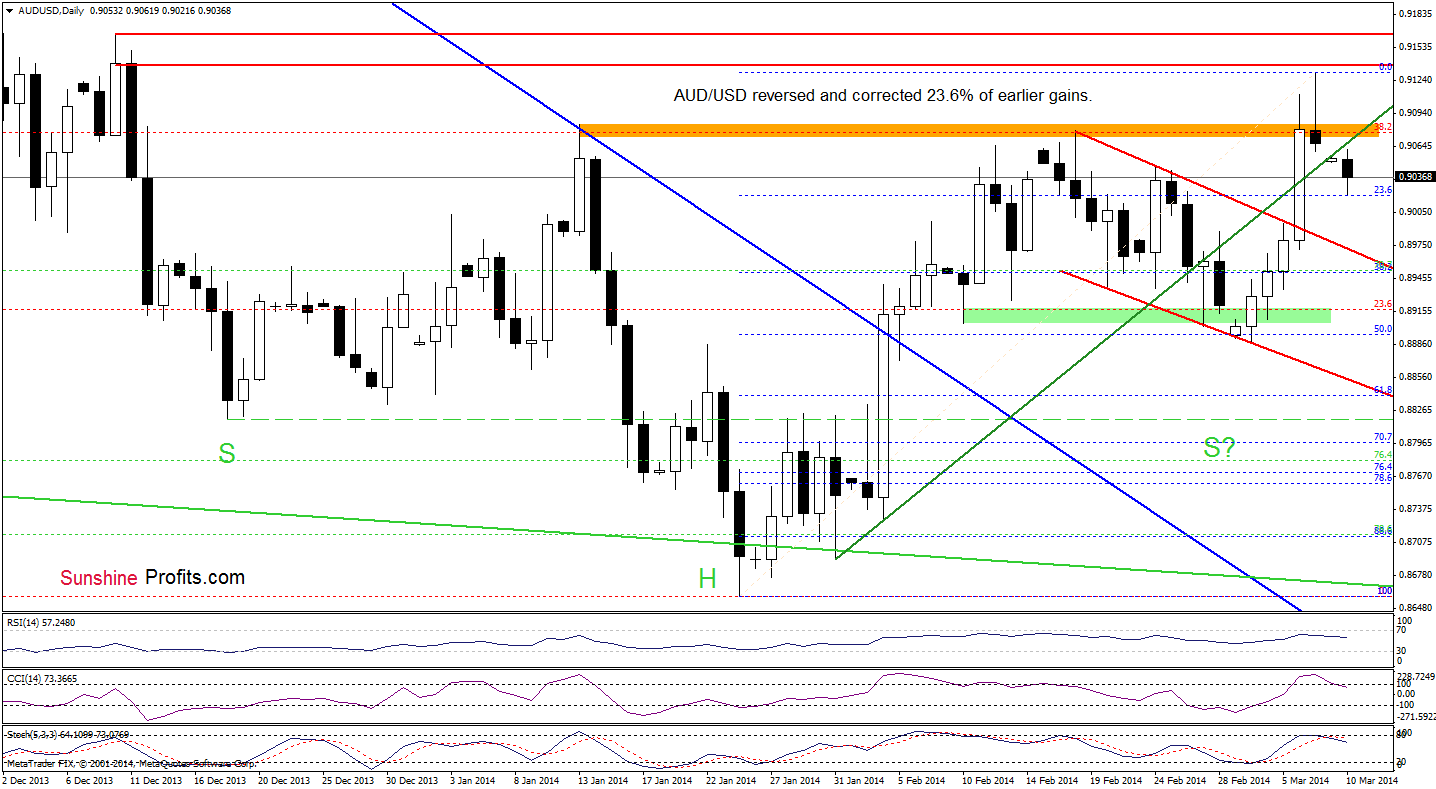
AUD/USD
In our last Forex Trading Alert, we wrote the following:
(…) AUD/USD (…) approached the resistance zone. (…) if it encourages sellers to act, we will likely see a pullback to the previously-broken green line, which serves as support at the moment. (…) When we take a closer look at the position of the indicators, we see that the CCI and Stochastic Oscillator are overbought, which suggests that the space for further growth may be limited in the coming days.
Looking at the above chart, we see that the exchange rate gave up the gains and declined below the green line, which is the first bearish sign. As you see on the daily chart, with this downswing, AUD/USD reached the 23.6% Fibonacci retracement based on the entire rally. If this support level encourage buyers to act, we may see a corrective upswing to the green resistance line. However, if they fail, we will likely see further deterioration and the first downside target will be the previously-broken upper line of the trend channel. When we take a closer look at the position of the indicators, we see that they reversed and support sellers (the CCI and Stochastic generated sell signals), which suggests that a bearish scenario is more likely.
Very short-term outlook: mixed
Short-term outlook: bullish
MT outlook: bearish
LT outlook: bearish
Trading position (short-term): In our opinion no positions are justified from the risk/reward perspective at the moment. We will keep you informed should anything change, or should we see a confirmation/invalidation of the above.
Thank you.
Nadia Simmons
Forex & Oil Trading Strategist
Forex Trading Alerts
Oil Investment Updates
Oil Trading Alerts

