

Earlier today, the euro extended gains against the greenback, which pushed EUR/USD above two previously-broken Fibonacci levels. What will happen if the pair closes the week above them?
In our opinion the following forex trading positions are justified - summary:
- EUR/USD: none
- GBP/USD: short (a stop-loss order at 1.3272; the initial downside target at 1.2375)
- USD/JPY: none
- USD/CAD: none
- USD/CHF: none
- AUD/USD: none
EUR/USD
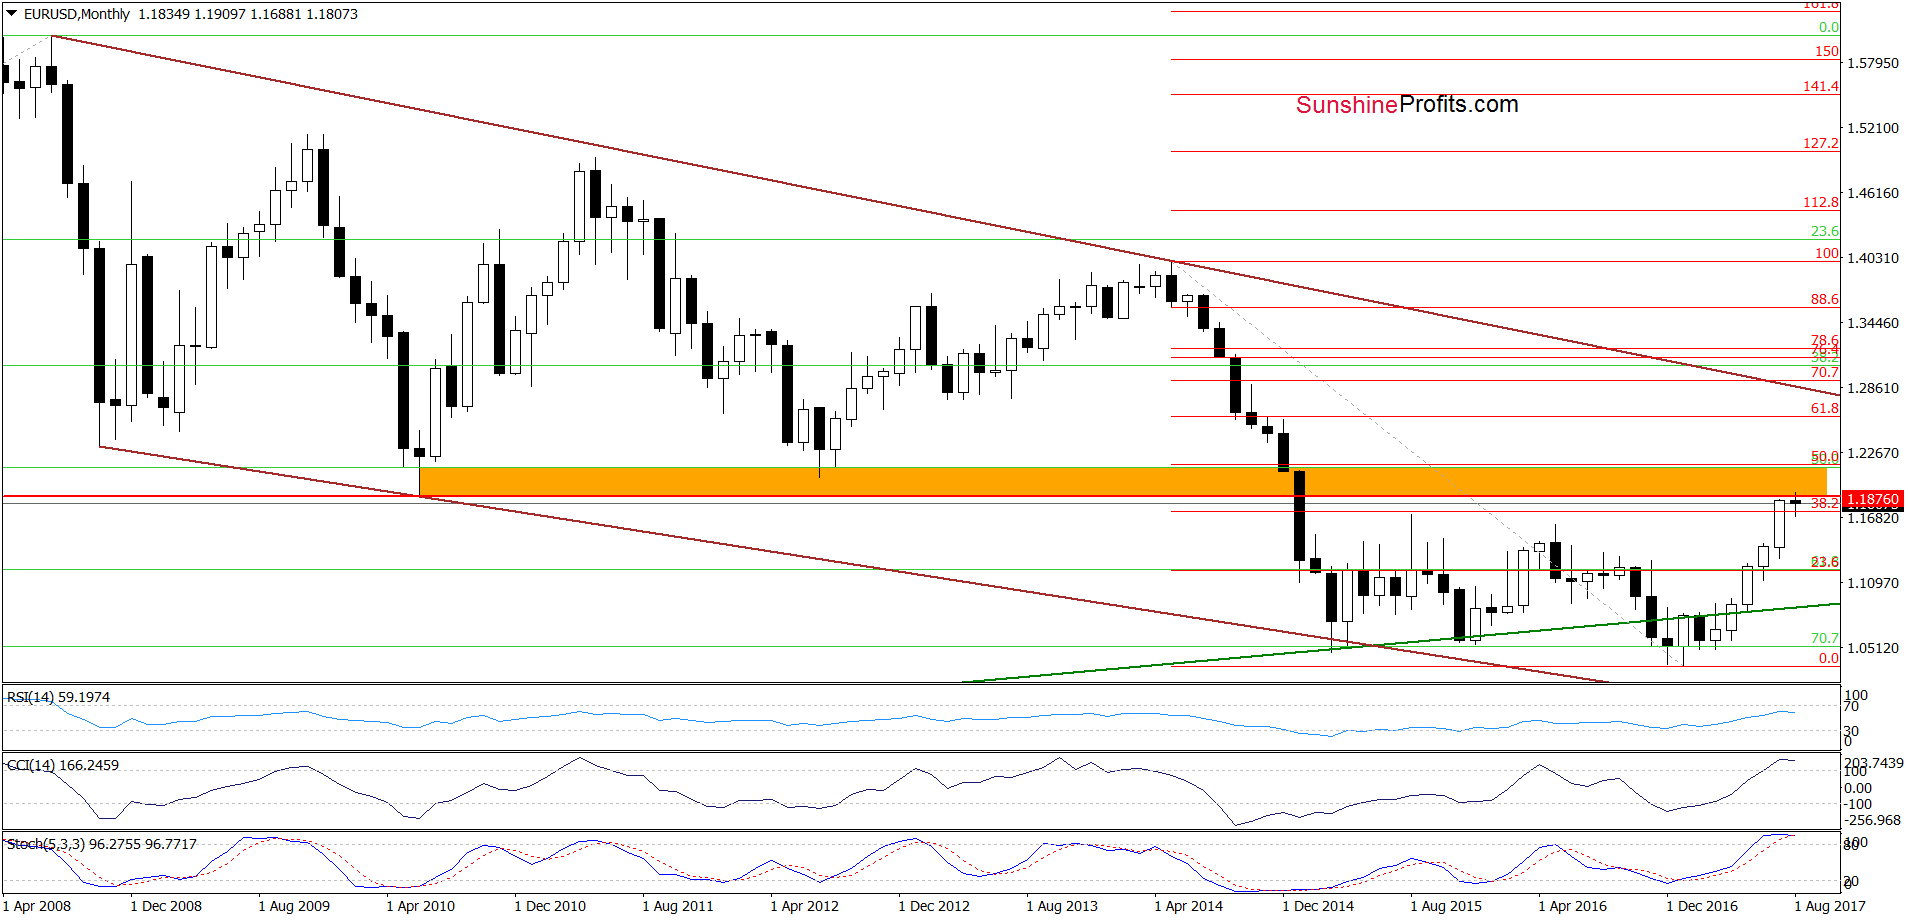
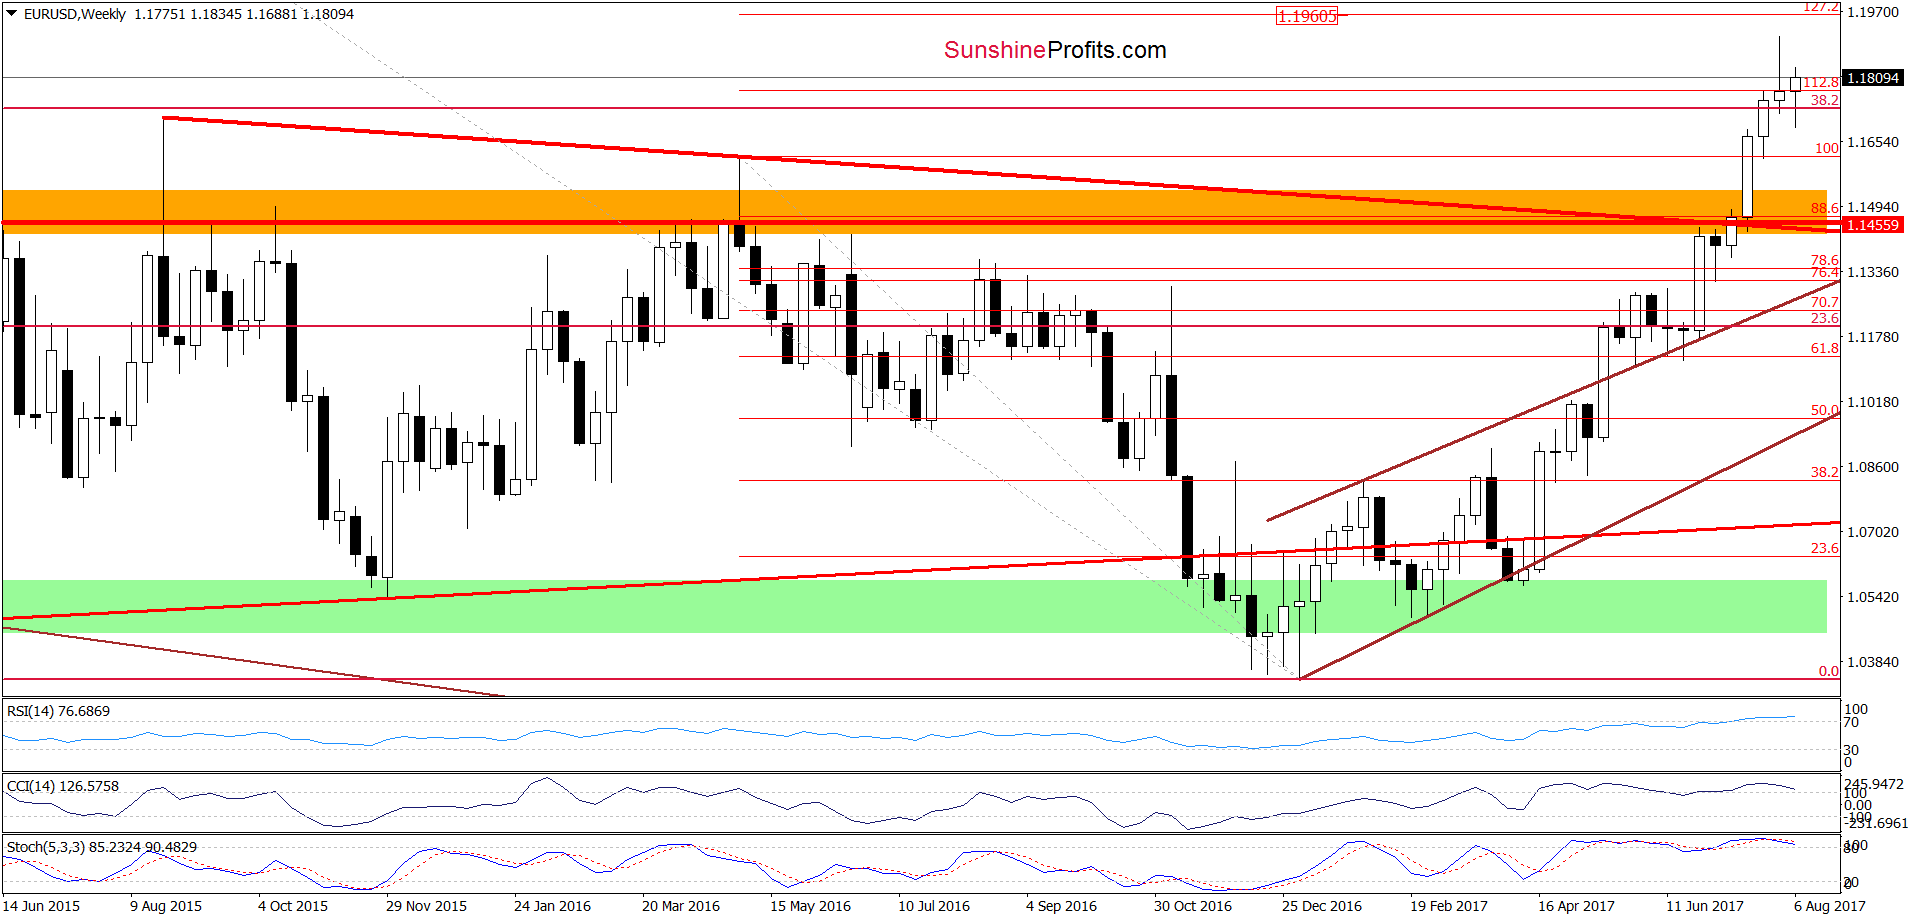
From today’s point of view, we see that EUR/USD bounced off this week’s low and increased above the previously-broken 38.2% Fibonacci retracement and the 112.8% Fibonacci extension. In this way, the exchange rate invalidated the earlier breakdown below these levels, which is a positive development. If the pair closes the whole week above them, we’ll likely see a test of the last week’s high or even the 127.2% Fibonacci extension in the coming week.
Very short-term outlook: mixed
Short-term outlook: mixed with bearish bias
MT outlook: mixed
LT outlook: mixed
Trading position (short-term; our opinion): No positions are justified from the risk/reward perspective. We will keep you informed should anything change, or should we see a confirmation/invalidation of the above.
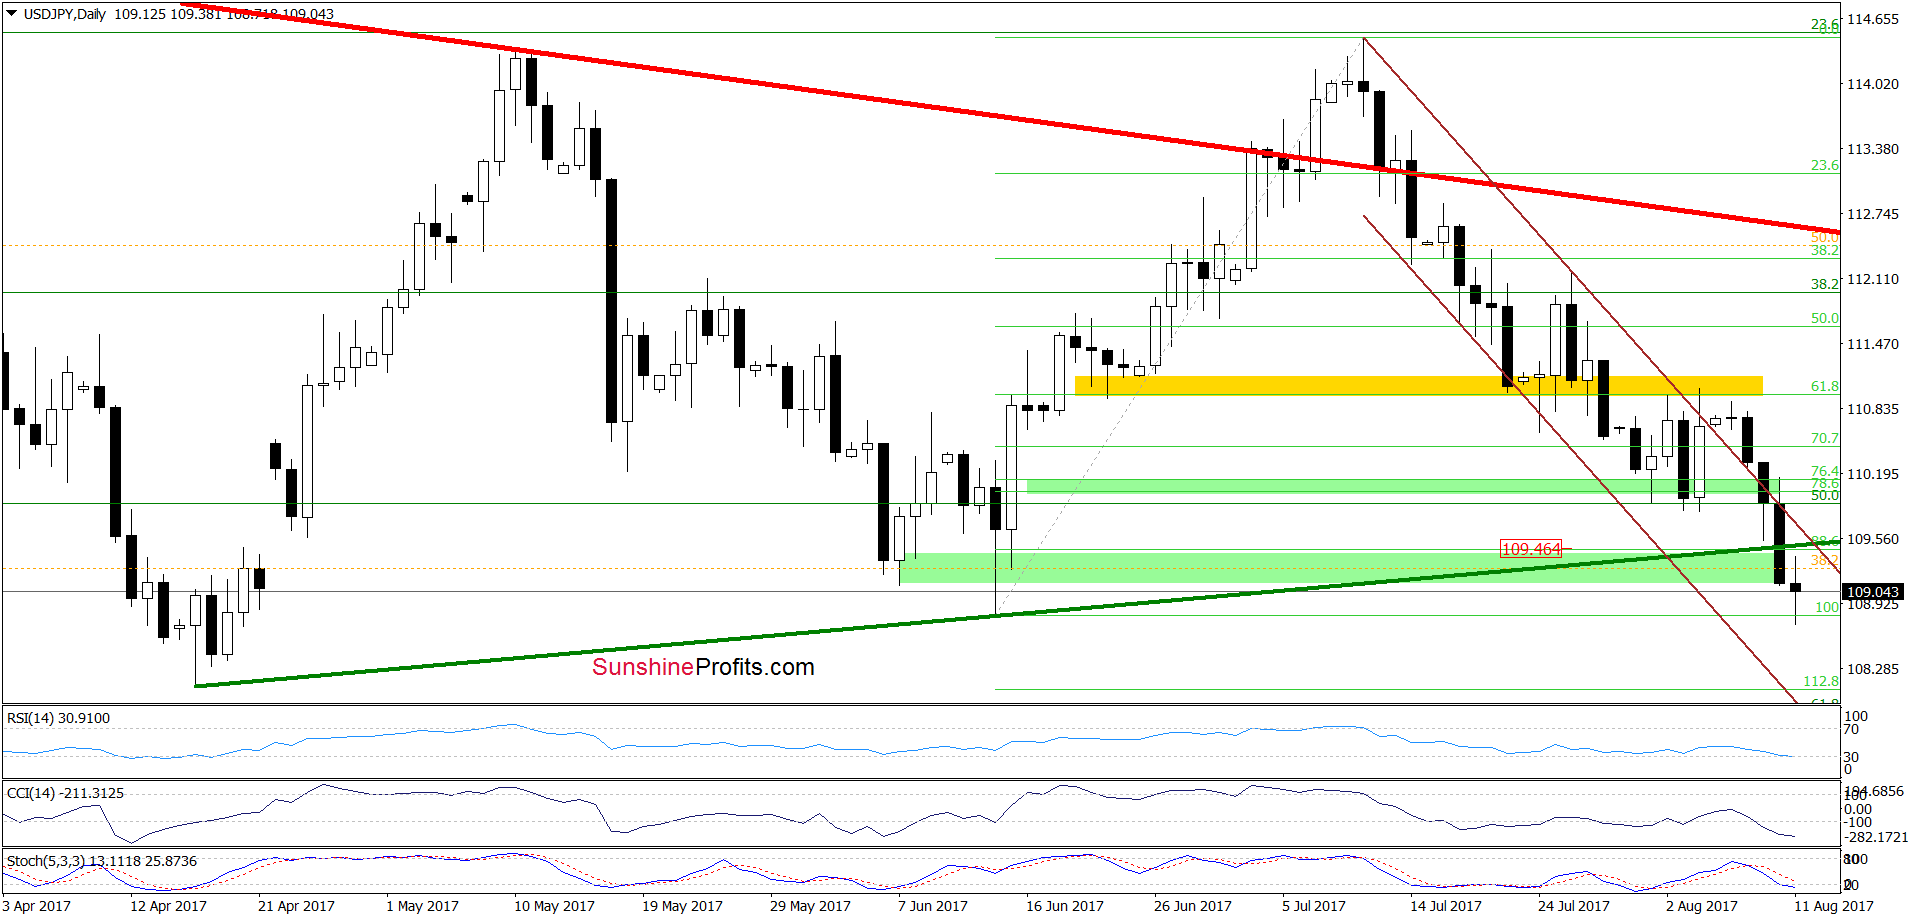
USD/JPY
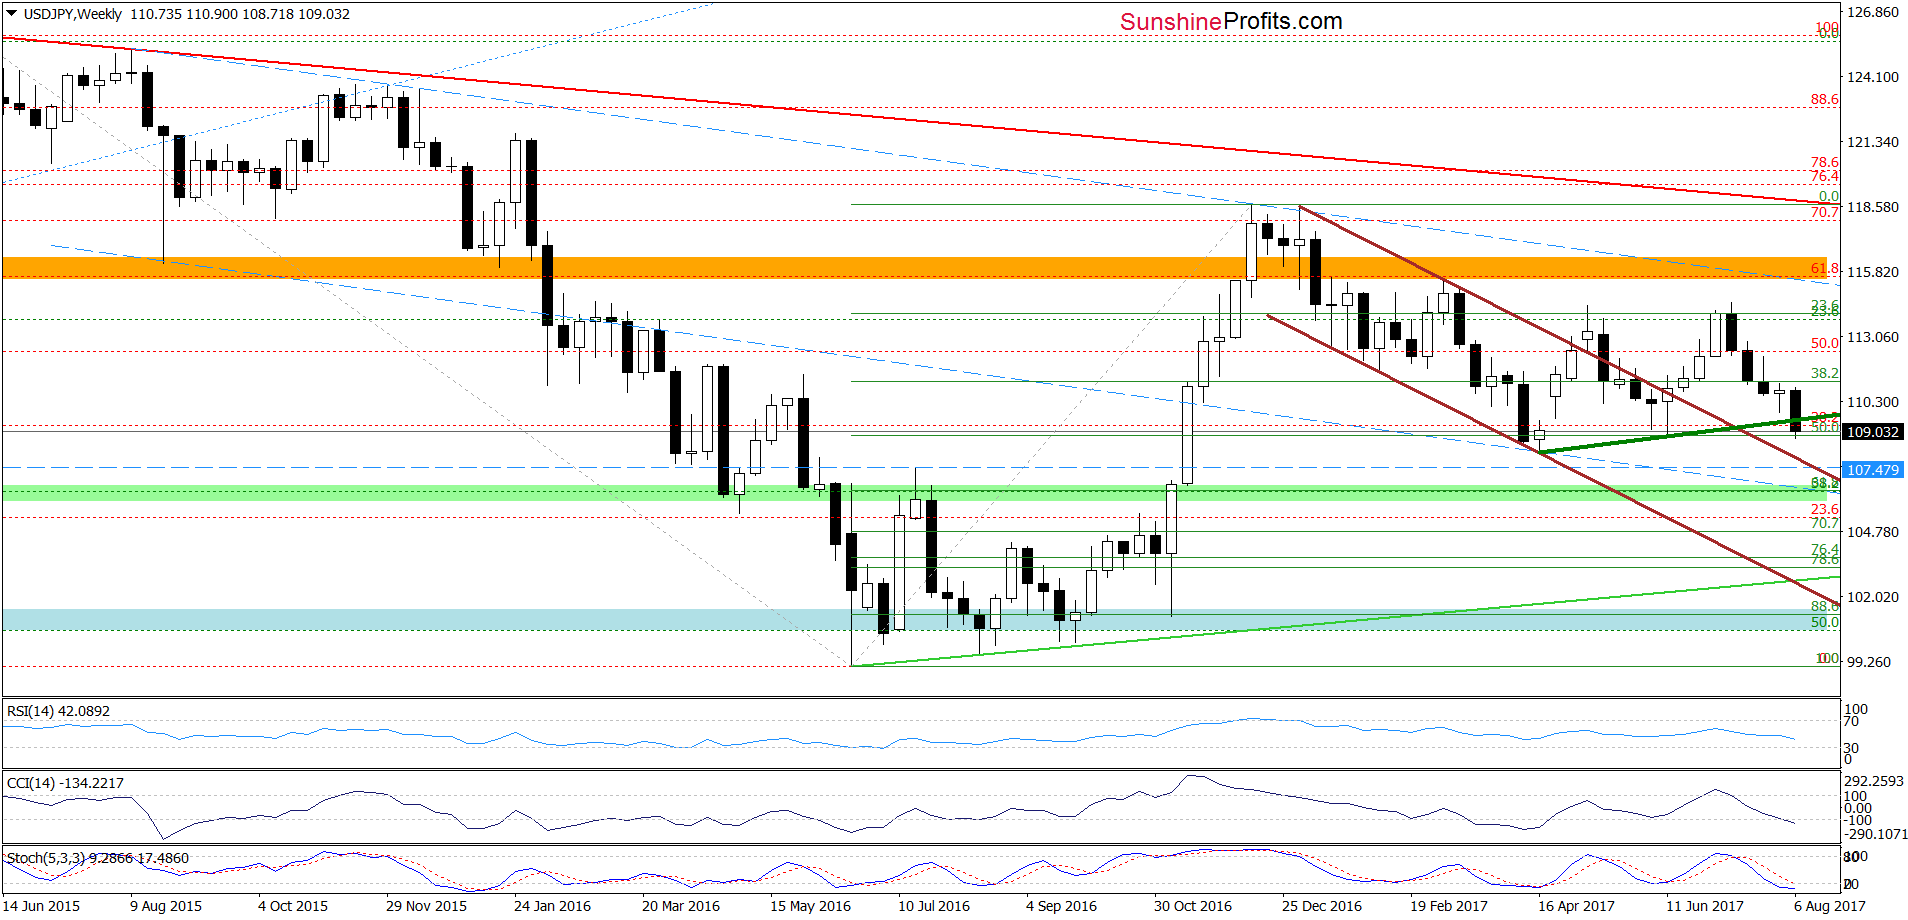
In our Forex Trading Alert posted on August 2, 2017, we wrote the following:
(…) What could happen if USD/JPY drops under the 76.4% and 78.6% Fibonacci retracements? In our opinion, we may see a drop to around 109.46, where the upper border of the next green support zone and the medium-term green support line based on the previous lows are.
On Wednesday, we added:
(…) please note that if the above-mentioned green zone is broken, the way to the mid-June low will be open.
Looking at the charts we see that the situation developed in line with the above scenario and USD/JPY extended losses. As a result, the exchange rate slipped below the mid-June low, which doesn’t bode well for currency bulls – especially when we factor in the fact that there are no buy signals, which could encourage them to act. Therefore, if the pair closes the week under the medium-term green support line based on the previous lows and the mid-June low, we’ll likely see further deterioration and a test of the April low or even the lower border of the brown declining trend channel in the coming week.
Very short-term outlook: bearish
Short-term outlook: mixed
MT outlook: mixed
LT outlook: mixed
Trading position (short-term; our opinion): No positions are justified from the risk/reward perspective at the moment. We will keep you informed should anything change, or should we see a confirmation/invalidation of the above.
AUD/USD
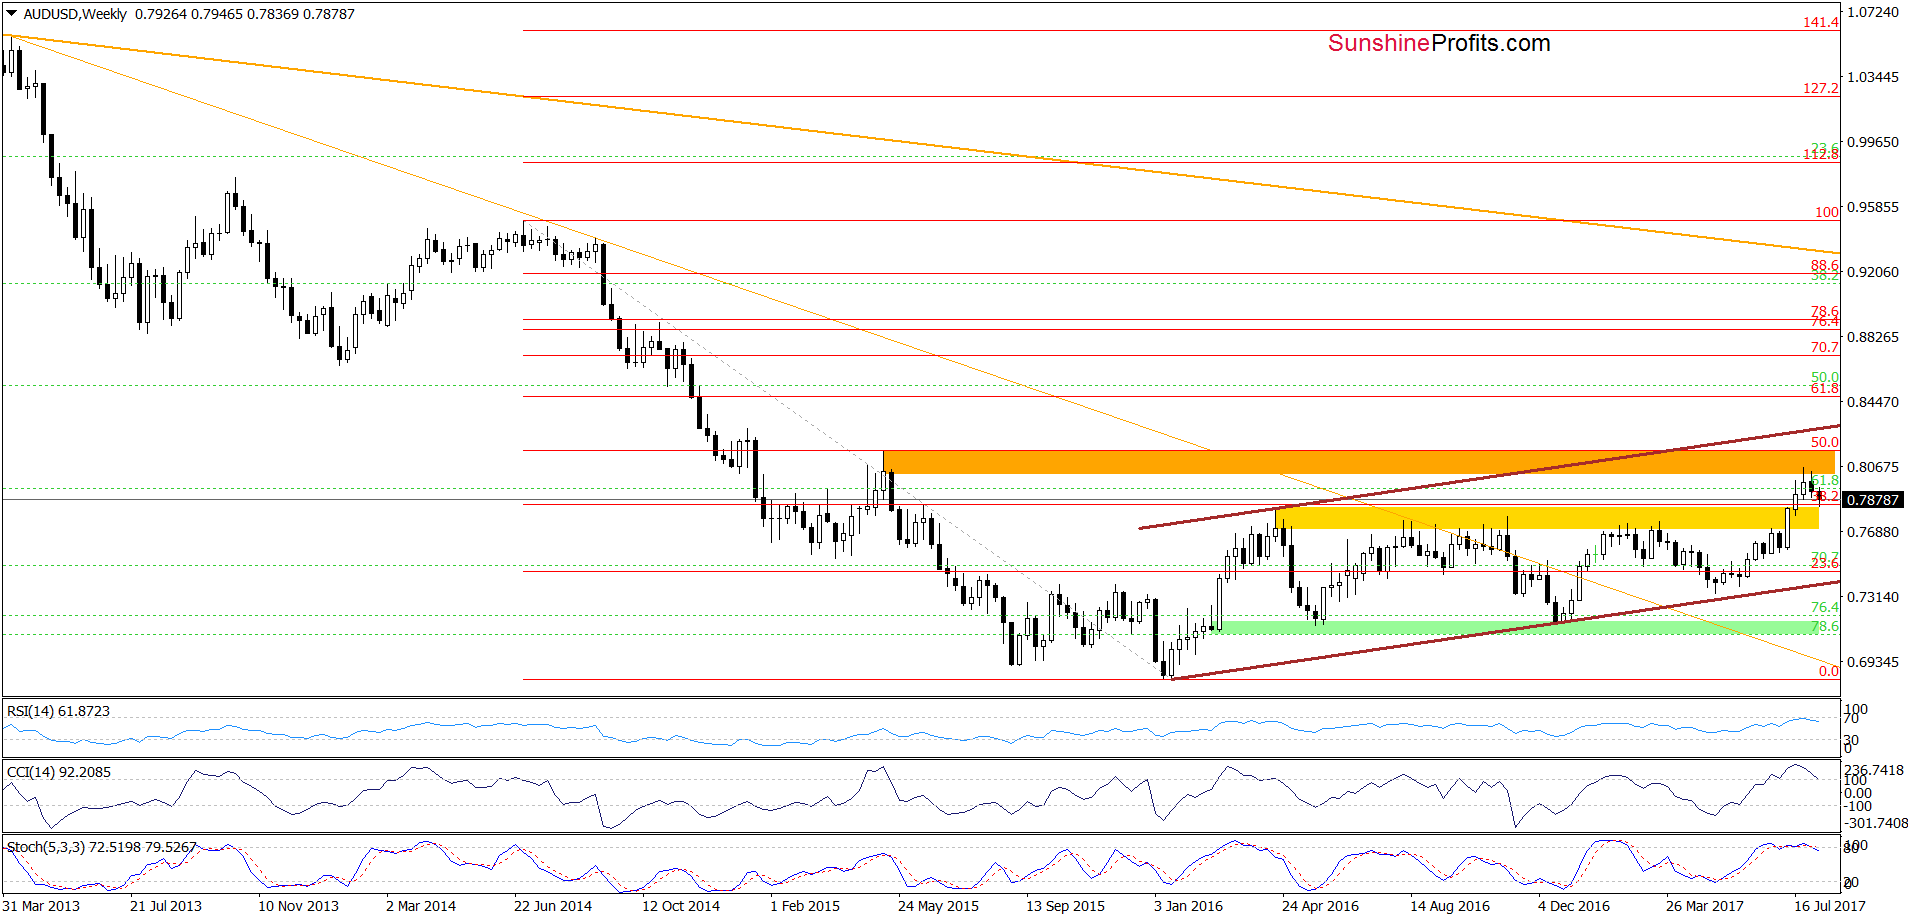
From the medium-term perspective, we see that the situation hasn’t changed much as AUD/USD wavers between the orange resistance zone and the previously-broken yellow zone based on the mid-April and November 2016 highs. This suggests that as long as there is no drop below these levels and invalidation of the breakout above them another sizable move to the downside is not likely to be seen. Nevertheless, if we see such decline, we’ll consider opening short positions.
Very short-term outlook: mixed
Short-term outlook: mixed with bearish bias
MT outlook: mixed
LT outlook: mixed
Trading position (short-term; our opinion): No positions are justified from the risk/reward perspective. We will keep you informed should anything change, or should we see a confirmation/invalidation of the above.
Thank you.
Nadia Simmons
Forex & Oil Trading Strategist
Przemyslaw Radomski, CFA
Founder, Editor-in-chief, Gold & Silver Fund Manager
Gold & Silver Trading Alerts
Forex Trading Alerts
Oil Investment Updates
Oil Trading Alerts

