

Up and down and turn around - in these six simple words we can sum up the last price action in EUR/USD. This small volatility, however, will not last forever. We found something interesting on the USD Index chart, which can bring a breakthrough in the coming day(s).
In our opinion the following forex trading positions are justified - summary:
- EUR/USD: none
- GBP/USD: short (a stop-loss order at 1.4549; the initial downside target at 1.4000)
- USD/JPY: none
- USD/CAD: short (a stop-loss order at 1.2852; the next downside target at 1.2510)
- USD/CHF: none
- AUD/USD: none
EUR/USD
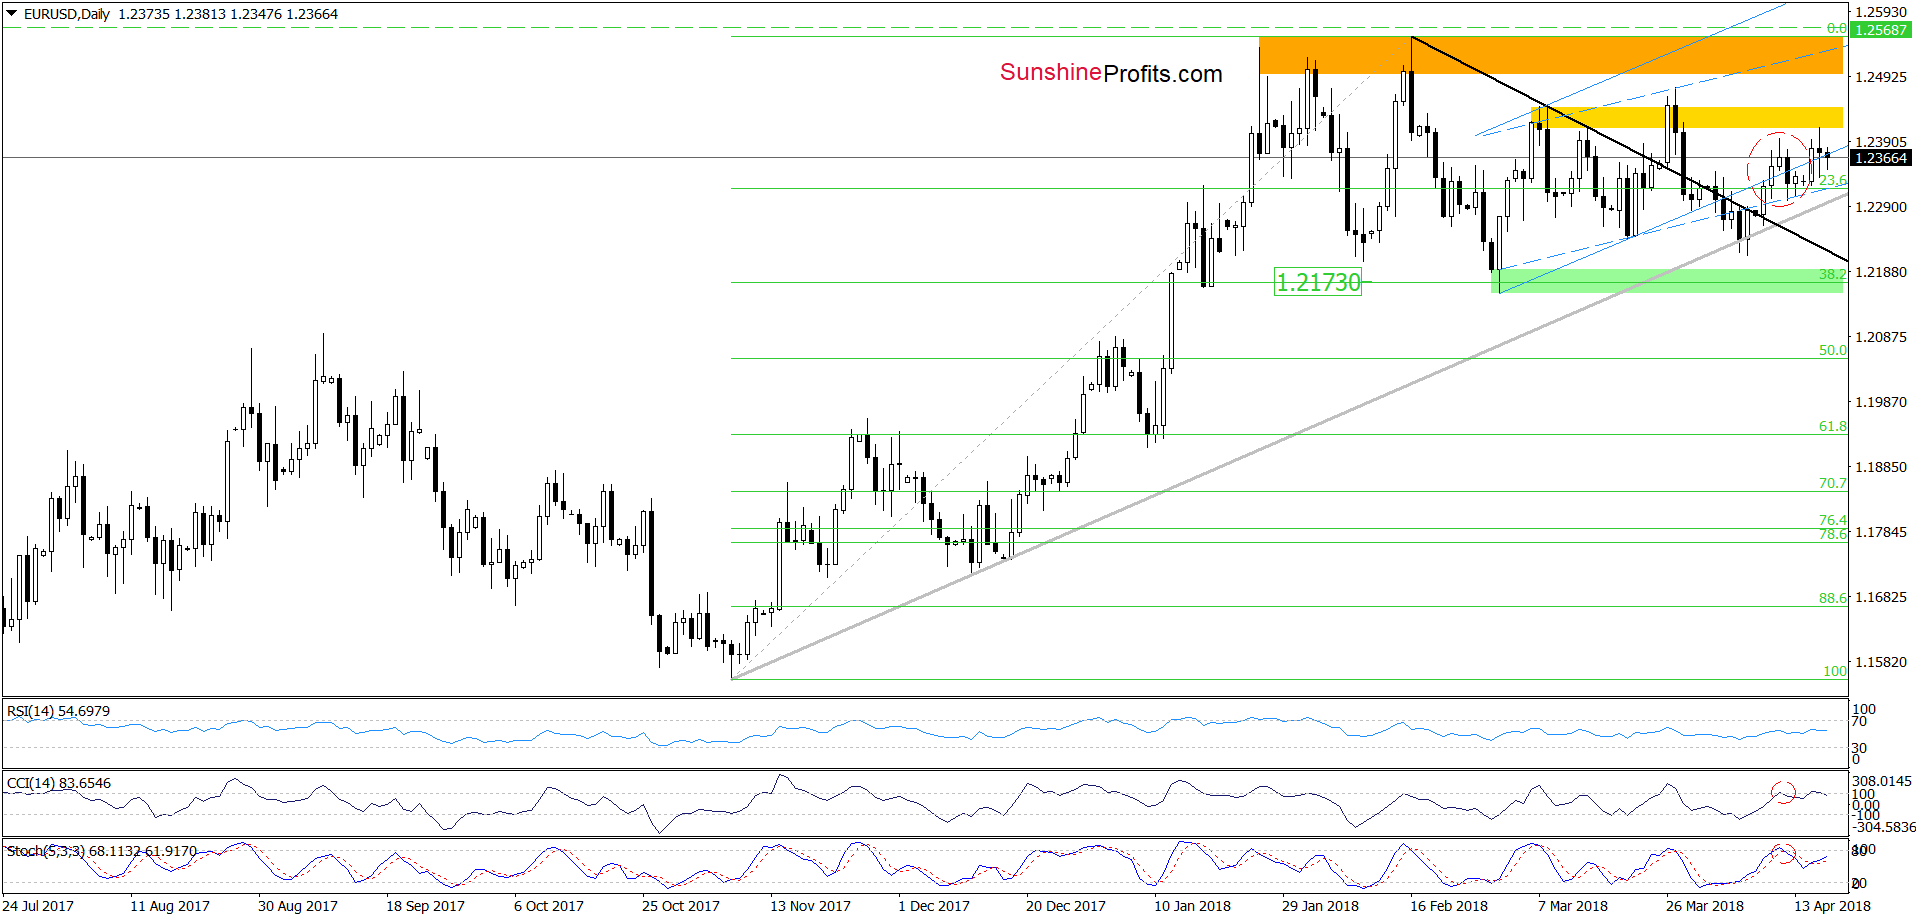
On the daily chart, we see that the yellow resistance zone stopped currency bulls and triggered a pullback yesterday. Earlier today, the exchange rate moved a bit lower once again, which looks (at least at the moment of writing these words) like the sellers want to create another pro-bearish formation (one more evening star).
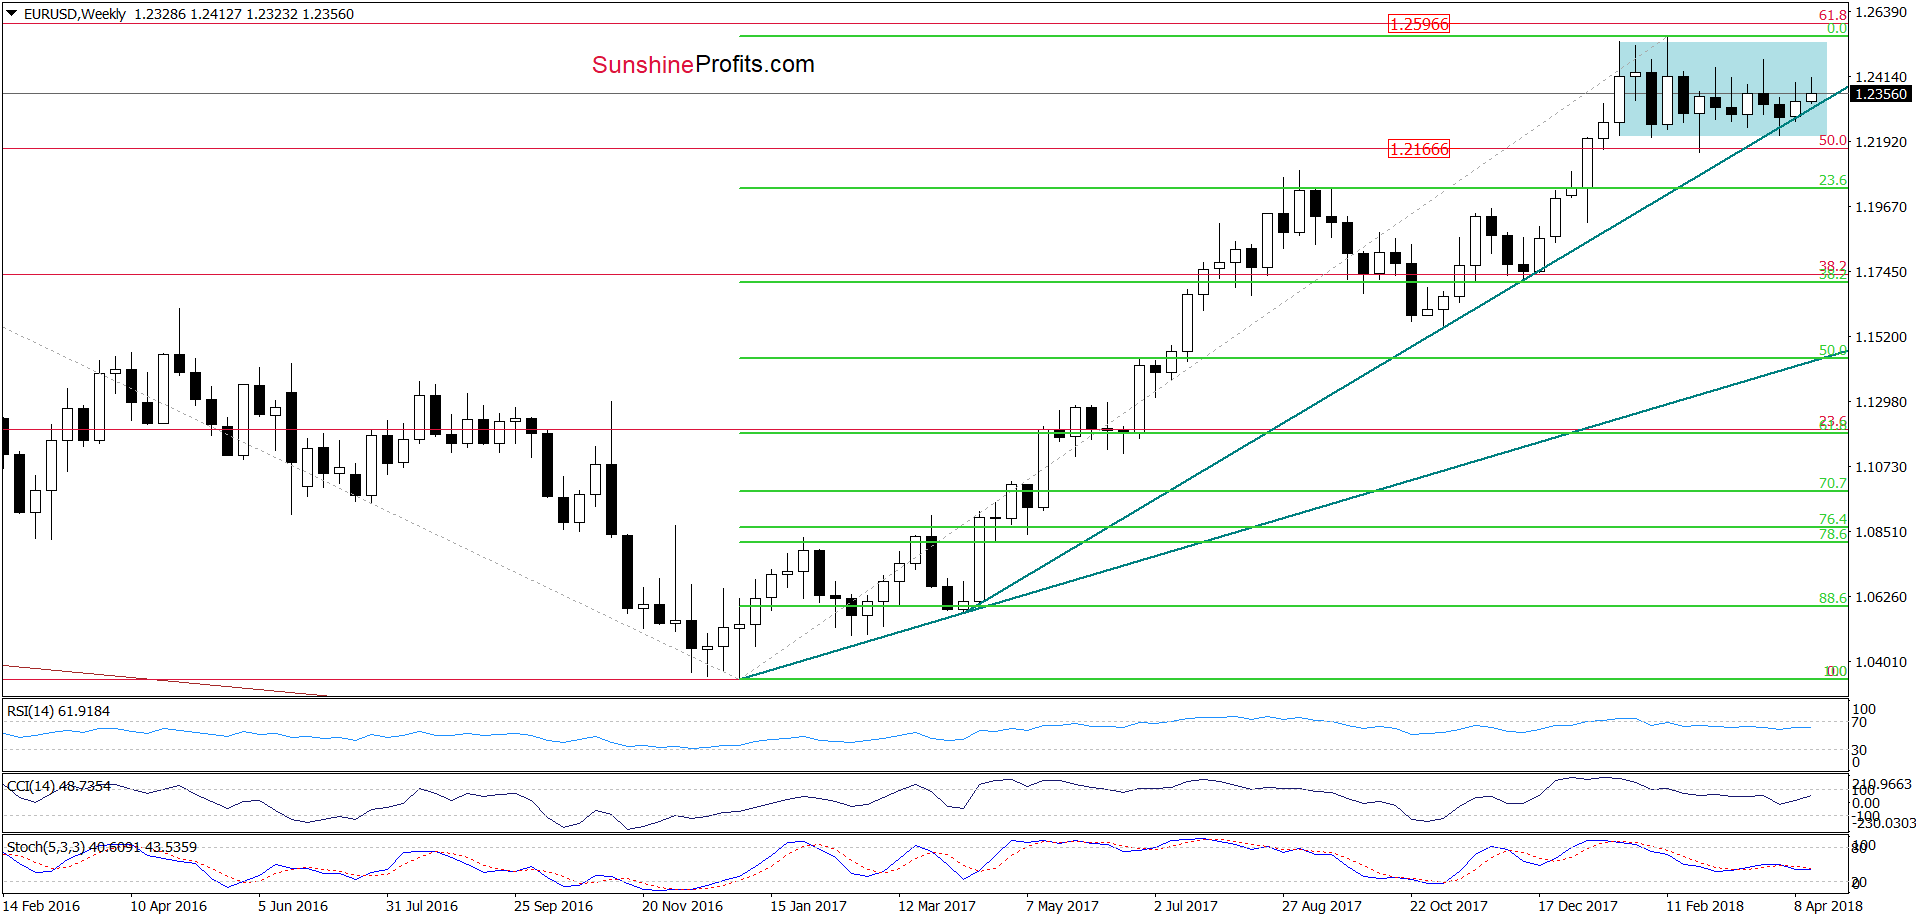
Nevertheless, even if they manage to do it, we think that as long as the exchange rate is trading above the medium-term grey support line (seen on the daily chart) and the long-term green line, which intersects the blue consolidation (marked on the weekly chart below) a bigger move to the downside is not likely to be seen.
This scenario is also supported by the current situation in the USD Index.
Greenback – More of the Same
On Monday, we wrote the following:
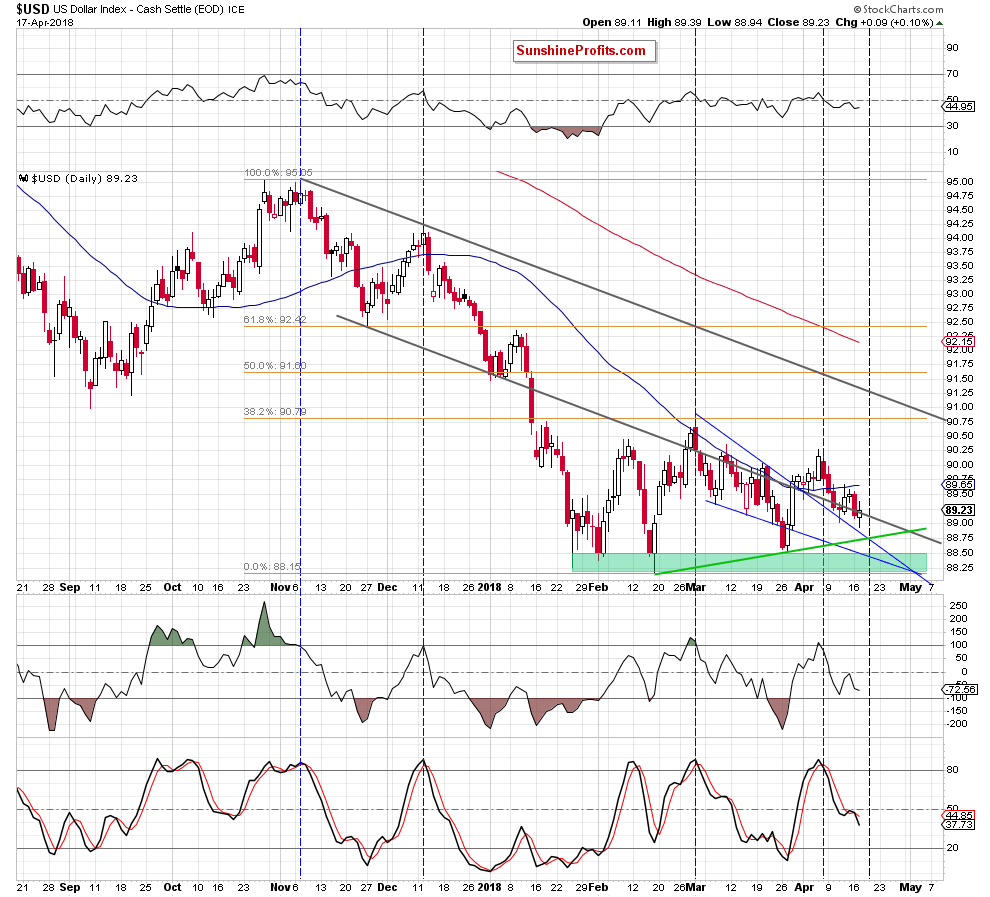
(…) the Stochastic Oscillator generated a buy signal, suggesting another attempt to move higher. Is this a positive sign? Yes. Can we trust it? In our opinion, not yet. Why? Because we already saw similar consolidation slightly above the lower grey line at the turn of March and April. (…)
From today’s point of view, we see that the buyers failed once again, and the USD Index slipped under the lower border of the grey declining trend channel at the beginning of the week. Despite this deterioration, the proximity to the upper border of the blue wedge was enough to trigger another upswing, which is a repeat of what we already earlier this month.
When we finally can see a breakthrough?
In our opinion, probably tomorrow. Why? When we take a closer look at the daily chart, we can notice a triangle created by the resistance line based on the March peaks (the upper border of the blue declining wedge) and the green support line based on February and March lows. What does it mean for the greenback? Triangle apex reversal pattern. As you see on the chart, the most recent short-term move was down, so the implications of this formation are bullish.
Nevertheless, pro-growth scenario will be more likely and reliable if the greenback shows more strength (like a daily closure above the 50-day moving average) in the near future.
Taking all the above into account and combining it with the medium-term support line marked on the weekly chart of EUR/USD we think that waiting at the sidelines for another opportunity is justified from the risk/reward perspective. We will monitor the forex market and keep you informed should we see a confirmation/invalidation of the above.
Having said that, let’s focus on the GBP/USD and AUD/USD.
GBP/USD
Quoting our last commentary on this currency pair:
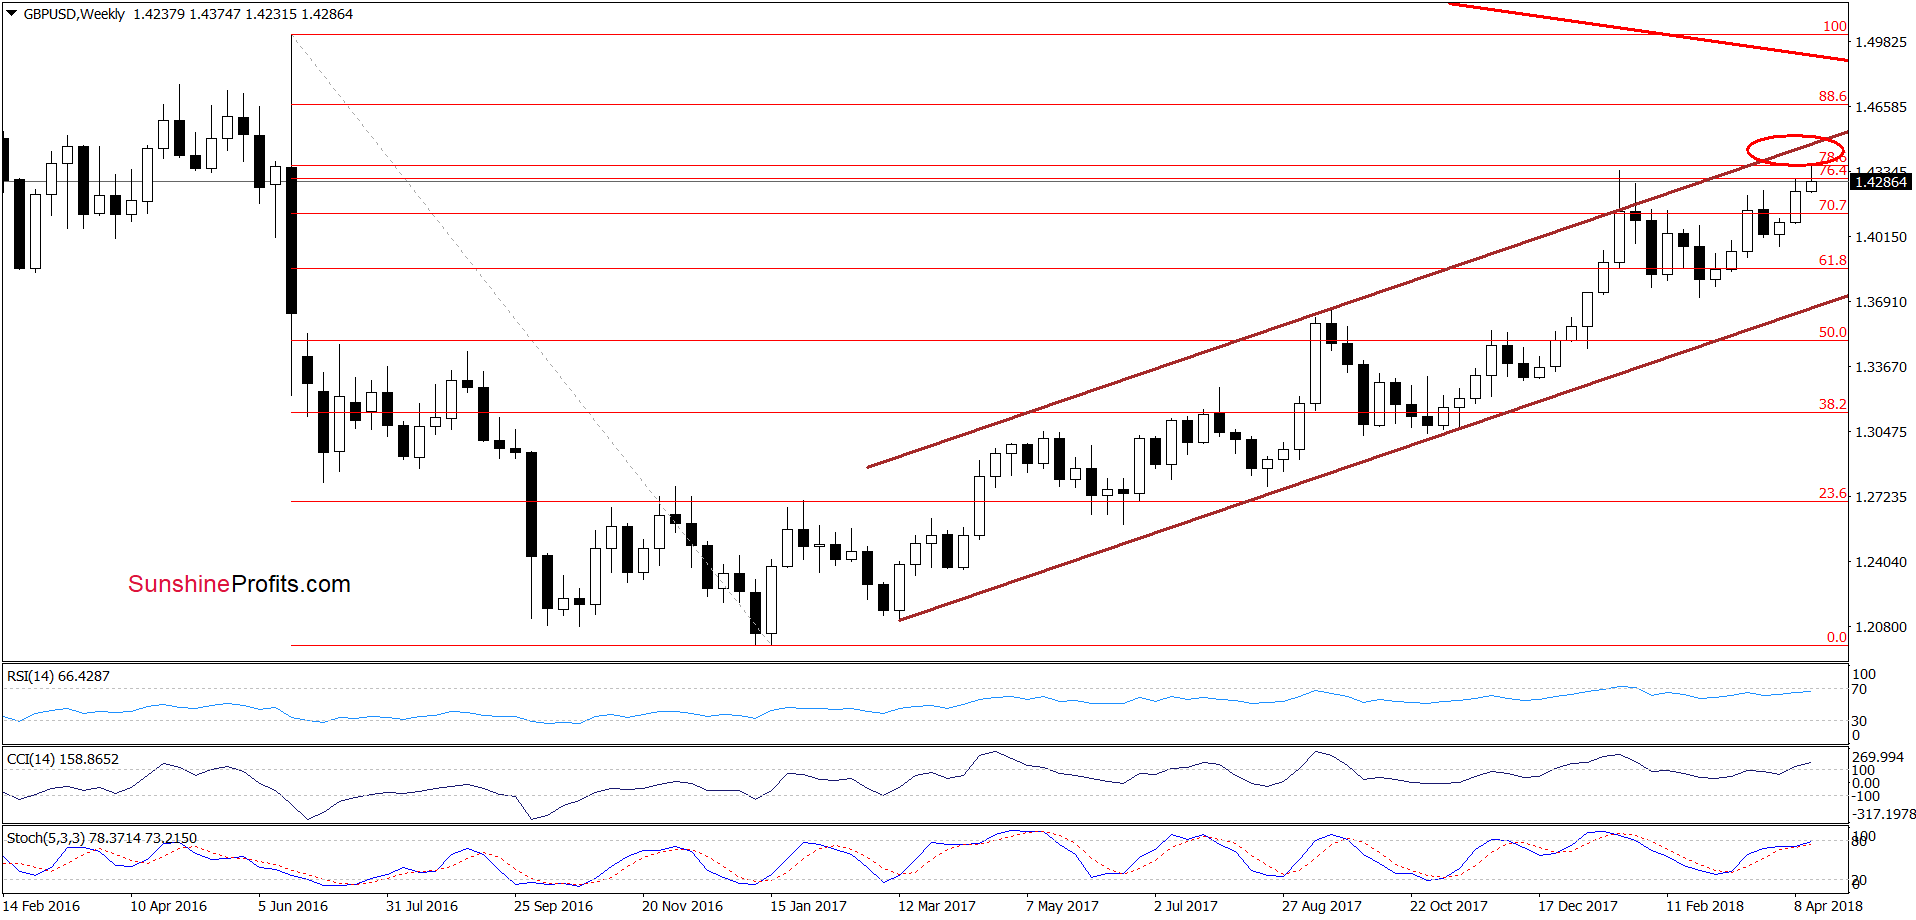
(…) the buyers tried to move higher on Friday, which resulted in a short-lived breakout above the medium-term brown line.
Although they failed, the RSI and the CCI didn’t generate the sell signals, which together with the buy signals generated by the weekly indicators, suggests that one more upswing can’t be ruled out.
What impact could in have on the exchange rate?
In our opinion, if the pair moves higher once again, it could re-test the previous 2018 peak (and the 78.6% Fibonacci retracement) or even the upper border of the brown rising trend channel in the coming week (we marked this area with the red ellipse).
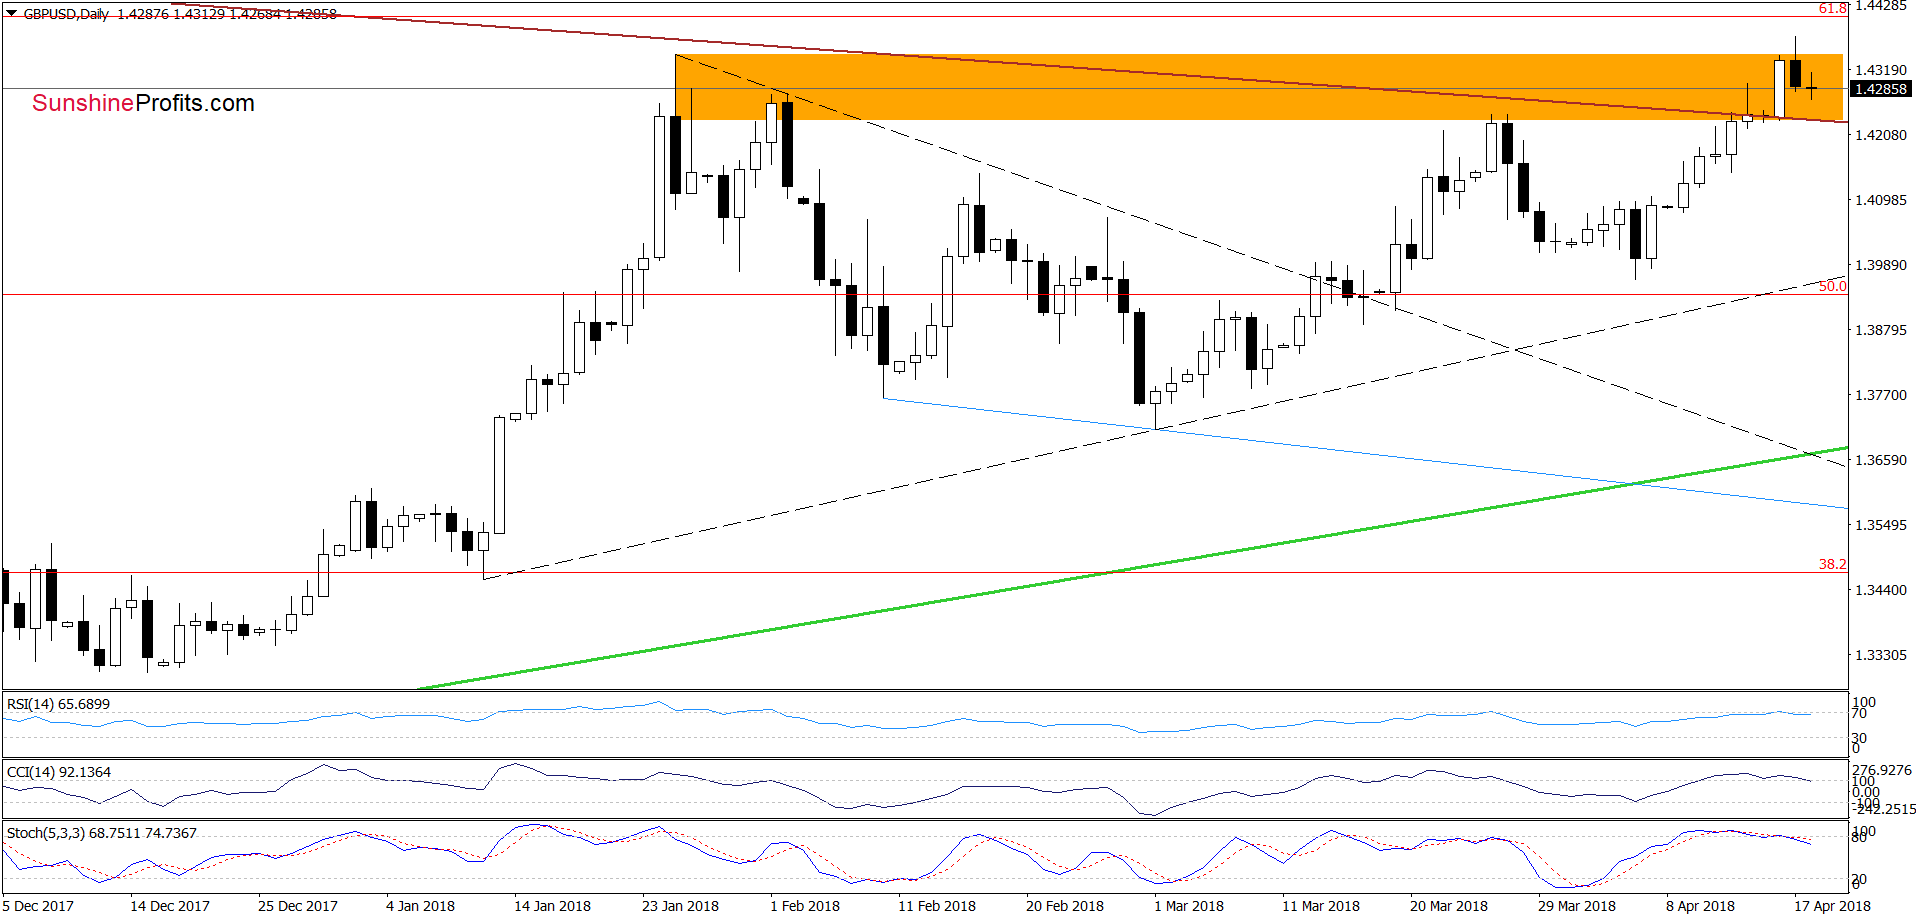
On the daily chart, we see that the situation developed in line with our assumptions and GBP/USD extended gains on Monday, touching our next upside target - the 78.6% Fibonacci retracement. Despite this improvement, currency bulls didn’t manage to hold gained levels, which resulted in a pullback and a comeback below the January peak.
In this way, the exchange rate invalidated the earlier breakout (a sign of weakness), which in combination with the above-mentioned strong resistance zone, the sell signals generated by all daily indicators and potential reversal in the USD Index increases the probability of another move to the downside.
Taking these facts into account we think that opening short positions is justified from the risk/reward perspective as GBP/USD could decline to (at least) the bottom of the previous correction (around 1.4000) in the coming days.
Trading position (short-term; our opinion): Short positions (with a stop-loss order at 1.4549 and the initial downside target at 1.4000) are justified from the risk/reward perspective. We will keep you informed should anything change, or should we see a confirmation/invalidation of the above.
AUD/USD
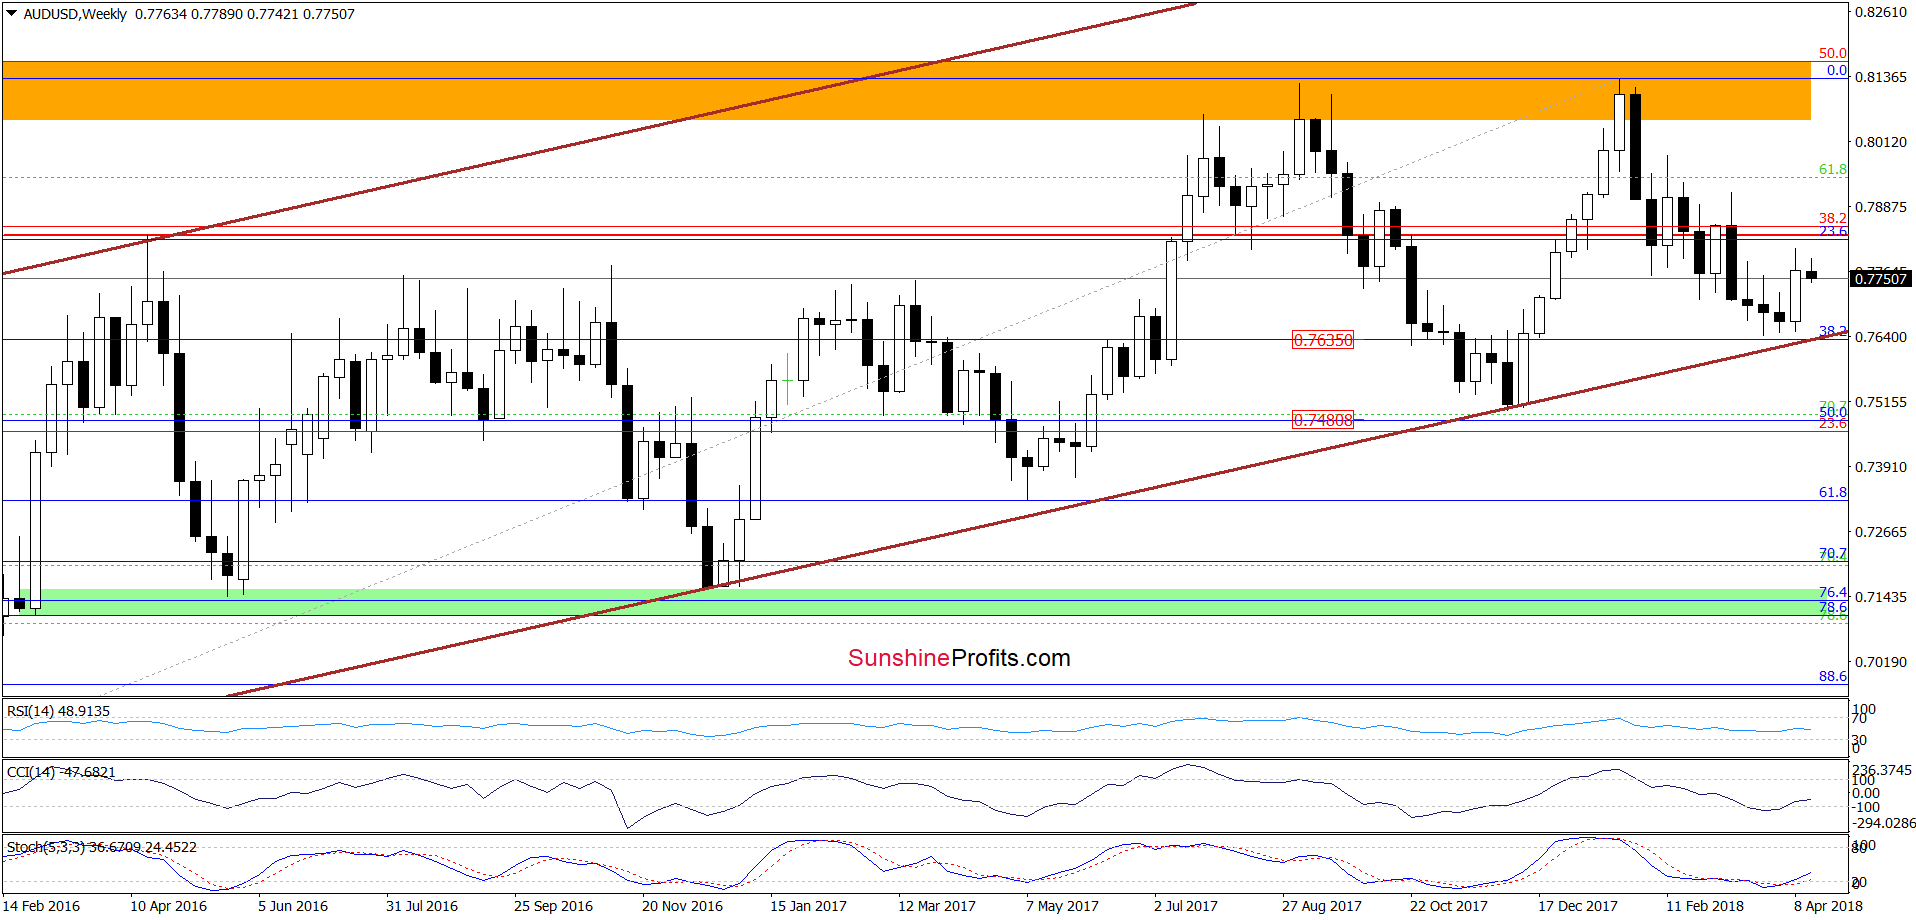
The medium-term picture of AUD/USD hasn’t changed much in recent days as the exchange rate is trading in the upper part of the last week's candle.
Will the very short-term chart give us more clues about future moves? Let’s check.
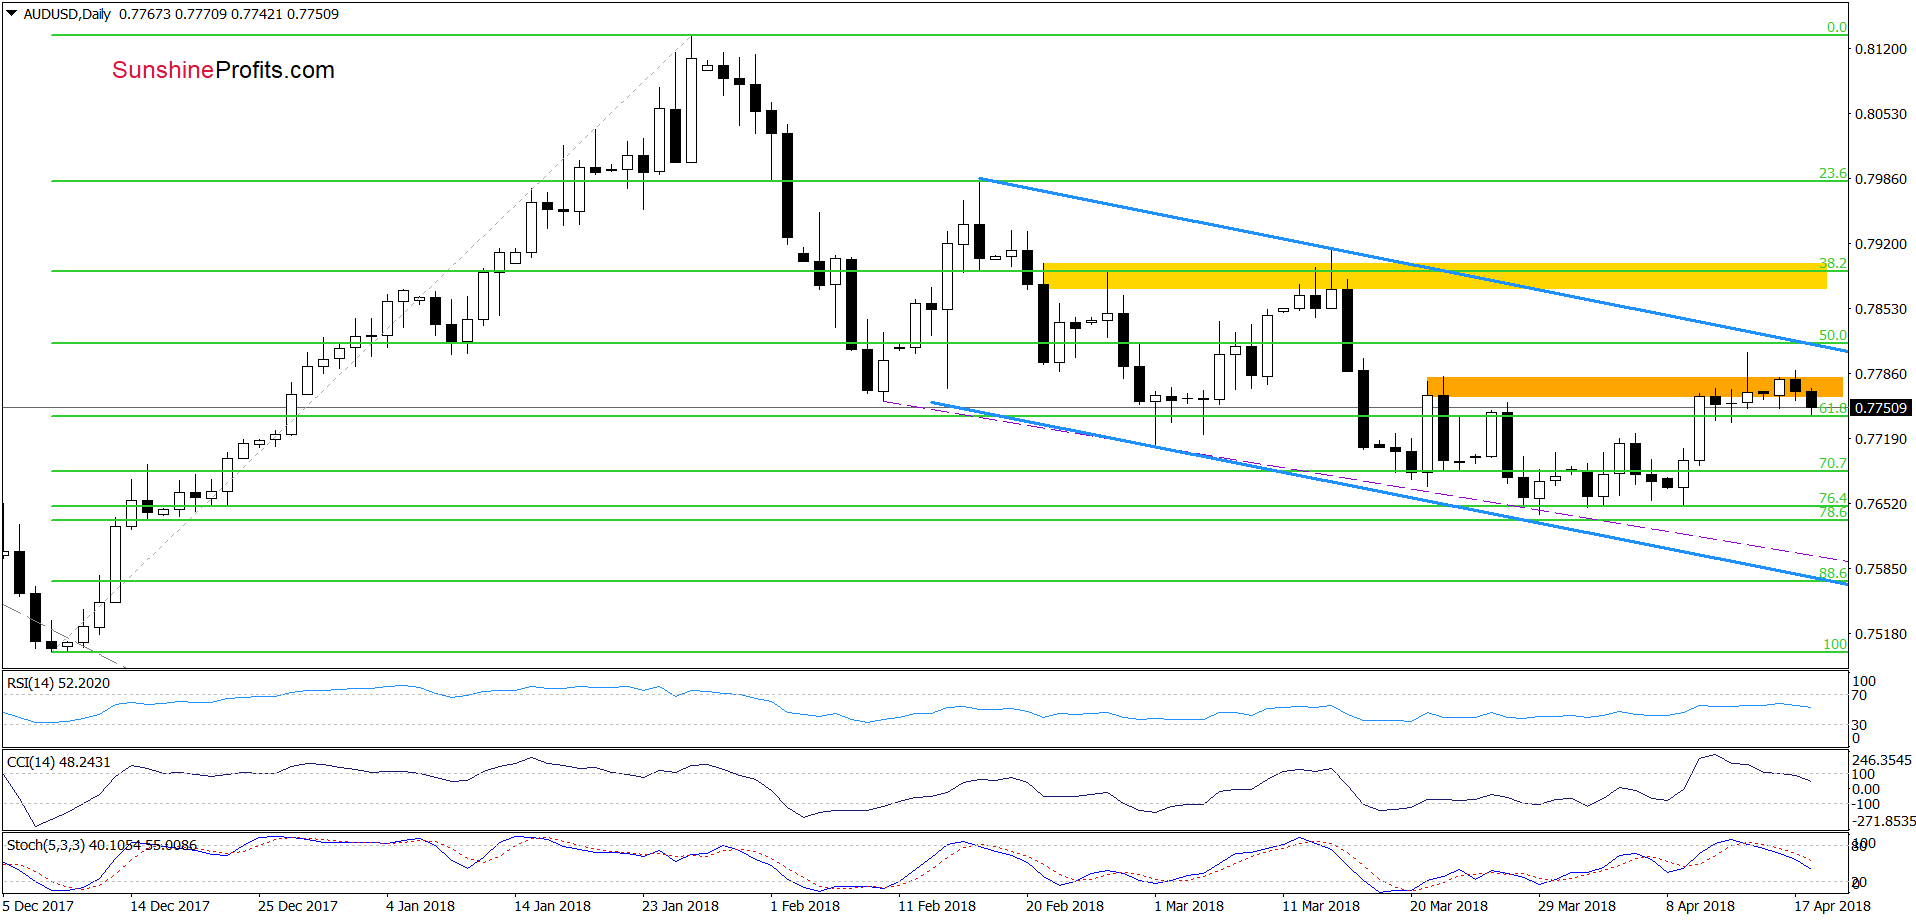
Although AUD/USD broke above the orange resistance zone on Friday, this improvement was very temporary as the upper border of the blue declining trend channel encouraged currency bears to act.
Thanks to their today’s action, the pair slipped under the orange zone, invalidating the earlier breakout. Additionally, the CCI and the Stochastic Oscillator generated the sell signals, suggesting further deterioration in the coming days.
If this is the case and AUD/USD extends losses, we’ll see a test of Tuesday’s low or even the recent lows in the coming days. connecting the dots, if the pair closes today’s session under the orange zone, we’ll consider opening short positions.
Trading position (short-term; our opinion): No positions are justified from the risk/reward perspective. We will keep you informed should anything change, or should we see a confirmation/invalidation of the above.
Thank you.
Nadia Simmons
Forex & Oil Trading Strategist
Przemyslaw Radomski, CFA
Founder, Editor-in-chief, Gold & Silver Fund Manager
Gold & Silver Trading Alerts
Forex Trading Alerts
Oil Investment Updates
Oil Trading Alerts

