

Yesterday (May 11), the US equity markets sold off at a decent clip. As mentioned in our last two alerts, many equity products did seem short-term overbought. Monday's sell-off seemed to surprise many talking heads on television and the internet, though. I mean, markets do not go up in a straight line. There have to be some pullbacks (of at least a garden variety) for a healthy bull market to pause and reestablish itself. So, what can yesterday’s equity market sell-off tell us, and are there any foreshadowing clues to the future direction? It is time to dig in and see what we can find while recapping our existing trades and levels.
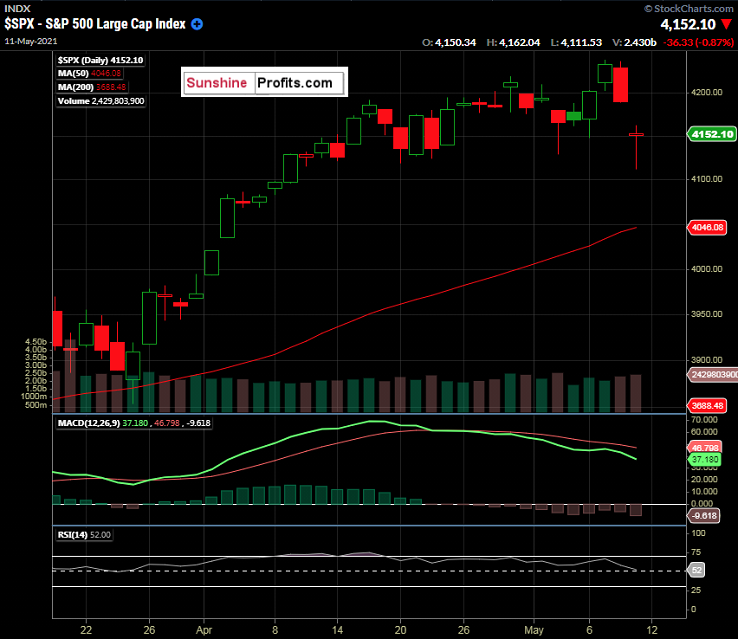
Figure 1 -S&P 500 Index Daily Candles ($SPX) January 12, 2021 - May 10, 2021. Source stockcharts.com
As we can see from the daily cable chart of the $SPX, yesterday’s session produced a large gap down and formed a doji looking reversal candle by the day’s end. The gap down really only means that the S&P 500 futures were lower overnight, but the equity traders will certainly take note of this gap. The previous lows made burying April and earlier this month held up as support during this session. What does this tell us? It’s mixed and too close to call. We are still trading well above the 50-day moving average, which sits at 4046 at the time of this writing. Since we had the gap lower, and albeit buyers arose intraday, the session closed very close to where it opened. That type of daily candle is known as a doji candle, which can be interpreted as a reversal signal, where buyers come in and gobble it up to close the session even. It is hard to call since we are still overbought by some metrics with the RSI(14) looking to cross the 50 line to the downside. Zooming out a bit on the dailies, we see the previous tests of the 50-day moving average, as mentioned in previous alerts:
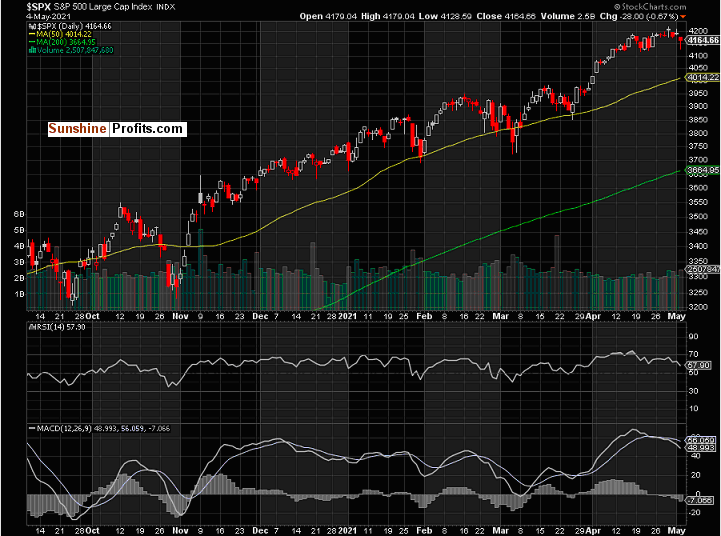 Figure 2 - S&P 500 Index ($SPX) Daily Candles September 12, 2020 - May 4, 2021. Source stockcharts.com
We saw the 50-day moving average hold up well on two out of three of the last attempts. On the attempt where the $SPX traded through the 50-day, it caught some support just shy of the previous 50-moving average test. This pattern was very close to a double bottom formation. Looking further back, we see that in September 2020, it closed below the 50-day for 8 or 9 sessions before moving above it. The index again broke the 50-day in late October, having 7 closes below the level forming a close-to-double-bottom, before resuming its uptrend.
We’ll get back to those previous patterns and levels in a moment. When talking about S&P 500 volatility, it’s wise to make a note of what the $VIX is doing.
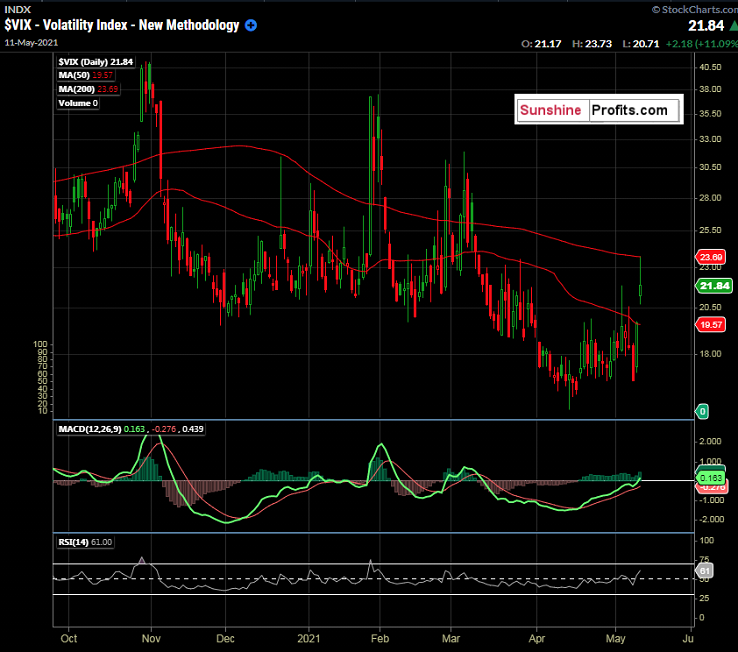
Figure 3 -$VIX Volatility Index Daily Candles January 12, 2021 - May 10, 2021. Source stockcharts.com
Ah, the $VIX. Those three letters strike fear into many traders, young and old. Known as the “fear index”, it is intended to provide a metric of constant, 30-day expected volatility of the S&P500 ($SPX) options (both calls and puts). Without getting too technical, it tends to move in at an inverse correlation to the $SPX, but not necessarily. When the $SPX sells off hard, the $VIX tends to rise, and therefore the calls and puts on the $SPX tend to become “more expensive” due to the increased implied options volatility.
So, we saw the $VIX rise yesterday, all the way to its 200-day moving average, where the intraday high was made. Notice the gap up, and of course, this correlates inversely to the gap down in the SPX.
The $VIX can indeed be a tricky beast. However, we can see that the highs in the $VIX before the subsequent drops correlated to the same days that the $SPX traded below its 50-day MA, for the most part. Notice how the $VIX traded above its 200-day MA, while the $SPX traded below its 50-day MA. I love when charts and correlations paint pictures like this.
Since we have some historical data to go on:
- $SPX found support around the 50-day moving average on 2 of its last 3 attempts.
- When $SPX broke the 50-day on 1 of the last 3 attempts, it traded below it for 2 sessions.
- When $SPX broke the 50-day in September 2020 & October 2020, it closed below it between 7 - 9 sessions.
- The $VIX doesn’t seem to like being above its 200-day moving average for long (2 - 7 sessions) before going back below it.
I want to reiterate a BUY in the $SPX but ONLY on a pullback to; or below the 50-day moving average (currently 4046), making the suggested range for entry 3990 - 4046. For traders using SPY, the current 50-day moving average is 403.29, so a range of approximately 398 - 403.29 would line up rather well.
If the 50-day moving average is broken and the $SPX closes below it, let's keep in mind the 2 - 7-day duration that we have seen in the previous price action, as described above. You can adjust your entries / scaling process accordingly.
There is always the possibility that any garden variety pullback could turn into a much larger move. Just remember 2020. However, since we are still entrenched in a bull market, considering buying the broader index at; or below its 50-day moving average could be a sound idea.
To sum up the current viewpoint and opinion:
I have a BUY call for:
- Invesco MSCI Sustainable Future ETF (ERTH) between $67.76 - $68.49. Waiting for a pullback is wise. Always use a stop loss level that caters to your individual risk tolerance.
Update 05/12 (pre-open): we traded down to $69.17 at the lows yesterday, almost entering this range. Eyes will be peeled on this one, especially if we get a lower open in the broader indices. Always use a stop loss level that caters to your individual risk tolerance.
- First Trust NASDAQ Clean Edge Smart Grid Infrastructure Index Fund (GRID) between $86.91 and $88.17. Update 05/12 (pre-open): Grid trade through this range on Monday. This instrument could be a long-term holding for those that want to have exposure to the US Infrastructure story as it develops. Short-term traders can look at the 52-week high of $90.96 and high $90.00’s to the psychological $100.00 level as take profit level ideas. Always use a stop loss level that caters to your individual risk tolerance.
- S&P 500 ($SPX): but ONLY on a pullback to; or below the 50-day moving average (currently 4046), making the suggested range for entry 3990 - 4046. For traders using SPY, the current 50-day moving average is 403.29, so a range of approximately 398 - 403.29 would line up rather well. Always use a stop loss level that caters to your individual risk tolerance.
I have a SELL call for:
June 10-year notes (ZNM2021) 132'22 - 132'24'5 with a tight stop. Target 131’27’5. If you are not familiar with interest rate futures, do not take the trade.
Update 05/12: This didn’t quite trade up to the opinion level for a short entry. It was close but reached only 132’20 for the high on Monday. Keep an eye on this one, but use a tight stop and pay special attention to it should the equity indices move hard to the upside. Always use a stop loss level that caters to your individual risk tolerance.
Thank you,
Rafael Zorabedian
Stock Trading Strategist

