

Briefly:
Intraday trade: Our Thursday's intraday trading outlook was bearish. The market opened 0.3% higher and closed 0.1% higher, but it reversed its intraday uptrend after gaining more than 1%. The index didn't reach our stop-loss or profit target levels. We still can see short-term overbought conditions along with negative technical divergences. Therefore, intraday short position is favored again. Stop-loss is at the level of 2,740 and potential profit target is at 2,650 (S&P 500 index).
Medium-term trade: In our opinion, no medium-term positions are justified.
Our intraday outlook is bearish. Our short-term outlook is neutral, and our medium-term outlook is neutral:
Intraday outlook (next 24 hours): bearish
Short-term outlook (next 1-2 weeks): neutral
Medium-term outlook (next 1-3 months): neutral
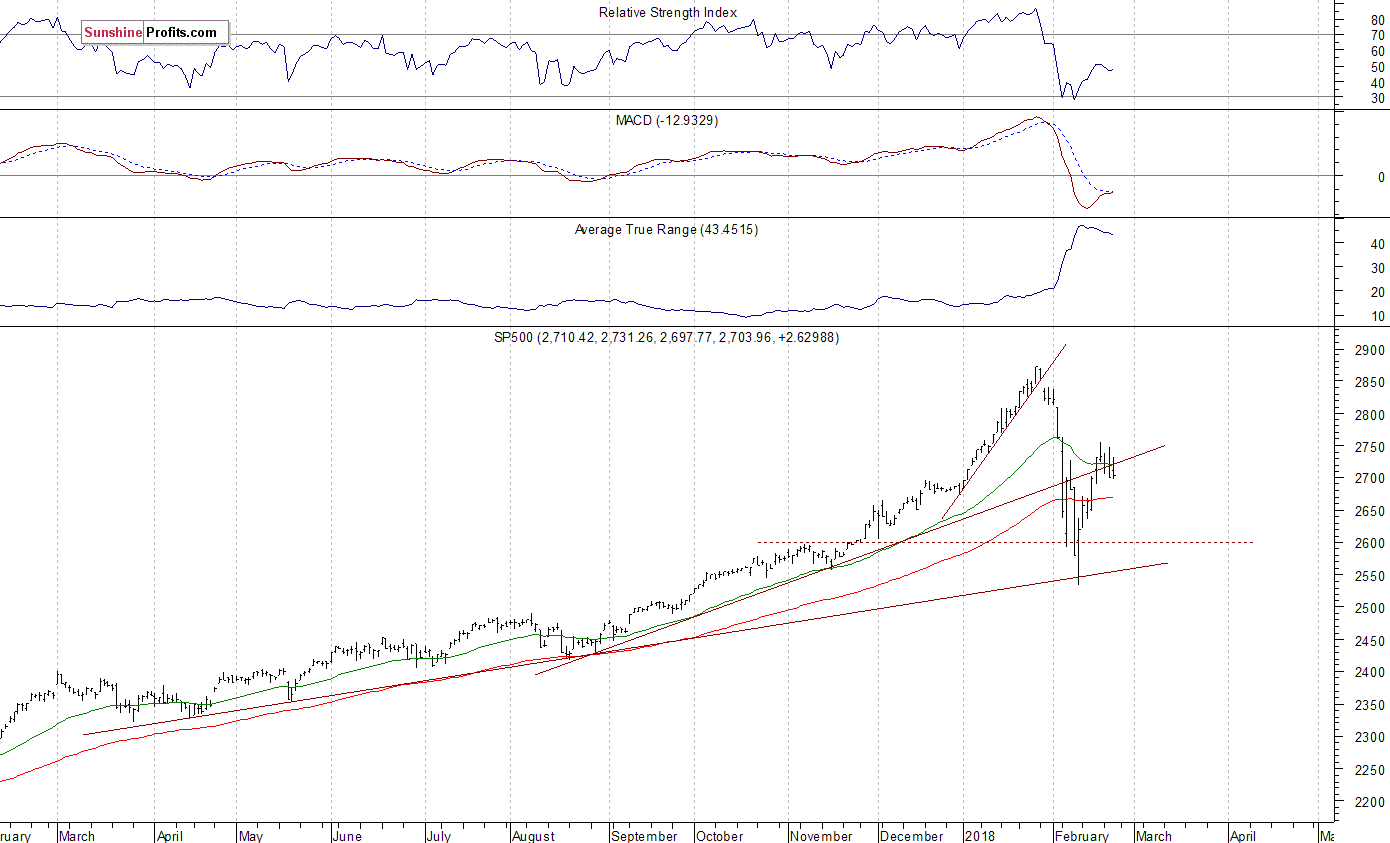
The main U.S. stock market indexes were mixed between -0.1% and +0.7% on Thursday, as investors continued taking profits after week-long rally from February 9 lows. The S&P 500 index extended its short-term fluctuations along the level of 2,700-2,750. It retraced more than 61.8% of its late January - early February sell-off recently. However, the market bounced off that resistance level and reversed its intraday uptrend again. The broad stock market index trades 5.9% below January 26 record high of 2,872.87. The Dow Jones Industrial Average gained 0.7%, and the technology Nasdaq Composite lost 0.1% on Wednesday.
The nearest important level of resistance of the S&P 500 index remains at around 2,740-2,750, marked by 61.8% retracement of the whole move down from late January record high (2,742.92) and its Friday's local high. The resistance level is also at 2,760-2,765. On the other hand, support level is at 2,700, marked by recent local lows. If the market continues lower, potential support level would be at around 2,670.
The S&P 500 index reached its record high almost a month ago on January 26. It broke below month-long upward trend line, as it confirmed uptrend's reversal. Then the broad stock market gauge retraced all of its January rally and continued lower. The index extended its downtrend on February 9, as it was almost 12% below the late January record high. We can see that stocks reversed their medium-term upward course following whole retracement of last month's euphoria rally. However, the market bounced off its almost year-long medium-term upward trend line, and it retraced more than 61.8% of the sell-off within a few days of trading. Is this just an upward correction or uptrend leading to new all-time highs? It still looks like an upward correction:
Positive Expectations
The index futures contracts are gaining 0.3-0.4% vs. their Thursday's closing prices right now. It means that investors' expectations ahead of the opening of today's trading session are positive. The European stock market indexes have been mixed so far. There will be no new important economic data announcements today. Will the market continue higher again and try to break above the resistance level? If not, we may see another test of support level at 2,700. And if it breaks lower, it could continue to the next support level of 2,670.
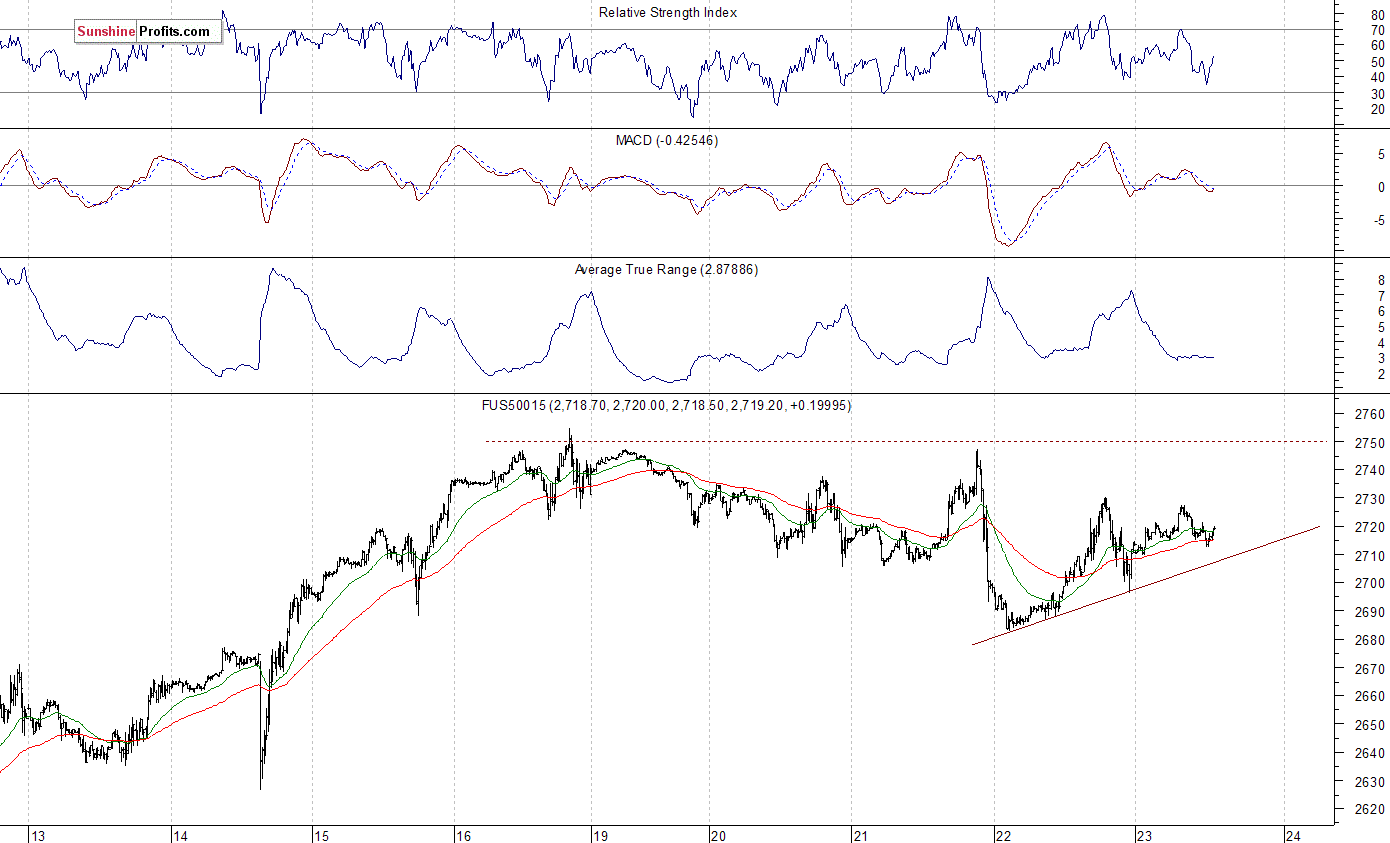
The S&P 500 futures contract trades within an intraday consolidation following yesterday's bounce off its overnight local low at around 2,680. The main short-term resistance level is at 2,740-2,750, marked by recent local highs. There is also a resistance level of yesterday's local high at around 2,730. The futures contract trades along its short-term upward trend line, as the 15-minute chart shows:
Nasdaq Extends Consolidation
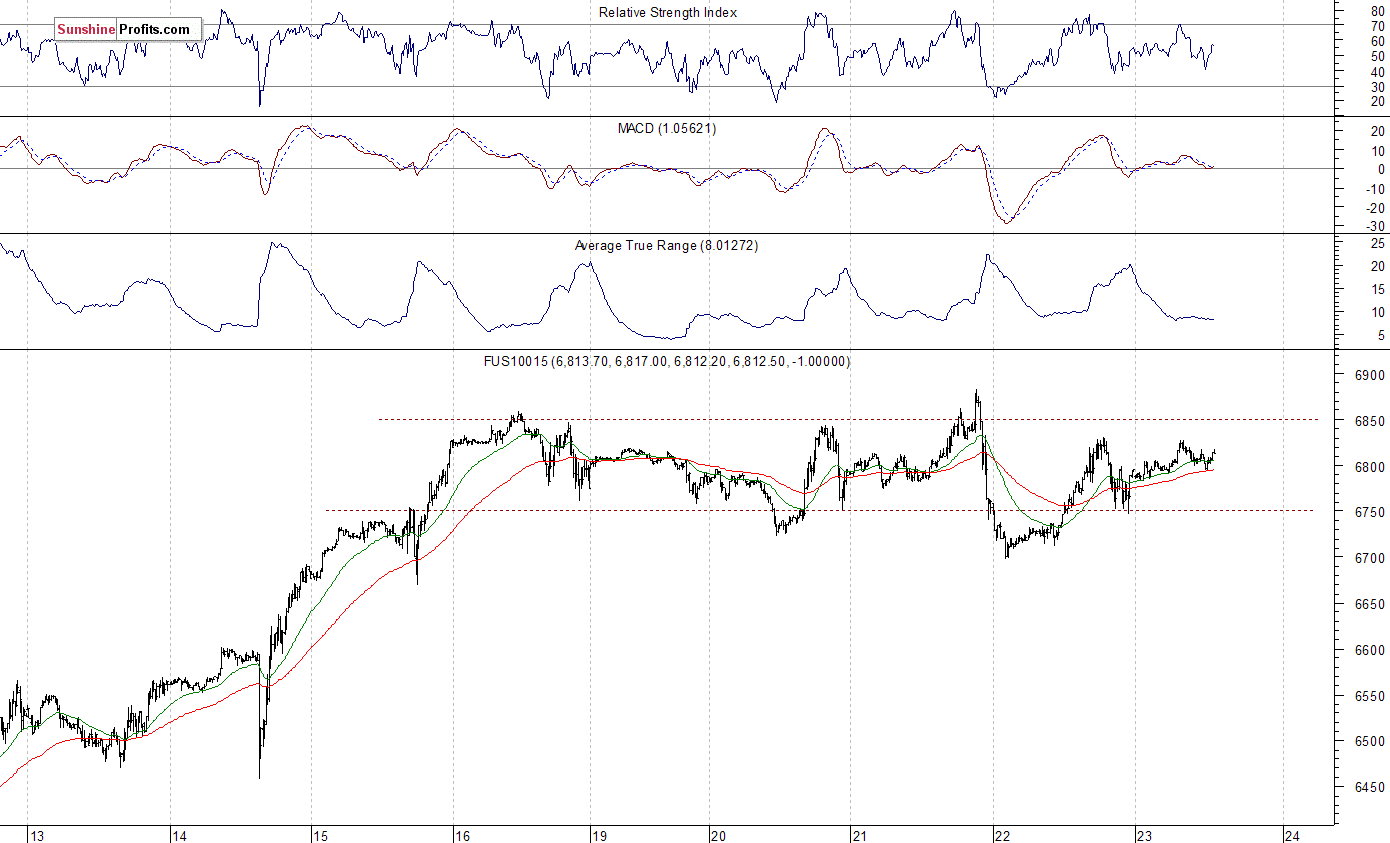
The technology Nasdaq 100 futures contract follows a similar path, as it trades within an intraday consolidation. The market fluctuates following its yesterday's bounce off its overnight low at around 6,700. It is still almost a week-long consolidation along the level of 6,700-6,850. For now, it looks like relatively flat correction within an uptrend from February 9 low. But will technology index get back above 7,000 mark and continue towards new record highs? The Nasdaq futures contract remains within its short-term consolidation, as we can see on the 15-minute chart:
Amazon Close to Record High, Apple Still at Resistance
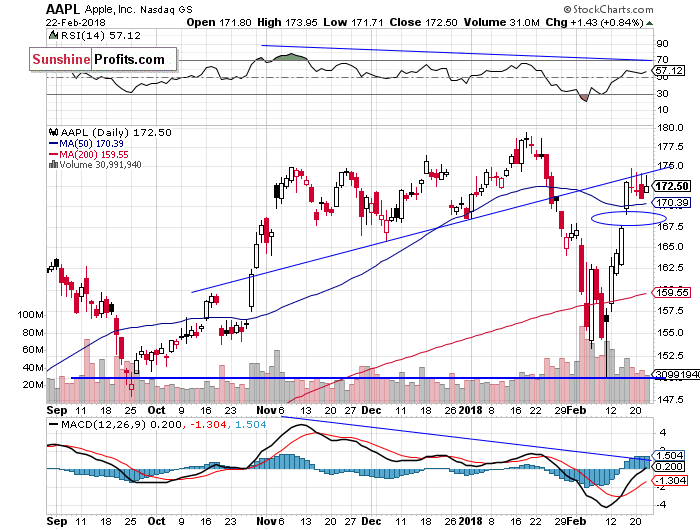
Let's take a look at Apple, Inc. stock (AAPL) daily chart (chart courtesy of http://stockcharts.com). It was one of the recent stock market rout's main drivers. Then it led last week's broad stock market rebound rally. It fell close to support level of $150 on Friday February 9. Since then, it traded within a relatively strong uptrend, but it failed to break above the resistance level of $175-180 a week ago on Friday. The market reached its previously broken upward trend line. It still looks like some short-term topping pattern:
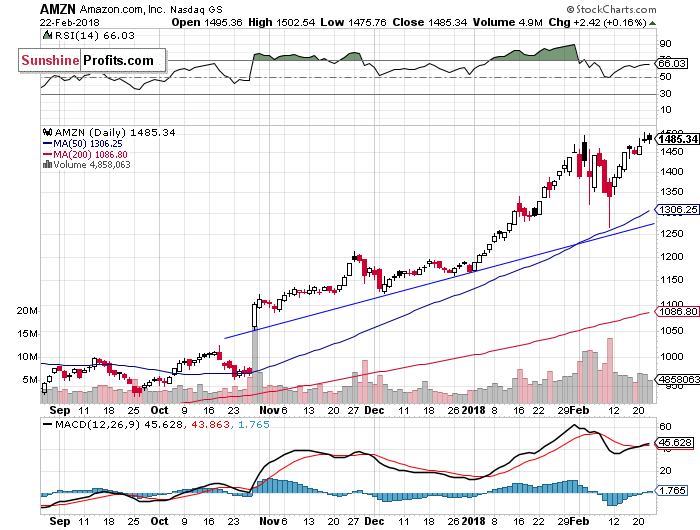
Amazon.com, Inc. stock (AMZN) continues to be relatively strong vs. the broad stock market. Despite an overall weakness, it reached new record high on Wednesday, as it broke above $1,500 mark. The stock continues to trade well above its end of year closing price of $1,167.5. AMZN bounced off its upward trend line two weeks ago, following downward correction below the price of $1300. Despite new record high, we still can see potential bearish double top pattern:
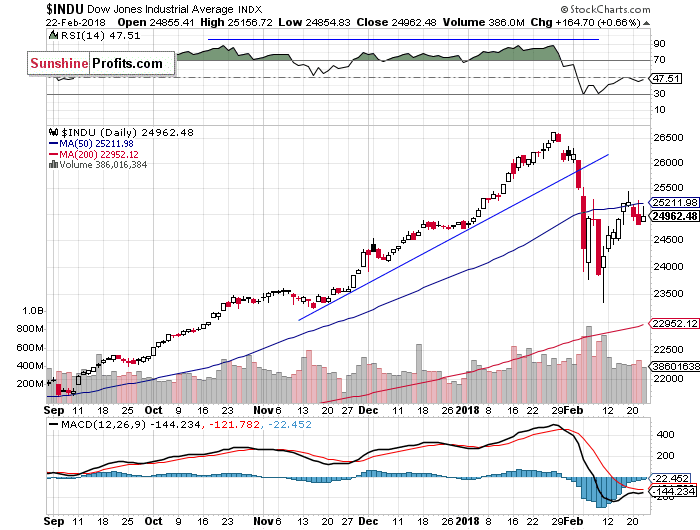
The Dow Jones Industrial Average daily chart shows that blue-chip index reversed its uptrend a month ago. The price broke below the level of 26,000 and continued much lower. There were some medium-term negative technical divergences - the most common divergences are between asset’s price and some indicator based on it (for instance the index and RSI based on the index). In this case, the divergence occurs when price forms a higher high and the indicator forms a lower high. It shows us that even though price reaches new highs, the fuel for the uptrend starts running low.
The DJIA fell below 23,500 on Friday two weeks ago. We saw positive candlestick chart pattern that day. The market formed bullish harami. It is a pattern in which a large black candlestick is followed by a smaller white candlestick with body located within the body of a preceding day. Since then, it continued higher. The market bounced off resistance level of around 25,500 on Friday and it trades within a short-term downward correction:
Concluding, the S&P 500 index was gaining more than 1% yesterday, but it closed just 0.1% higher vs. Wednesday's closing price. Investors continued taking profits off the table following last week's rebound. The broad stock market rally failed to continue at 61.8% retracement of the late January - early February sell-off. So, is it just quick downward correction before another leg higher or some new downtrend leading to February 9 low or lower? It's hard to say, but we may see some more downward pressure in the near future. Especially if the index breaks below 2,700 mark. Stocks are expected to open higher today, but they may re-visit their recent lows.
The broad stock market was falling almost 12% off its late January record high on Friday, February 9 before an intraday reversal. It was a final panic selling ahead of short-term upward reversal, and the market found a support of its medium-term upward trend line, which was at 2,550. The index extended its week-long rebound almost a week ago on Friday, but it failed to continue above 61.8% retracement of the sell-off.
The S&P 500 index retraced its whole month-long January rally and continued lower, the lowest since early October. So, medium-term picture is now bearish. Investors took profits off the table following the unprecedented month-long rally, but then they began selling in panic. It was quite similar to 2010 Flash Crash event. Is this just downward correction or the beginning of a new medium-term downtrend? This sell-off set the negative tone for weeks or months to come.
Currently, we prefer to be out of the market, avoiding low risk/reward ratio medium-term trades. We will let you know when we think it is safe to get back in the market.
To summarize: no medium-term positions are justified from the risk/reward perspective at this moment.
Intraday trade:
S&P 500 index - short position: profit target level: 2,650; stop-loss level: 2,740,
S&P 500 futures contract (September) - short position: profit target level: 2,650; stop-loss level: 2,740
SPY ETF (SPDR S&P 500, not leveraged) - short position: profit target level: $264.6; stop-loss level: $273.6
No medium-term position is justified from the risk/reward perspective at this moment.
Thank you.
Paul Rejczak
Stock Trading Strategist
Stock Trading Alerts

