

The June E Mini S&P 500 futures contract traded well early yesterday morning before the cash open. Cash traders, however, had different ideas when the opening bell rang in New York.
The June E mini S&P 500 (ESM2021) traded as high as 4230.00 right at 9:31 AM yesterday (June 1) as cash trading began. Traders were waiting on the PMI data release at 10:00 AM. Sellers came into the market right at the cash open, selling it down to 4213.00 in the minutes leading up to the data print. The data signaled inflation once again, with the PMI data printing 62.1, above market expectations of 61.5, and above the last measure of 61.5. Inflation became a concern here. Will the Fed eventually raise their overnight Fed Funds Rate? Will yields rise? This data print created uncertainty in the market, and the ESM2021 settled around 4199.75 at 4:15 PM ET yesterday.
This type of price action came as no surprise to me, as the prevailing macro theme of this week seems to revolve around Friday’s Non-Farm Payroll data. As mentioned yesterday, I view this type of trading week as “sideways trading in a wide range in the $SPX until the market gets a read on the NFP data.” Let’s see how this plays out heading into Friday.
The Cash $SPX settled almost flat, giving up 2.09 points (-0.05%) on the day. That’s what I would call sideways. The $VIX, however, tacked on 6.80%, furthering the potential of yesterday’s weekly outlook for volatility to get bid up this week, as the market waits for Friday’s jobs number. S&P 500 options implied volatilities got more expensive, with the uncertainty of Friday’s jobs number being a partial contributor.
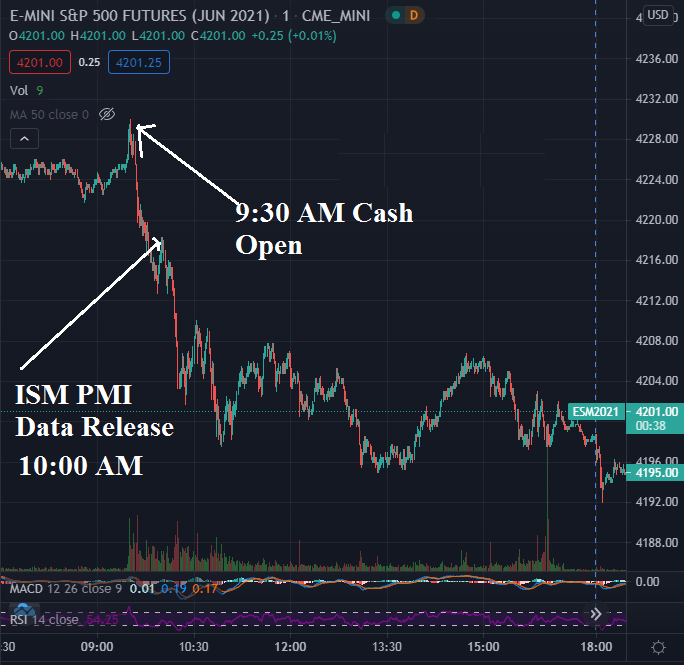
Figure 1 - June Emini S&P 500 Futures 7:30 AM June 1, 2021 - 6:46 PM June 1, 2021 One-Minute Candles Source tradingview.com
A picture is worth a thousand words. In the above chart, we can see how the cash S&P 500 open was sold, and how the PMI print was sold.
However, with muted trading expected this week in a range, this doesn’t seem too surprising. The $SPX closed flat on the day, and the $VIX caught a bump. So, what would be the expected ranges for Wednesday’s and Thursday’s session?
We could actually consult the weekly options and determine the price range probabilities for the week, but that will include Friday trading data. Let’s just examine the recent ranges to get an idea for Wednesday and Thursday.
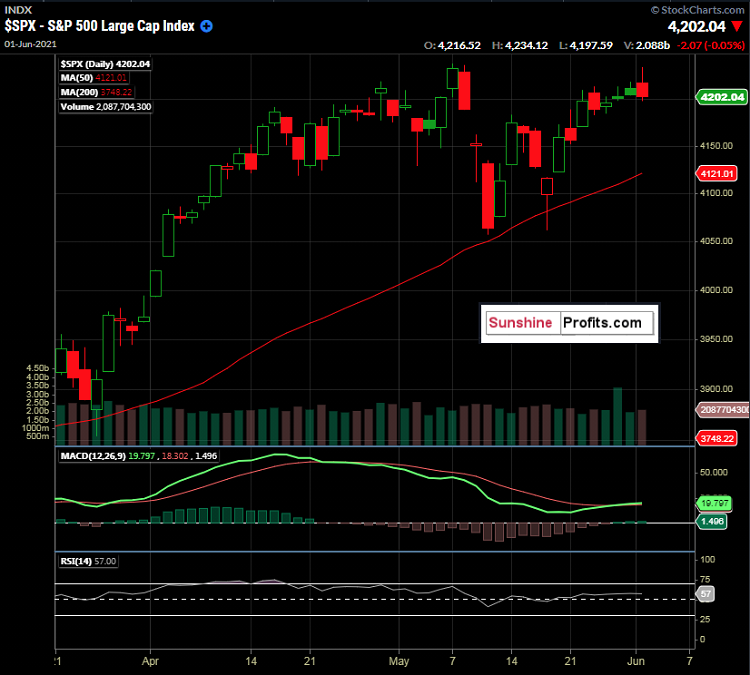
Figure 2 - S&P 500 Index $SPX March 25, 2021 - June 1, 2021, Daily Candles Source stockcharts.com
We can see that today’s high prints in the index (4234.12) at the US cash market open were getting close to the all-time high of 4238.04, set on May 7th. This level was denied and seems to lend some credibility to a rangebound market ahead of Friday’s NFP data.
The 50-day SMA sits at 4121.01 and this coincides well with the lows of the range towards the end of April, near 4118.00 - 4125.00. These figures could give us a range to look for over the next couple of days. Could volatility strike before the data? It could, however, I would expect it to be short-lived and mild. Nobody knows for sure, but let’s look for a rangebound $SPX on Wednesday and Thursday.
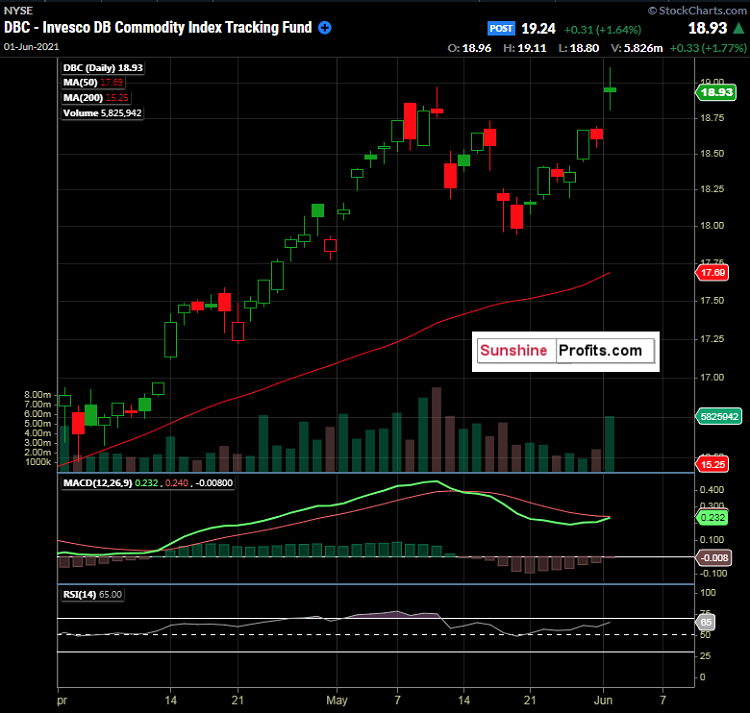
Figure 3 - Invesco DB Commodity Index Tracking Fund DBC April 1, 2021 - June 1, 2021, Daily Candles Source stockcharts.com
With inflation back in the spotlight yesterday, commodities rose overall, as can be seen in the above daily chart of DBC. In addition, there is news of the JBS Beef Plant Cyberattack that did not help with the inflationary theme. However, there is now news that the plans are coming back online.
The daily candle that was formed here could be an abandoned baby bear or exhaustion gap; note the gap up with the open and close levels almost identical. We will have to see how commodities trade tomorrow to see if this new high holds.
To sum up the current viewpoint and opinion:
I have BUY opinions for:
- iShares Trust Russell 2000 ETF (IWM) for an index reconstitution trade. At this time, I would be looking to be long and then exiting upon the actual reconstituted index going into place on June 28, 2021. Buy the rumor, sell the fact type of trade. Buy Pullbacks. For equity-bearish folks, see the IWM/SPY spread idea in the May 27th publication. Always use a stop loss level that caters to your individual risk tolerance.
- Update: 06/02: The IWM tacked on 1.14% in yesterday’s overall sideways equity session, with the SPY giving up 0.09%.
- Defiance Quantum ETF (QTUM) between $44.00 - $47.25. Update 05/27: I will now raise my buy idea zone upwards to $47.60. Look for pullbacks for entries. Update 06/02: QTUM closed at $48.40 in yesterday’s session. Always use a stop loss level that caters to your individual risk tolerance.
- Amplify Transformational Data Sharing ETF (BLOK) between $37.68 - $37.91. BLOK has a history of high volatility, so proceed with caution. Always use a stop loss level that caters to your individual risk tolerance. Update 06/02: Still on the radar, but hasn’t pulled back to the 200-day moving average level yet (currently $38.53 as of 06/01 close) Always use a stop loss level that caters to your individual risk tolerance.
- Invesco MSCI Sustainable Future ETF (ERTH) between $67.76 - $70.82. Always use a stop loss level that caters to your individual risk tolerance. Update 05/27: ERTH closed at $73.50 yesterday and is continuing to look good. Update 06/01: ERTH closed at $74.12 on Friday. Update 06/02 ERTH closed at $74.89 yesterday.
I have SELL opinions for:
- 10-Year Notes Always use a stop loss level that caters to your individual risk tolerance. Update 05/27: Yesterday, I mentioned a daily close above 133’01’5 (June) would have me looking elsewhere. It closed on 05/26 at 132’29, so this idea is still in play. Update 06/01: September 10-year notes are now the most liquid contract due to the contract roll. Always stay aware of the Contract Specifications. 10-Year Notes have been trading sideways, perhaps in anticipation of the upcoming data releases this week. If you are involved in a June 10-Year note trade, now is the time to roll to the September contract. Update 06/02: 132-00 - 132-05’5 could be interesting levels. Always use a stop loss level that caters to your individual risk tolerance.
- Invesco DB Commodity Index Tracking Fund (DBC) $18.50 - $18.75. Target 17.50 (old highs) to $17.75. Always use a stop loss level that caters to your individual risk tolerance. Use caution if you are trying this trade, knowing that the DXY could capitulate. See the May 19th publication for more details. Update 06/02 DBC closed yesterday at $18.91. Tight stop suggested. Always use a stop loss level that caters to your individual risk tolerance.
I have a HOLD opinion for:
- First Trust NASDAQ Clean Edge Smart Grid Infrastructure Index Fund (GRID). GRID has traded through our idea range of between $86.91 and $88.17. I do not encourage chasing it, if not already long, in my opinion. Update 05/27: GRID closed at $89.72 yesterday and is chugging along. I now have it listed as a Hold because there were better entry prices a week ago. Don’t chase. Update 06/01: GRID closed at $90.70 on Friday and traded just $0.04 off its 52-week high of $90.96. Short term traders can use these levels as take profit idea levels. Update 06/02 GRID closed at $91.20 yesterday, and has reached the initial take profit levels. Short-term traders can take advantage of selling at or near the 52-week high, while longer-term traders could look for higher $90.00s - $100.00 levels to potentially continue benefiting from the infrastructure theme.
- Short-term traders can look at the 52-week high of $90.96 and high $90.00’s to the psychological $100.00 level as take profit level ideas. Always use a stop loss level that caters to your individual risk tolerance.
May the rest of your week be the best of your week!
Thank you,
Rafael Zorabedian
Stock Trading Strategist

