

Briefly:
Intraday trade: The S&P 500 was virtually flat on Tuesday, after opening 0.5% higher. The market will probably open higher today. We may see a short-term consolidation after the recent rout.
Trading position (short-term; our opinion): no positions are justified from the risk/reward perspective.
Our short-term outlook is neutral, and our medium-term outlook is neutral:
Short-term outlook (next 1-2 weeks): neutral
Medium-term outlook (next 1-3 months): neutral
The U.S. stock market indexes were mixed between 0.0% and +0.5% on Tuesday, as they fluctuated following the recent declines. The S&P 500 index fell slightly below its Monday's low, and it traded 14.0% below September the 21st record high of 2,940.91. The Dow Jones Industrial Average gained 0.4% and the Nasdaq Composite gained 0.5% on Tuesday.
The nearest important level of resistance of the S&P 500 index remains at 2,580-2,600, marked by the recent level of support. The resistance level is also at 2,635-2,640, marked by Friday's daily gap down of 2,635.07-2,637.27. On the other hand, the support level is at 2,490-2,500, marked by some previous medium-term fluctuations.
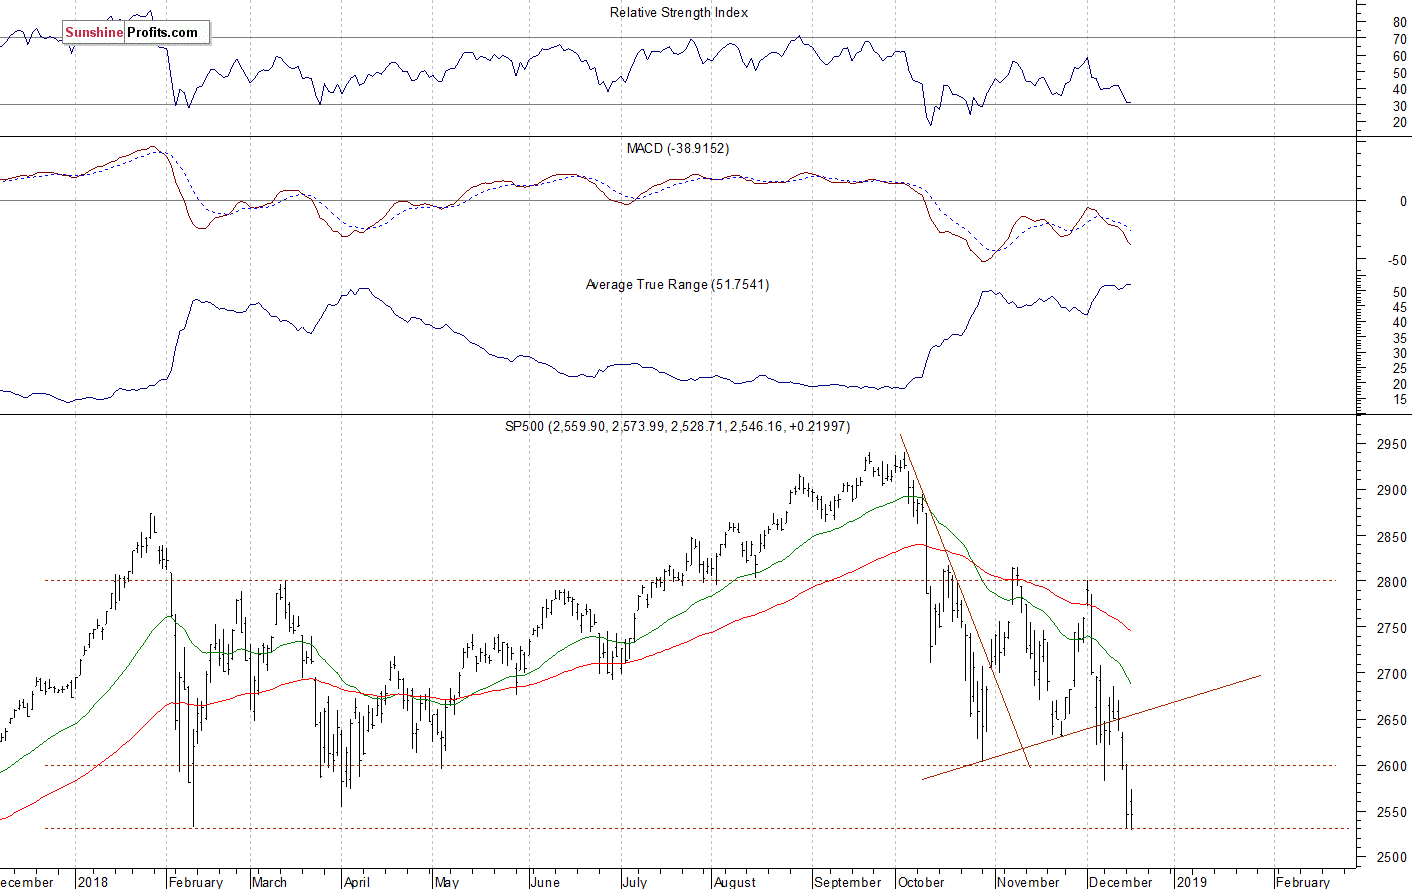
The broad stock market broke below its two-month-long trading range on Monday, as the S&P 500 index fell below the recent local lows. The downward correction reached 14% from the September all-time high, surpassing January-February correction of around 12%. Is this a long-term bear market? For now, it looks like a medium-term downward correction. However, there have been no confirmed positive signals so far. The index fell close to the February local low, as we can see on the daily chart:
Short-Term Consolidation - Bottom or Just Pause?
The index futures contracts trade 0.8-0.9% higher vs. their yesterday's closing prices. So expectations before the opening of today's trading session are positive. The European stock market indexes have gained 0.7-1.0% so far. Investors will wait for some economic data announcements this morning: Existing Home Sales at 10:00 a.m., Crude Oil Inventories at 10:30 a.m. Investors will also wait for the Fed's Rate Decision release at 2:00 p.m. The broad stock market may fluctuate following the recent decline. There will likely be an increased volatility following the mentioned Rate Decision announcement.
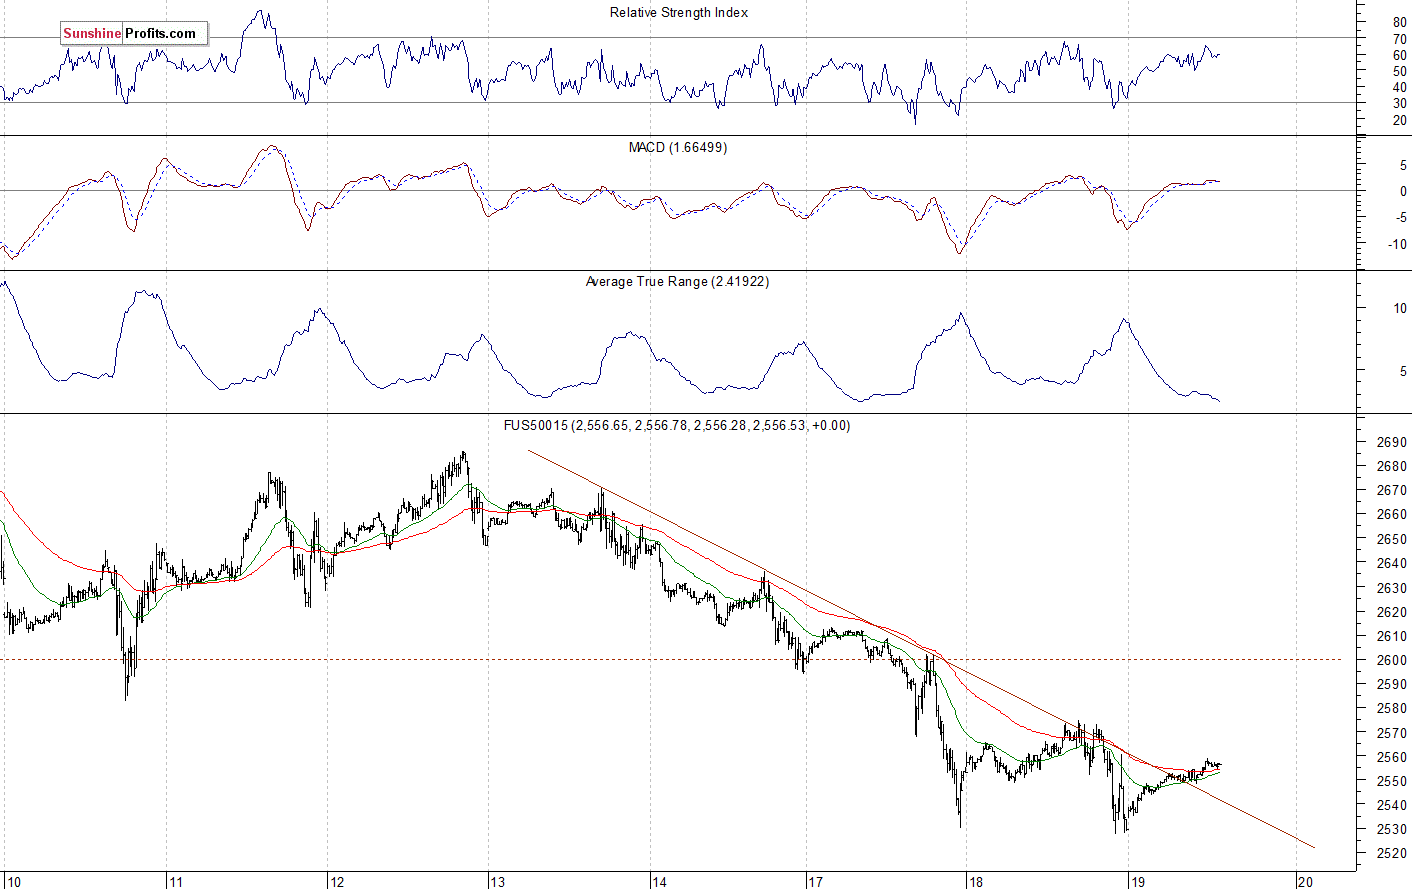
The S&P 500 futures contract trades within an intraday uptrend, as it retraces some of its yesterday's intraday decline. The nearest important level of resistance is at around 2,560-2,570, marked by the local highs. The resistance level is also at 2,590-2,600. On the other hand, the level of support is at 2,530-2,550. The futures contract broke slightly above its short-term downward trend line, as the 15-minute chart shows:
Nasdaq Also Going Sideways
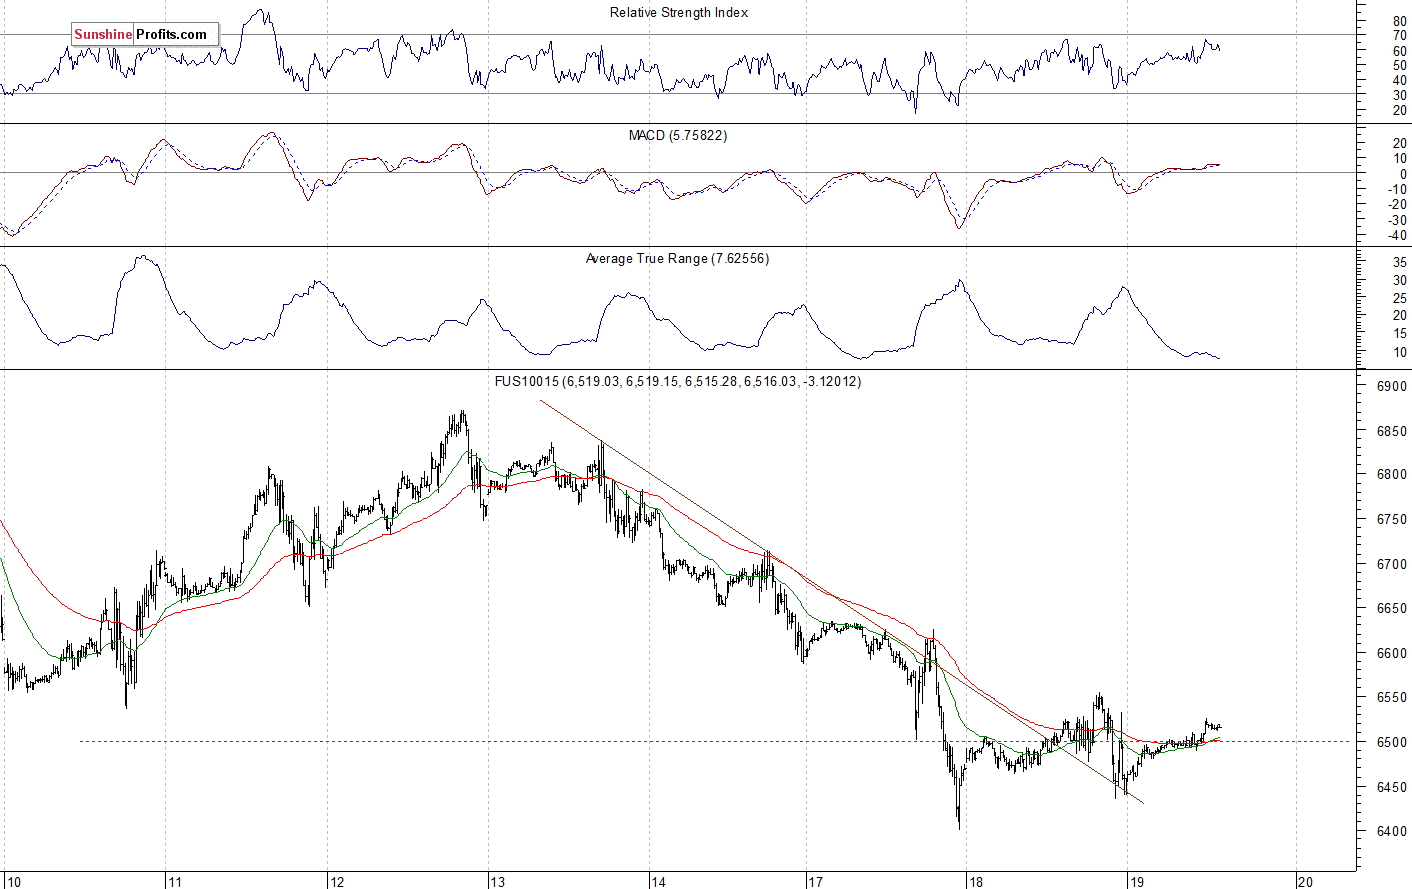
The technology Nasdaq 100 futures contract follows a similar path, as it trades within an intraday uptrend. The market broke below its previous medium-term low on Monday, as it reached 6,400 mark. The nearest important level of resistance is now at around 6,550-6,600. On the other hand, the support level is at 6,400-6,450, among others. The Nasdaq futures contract continues to trade along the level of 6,500, as we can see on the 15-minute chart:
Big Cap Tech Stocks Remain Close to Medium-Term Lows
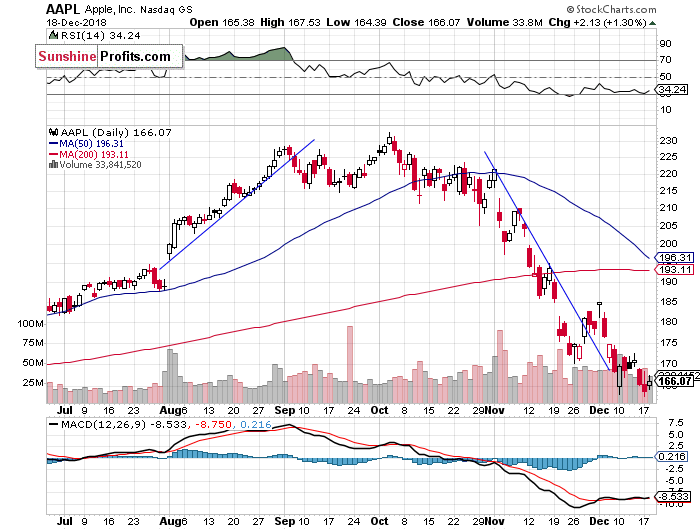
Let's take a look at Apple, Inc. stock (AAPL) daily chart (chart courtesy of http://stockcharts.com). The stock extended its sell-off on Monday, as it fell slightly below the previous local low. The market reached new medium-term low of $162.73. Will it continue lower? It looks like some bottoming pattern before an upward reversal. However, there have been no confirmed positive signals so far:
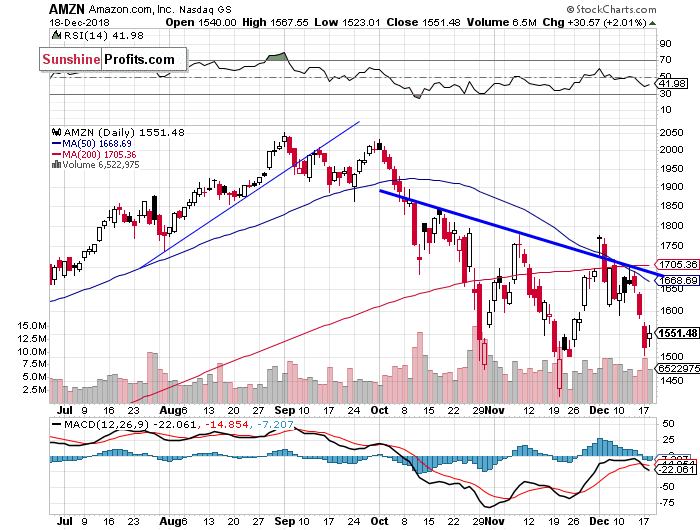
Now let's take a look at Amazon.com, Inc. stock (AMZN) daily chart. The stock bounced off the resistance level of $1,700-1,800 again, and it got closer to the support level of $1,450-1,500. It continues to trade below the two-month-long downward trend line, as we can see on the daily chart:
Dow Jones Below 24,000 Mark
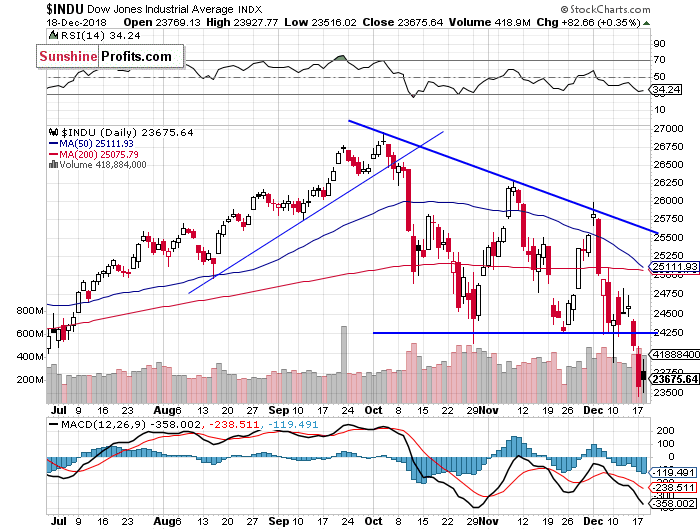
The Dow Jones Industrial Average has also broke below its two-month-long consolidation on Monday. The blue-chip stocks' gauge fell below the support level of 24,000. The nearest important level support is now at around 23,350, marked by some previous local lows. On the other hand, the short-term resistance level remains at 24,000-24,250, as the daily chart shows:
The S&P 500 index fell the lowest since the early November of 2017. It extended its downtrend, as it fell 14% off the late September local high. Is this a long-term bear market or just medium-term downward correction? For now, it looks like a correction. However, there have been no confirmed positive signals so far.
Concluding, the S&P 500 index will likely open higher today. We may see an attempt at retracing some more of the recent sell-off. Investors will wait for the Fed's Rate Decision release at 2:00 p.m.
Trading position (short-term; our opinion): no positions are justified from the risk/reward perspective.
Thank you.
Paul Rejczak
Stock Trading Strategist
Stock Trading Alerts

