

Briefly:
Intraday trade: Our Tuesday's intraday outlook was neutral. The S&P 500 index lost 1.2% after opening 0.6% lower. The stock market will probably higher today. We may see some upward correction, but the index will likely fluctuate along 2,700 mark. We prefer to be out of the market, avoiding low risk/reward ratio trades.
Medium-term trade: In our opinion, no medium-term positions are justified.
Our intraday outlook is neutral. Our short-term outlook is neutral, and our medium-term outlook is neutral:
Intraday outlook (next 24 hours): neutral
Short-term outlook (next 1-2 weeks): neutral
Medium-term outlook (next 1-3 months): neutral
The main U.S. stock market indexes lost between 0.5% and 1.6% on Tuesday, as investors' sentiment worsened following global stock markets' rout. The S&P 500 index broke below the level of 2,700, and it was the lowest since the first half of the month. It currently trades 6.4% below January's 26th record high of 2,872.87. The Dow Jones Industrial Average lost 1.6%, and the technology Nasdaq Composite lost 0.5%, as it was relatively stronger than the broad stock market.
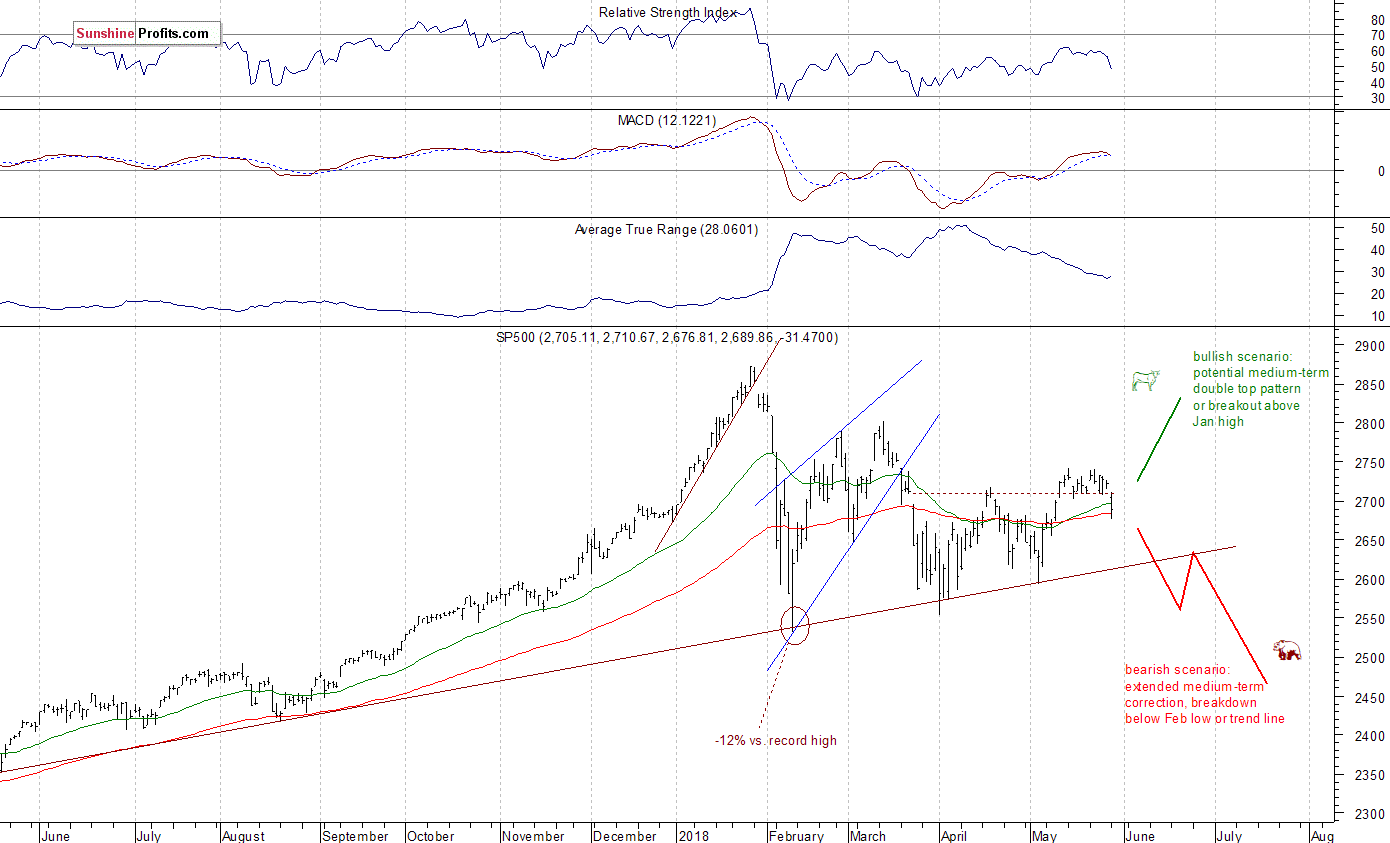
The nearest important level of resistance of the S&P 500 index is now at around 2,700-2,710, marked by recent level of resistance along with yesterday's daily gap-down of 2,710.67-2,714.99. The next level of resistance remains at 2,740-2,750, marked by previous local highs along with mid-March local high. On the other hand, support level is at around 2,675, marked by previous local low. The level of support is also at 2,650-2,655.
The broad stock market extended its short-term uptrend in the beginning of May, as the S&P 500 index broke above the level of 2,700. Then the market traded within consolidation. Stocks broke below this consolidation yesterday, as the index fell below 2,700 mark. Is this a new downtrend or just downward correction following the early May rise? There are still two possible medium-term scenarios - bearish that will lead us below February low following trend line breakdown, and the bullish one in a form of medium-term double top pattern or breakout towards 3,000 mark. There is also a chance that the market will just go sideways for some time, and that would be positive for bulls in the long run (some kind of an extended flat correction):
Positive Expectations, Just Upward Correction?
Expectations before the opening of today's trading session are positive, because the index futures contracts trade between +0.3% and +0.6% vs. their Tuesday's closing prices. The European stock market indexes have been mixed so far. Investors will wait for series of economic data announcements this morning: ADP Non-Farm Employment Change at 8:15 a.m., Preliminary GDP number, Trade Balance, Wholesale Inventories at 8:30 a.m., Fed's Beige Book release at 2:00 p.m. The broad stock market may fluctuate after yesterday's sell-off. The S&P 500 index accelerated its move down following breakdown below support level of 2,700-2,710. It will be acting as a short-term resistance level right now.
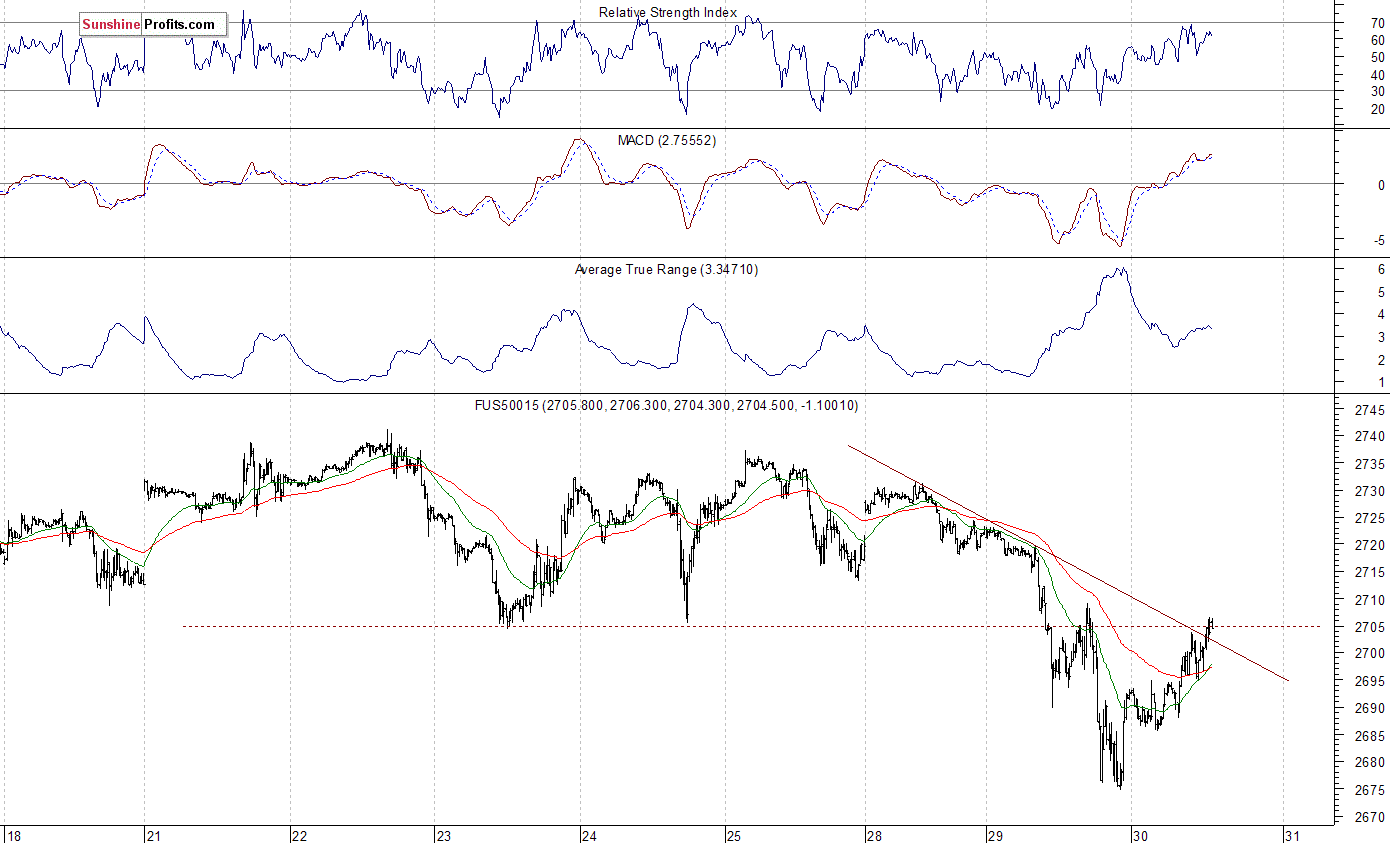
The S&P 500 futures contract trades within an intraday uptrend, as it extends its overnight move up. The nearest important level of resistance is at around 2,700-2,710, marked by previous support level and yesterday's local high. The next resistance level is at 2,715-2,720. On the other hand, support level is at 2,670-2,680, marked by local low. The futures contract trades along its short-term downward trend line, as the 15-minute chart shows:
Nasdaq Relatively Close to Highs
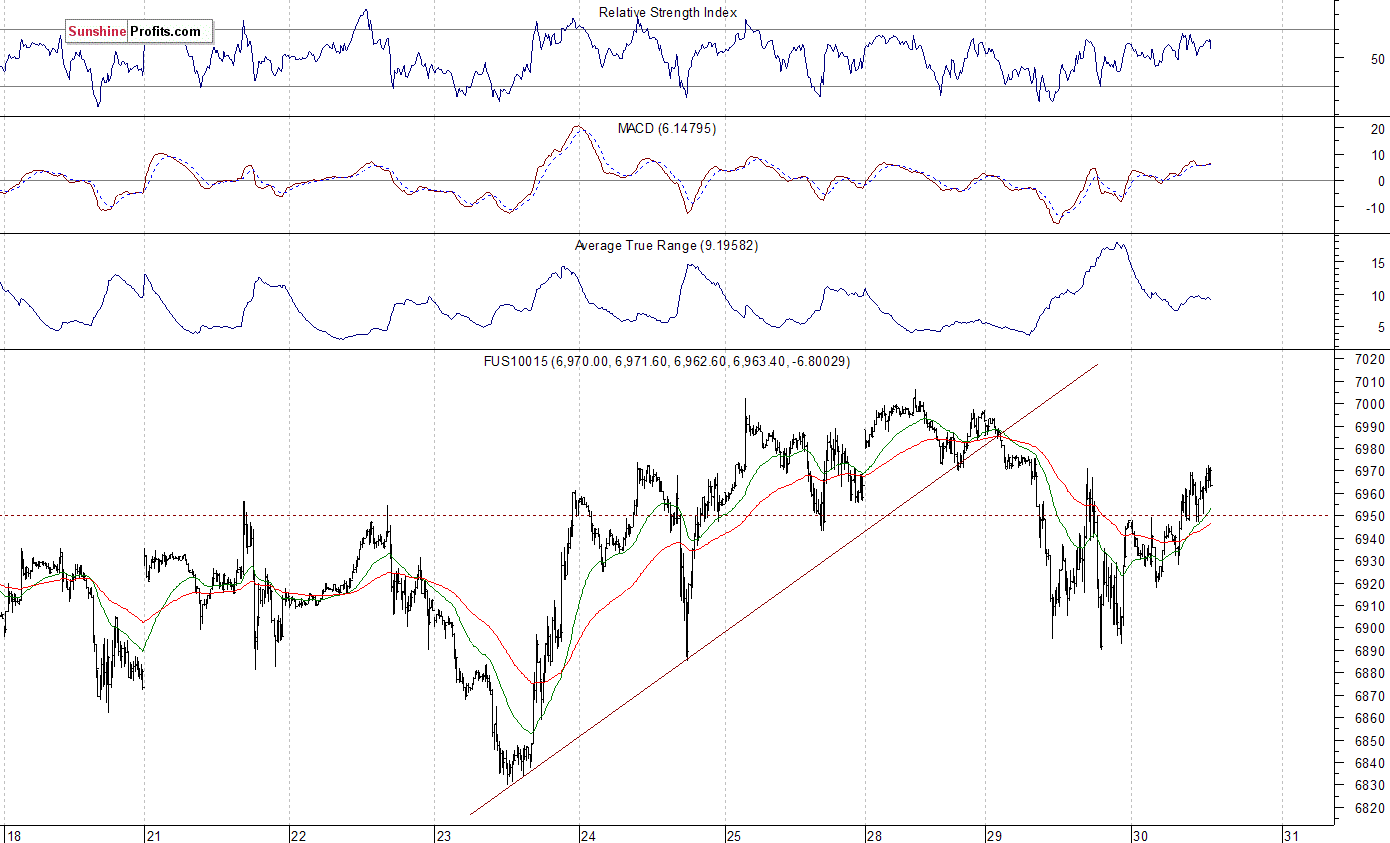
The technology Nasdaq 100 futures contract follows a similar path, as it trades within an intraday uptrend. Tech stocks index remains stronger than the broad stock market, as it still trades relatively close to 7,000 mark. It bounced off support level of around 6,900 yesterday. It has also remained within over two-week-long consolidation. The nearest important level of resistance is at 6,980-7,000. On the other hand, support level is at 6,900-6,920. The Nasdaq futures contract trades closer to its local highs, as we can see on the 15-minute chart:
Apple, Amazon - Relative Stronger Than Broad Stock Market
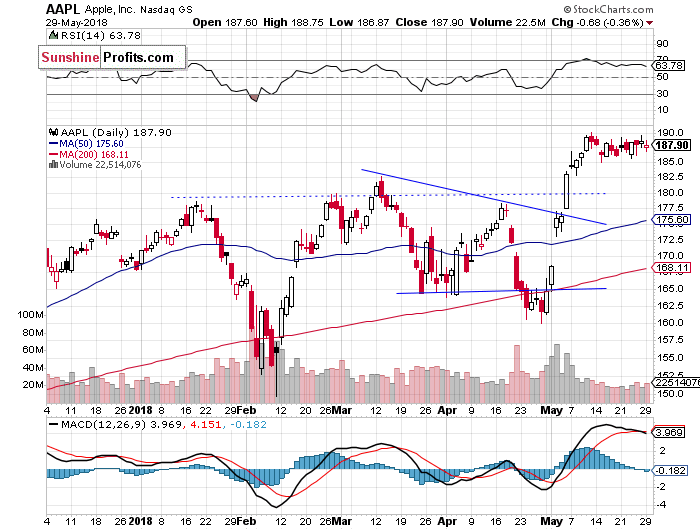
Let's take a look at Apple, Inc. stock (AAPL) daily chart (chart courtesy of http://stockcharts.com). It reached new record high more than two weeks ago, as it extended its short-term uptrend. The price bounced off resistance level of around $190-200 and since then it trades within a consolidation. It remained within a consolidation yesterday, despite broad stock market weakness. Is this a topping pattern? There have been no confirmed negative signals so far:
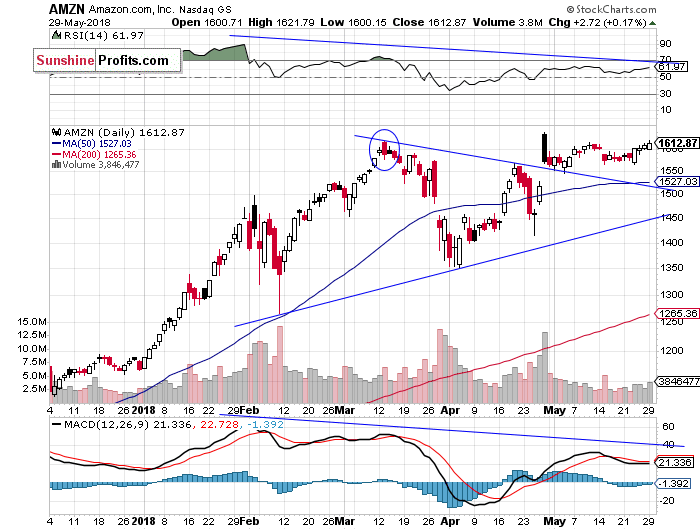
Now let's take a look at Amazon.com, Inc. stock (AMZN) daily chart. The price reached new record high of $1,638.10 in late April and on the same trading day it sold off below $1,600. Was this a downward reversal or just a correction following breakout higher? Since then, the stock traded within a consolidation. Recent price action looks pretty bullish, as price remains above $1,600:
Dow Jones Broke Lower
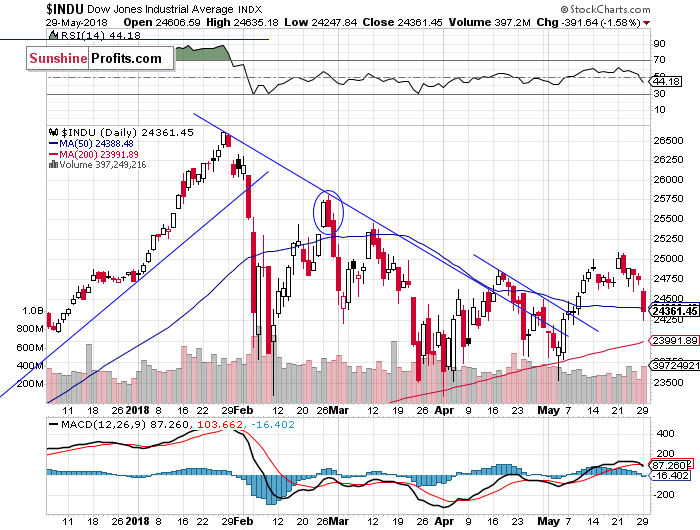
The Dow Jones Industrial Average broke above its medium-term downward trend line in the first half of May. Then it continued higher above a few-week-long downward trend line. However, it kept bouncing off resistance level of 25,000. On Tuesday we saw negative bearish engulfing candlestick pattern. The market broke below its recent consolidation yesterday, as it confirmed its short-term downward reversal. Potential level of support is at around 24,000:
The broad stock market broke below its over two-week-long consolidation yesterday, as investors reacted to global stock markets' decline. Is this a new downtrend or just correction within an uptrend from the early May low? Stocks will likely open higher today and retrace some of their yesterday's sell-off. However, there have been no confirmed positive signals so far. Just like we wrote in our several Stocks Trading Alerts, the early February sell-off sets a negative tone for weeks or months to come.
Concluding, the S&P 500 index will probably retrace some of its yesterday's decline today. There will be a series of economic data announcements, so we may see an increased volatility. For now, it looks like an upward correction before another leg lower, but if the index gets back above 2,700 mark, we could see more upward action.
Currently, we prefer to be out of the market, avoiding low risk/reward ratio medium-term trades. We will let you know when we think it is safe to get back in the market.
To summarize: no medium-term positions are justified from the risk/reward perspective at this moment.
Intraday trade:
No intraday position is justified from the risk/reward perspective today.
No medium-term position is justified from the risk/reward perspective at this moment.
There will be no Stock Trading Alert on Thursday, May 31st. We apologize for inconvenience.
Thank you.
Paul Rejczak
Stock Trading Strategist
Stock Trading Alerts

