

Briefly:
Intraday trade: Our Tuesday's intraday outlook was neutral. The S&P 500 index gained 1.7% after opening 1.0% higher. The market got back to its recent local highs and resistance level of around 2,650-2,670. Expectations before the opening of today's trading session are negative, but we will probably see some more fluctuations along the resistance level. We prefer to be out of the market, avoiding low risk/reward ratio trades.
Medium-term trade: In our opinion, no medium-term positions are justified.
Our intraday outlook is neutral. Our short-term outlook is neutral, and our medium-term outlook is neutral:
Intraday outlook (next 24 hours): neutral
Short-term outlook (next 1-2 weeks): neutral
Medium-term outlook (next 1-3 months): neutral
The main U.S. stock market indexes gained 1.7-2.1% on Tuesday, as investors' sentiment further improved. The market retraced its Monday's intraday move down and it currently trades 7.5% below its January 26 record high of 2,872.87. The Dow Jones Industrial Average gained 1.8%, and the technology Nasdaq Composite gained 2.1% on Tuesday.
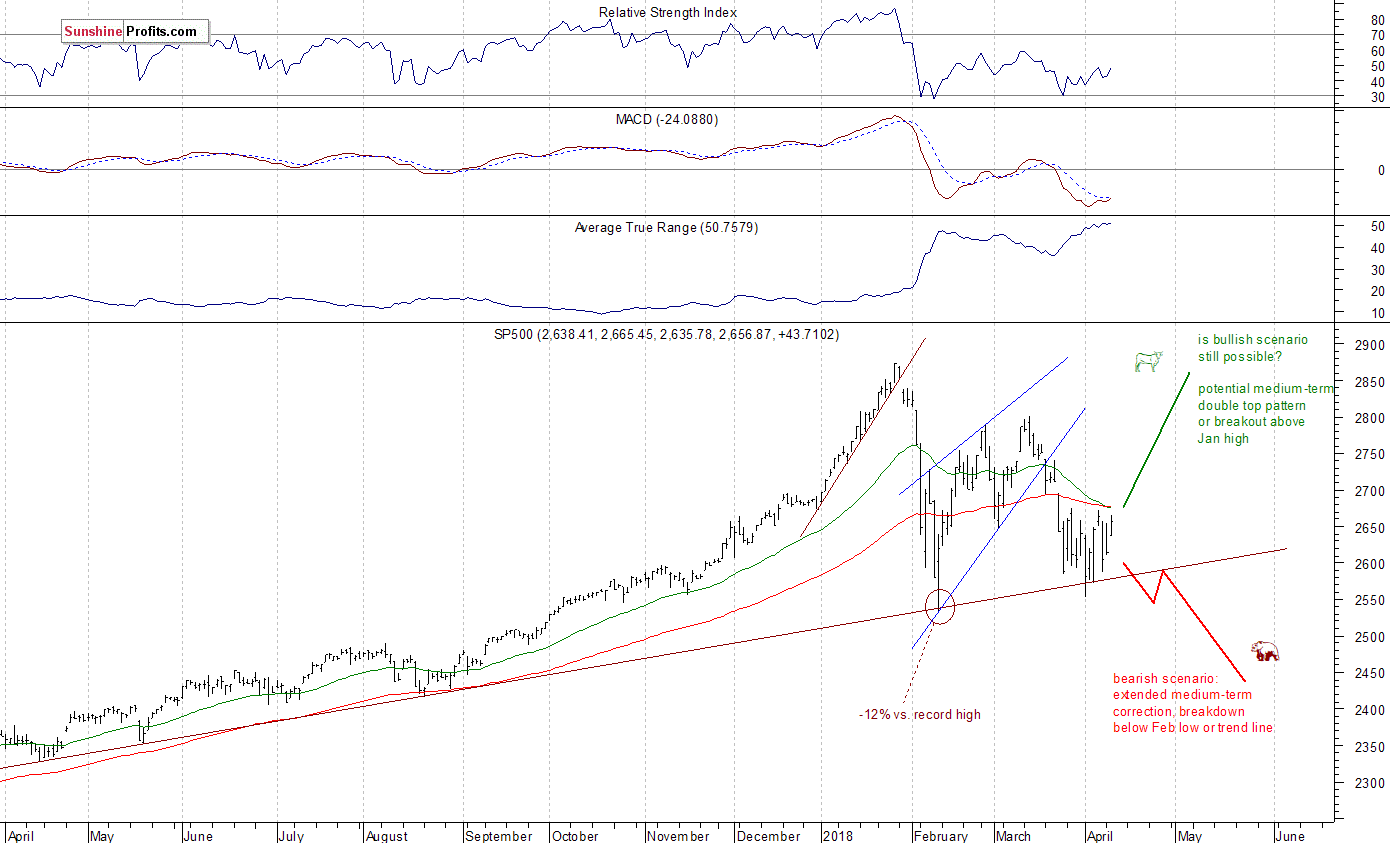
The nearest important level of resistance of the S&P 500 index is at around 2,670-2,675, marked by previous weeks' local highs. The resistance level is also at 2,695-2,710, marked by March 22 daily gap down of 2,695.68-2,709.79. On the other hand, level of support is at 2,635, marked by yesterday's daily low. The next support level is at 2,600-2,610, marked by Monday's daily low, among others.
We can see that stocks reversed their medium-term upward course following whole retracement of January euphoria rally. Then the market bounced off its almost year-long medium-term upward trend line, and it retraced more than 61.8% of the sell-off within a few days of trading. The uptrend reversed in the middle of March, and stocks retraced almost all of their February - March rebound. The index got back down to its medium-term upward trend line. There are still two possible future scenarios. The bearish one, leading us to February low or lower after breaking below medium-term upward trend line, and bullish: medium-term double top pattern or breakout higher. Friday's sell-off made the bearish case more likely, but then the market got back higher again. The broad stock market index continues to trade within a short-term consolidation along the above-mentioned upward trend line:
Lower Today, Just Downward Correction?
Expectations before the opening of today's trading session are negative, because the index futures contracts trade 0.8% lower vs. their Tuesday's closing prices. The European stock market indexes have lost 0.2-0.8% so far. Stocks will likely extend their fluctuations along short-term resistance level, and we may see more uncertainty. Investors will wait for the economic data announcements this morning: Consumer Price Index at 8:30 a.m., Crude Oil Inventories at 10:30 a.m., Fed Minutes release at 2:00 p.m. Investors will also wait for coming quarterly corporate earnings releases.
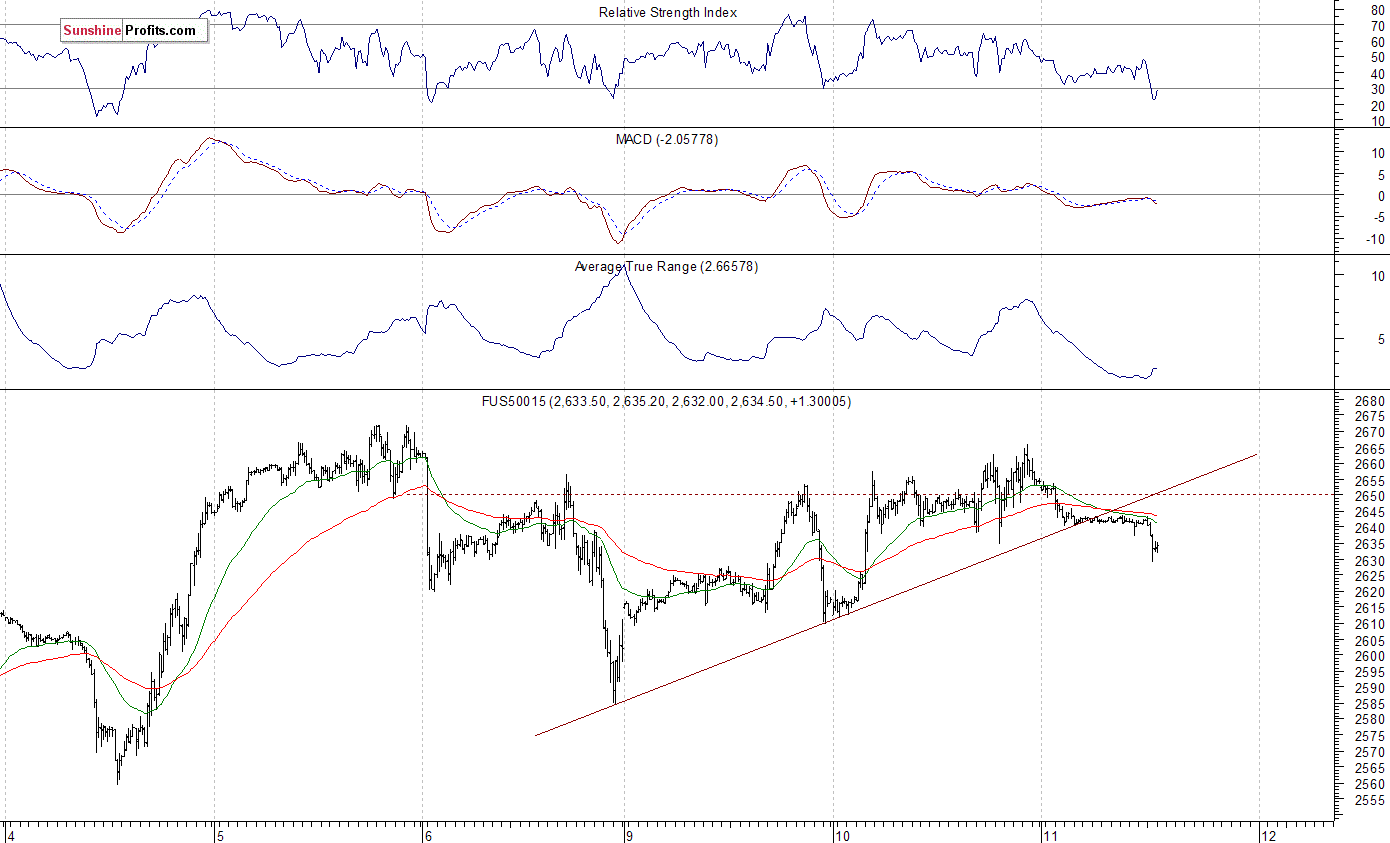
The S&P 500 futures contract trades within an intraday downtrend following an overnight move down. The nearest important level of resistance is at around 2,650, and the next one is at 2,660-2,670, marked by local highs. On the other hand, support level is now at 2,630-2,635, marked by short-term local low. The next level of support is at 2,610-2,620. The futures contract retraces some of its yesterday's advance, as the 15-minute chart shows:
Nasdaq Below 6,600 Again
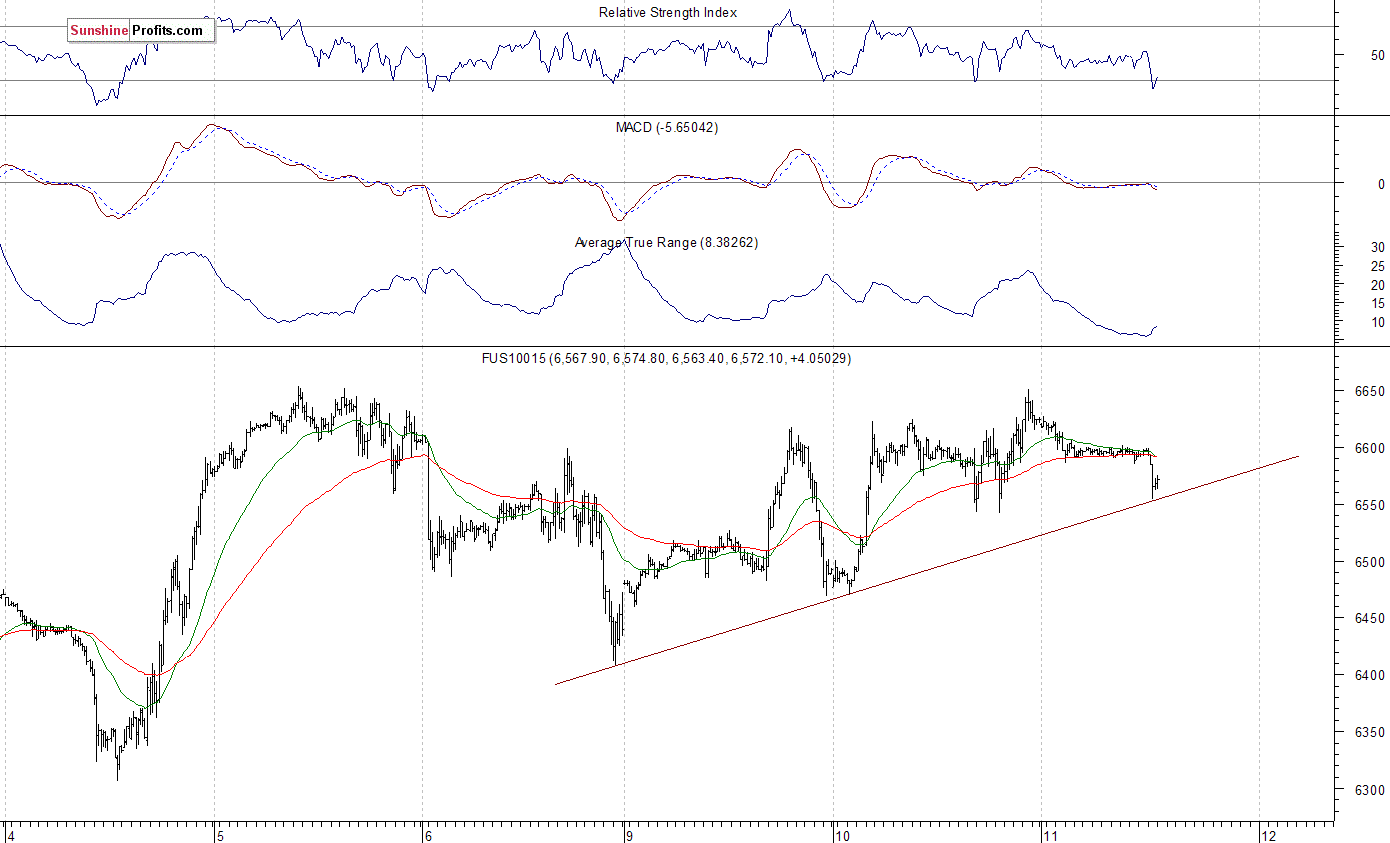
The technology Nasdaq 100 futures contract follows a similar path, as it retraces its yesterday's rally. The market remains close to the level of 6,600, following advance from last week's low of around 6,300. We still see an increased volatility. Will tech stocks break above their recent trading range or is this just some flat correction before breaking down? Bulls have a chance at breaking above short-term consolidation. The Nasdaq futures contract is close to its short-term upward trend line, as we can see on the 15-minute chart:
Facebook Rips Higher, Apple Still at Resistance Level
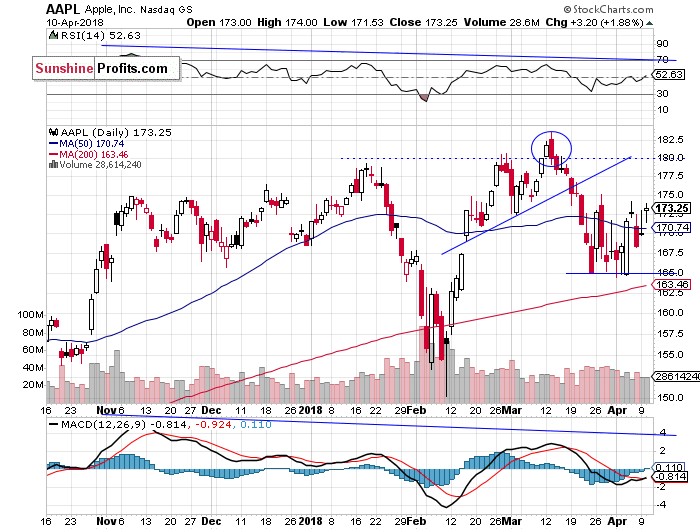
Let's take a look at Apple, Inc. stock (AAPL) daily chart (chart courtesy of http://stockcharts.com). The market extends its short-term consolidation following March move down. It continues to trade above the support level of $165, and slightly below the resistance level of $170-$175. Is this some bottoming pattern before upward reversal? If the market breaks higher, it could retrace more of March sell-off and get close to record high again:
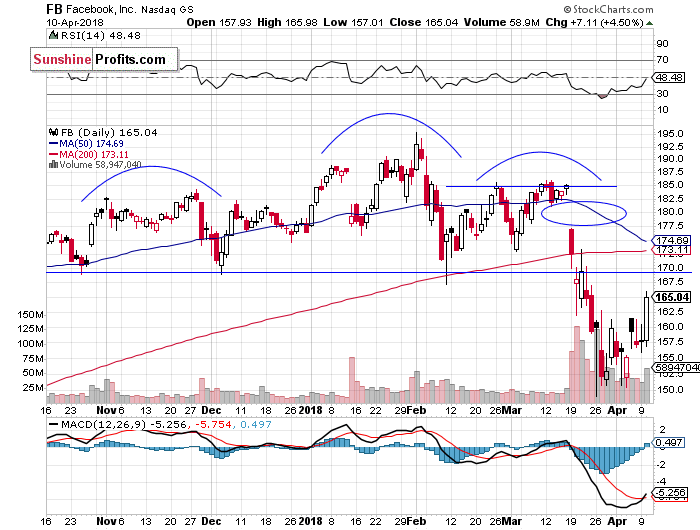
Now let's take a look at Facebook, Inc. (FB) daily chart. The price broke above its short-term consolidation yesterday, as it retraced some of its late March sell-off. Investors' sentiment improved after Mark Zuckerberg' Senate hearing. The market remains below medium-term head and shoulders downward reversal pattern. The nearest important level of resistance is at around $170. On the other hand, support level remains at $150-155, marked by recent local lows. For now, it looks like an upward correction:
Dow Jones Continues Sideways
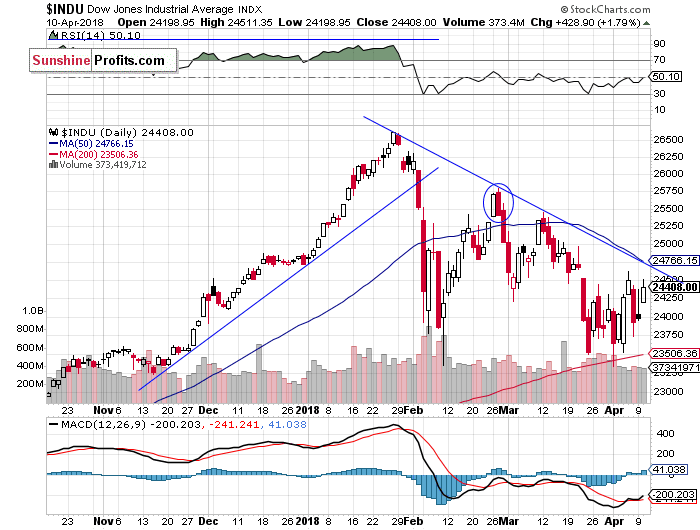
The Dow Jones Industrial Average formed a positive "Harami" candlestick pattern a week ago. Then, the market confirmed this reversal pattern despite lower opening of Wednesday's trading session. Since then it fluctuated below the resistance level of 24,500. There is also resistance level at around 24,800, marked by medium-term downward trend line. Will the blue-chip index continue higher? It would have to break above the trend line:
Concluding, the S&P 500 index is expected to open lower today, as investors' sentiment slightly worsens after yesterday's move up. The market will likely extend its short-term consolidation. There will be some economic data announcements. The coming quarterly corporate earnings releases are potentially positive for the market.
The early March rally failed to continue following monetary policy tightening, trade war fears, negative political news. What was just profit-taking action, quickly became a meaningful downward reversal. Breakdown below over-month-long rising wedge pattern made medium-term bearish case more likely, and after some quick consolidation, the index accelerated lower, towards its early February low. Just like we wrote in our several Stocks Trading Alerts, the early February sell-off set the negative tone for weeks or months to come. However, recent fluctuations may be some bottoming pattern before an upward reversal.
Currently, we prefer to be out of the market, avoiding low risk/reward ratio medium-term trades. We will let you know when we think it is safe to get back in the market.
To summarize: no medium-term positions are justified from the risk/reward perspective at this moment.
Intraday trade:
No intraday position is justified from the risk/reward perspective today.
No medium-term position is justified from the risk/reward perspective at this moment.
Thank you.
Paul Rejczak
Stock Trading Strategist
Stock Trading Alerts

