

Trading position (short-term; our opinion): Short position with a stop-loss level at 3,100 and the downside target of 2,880 (S&P 500 index), opened at around 3,008 on July the 30th (the index opening level), remains justified from the risk/reward perspective.
Intraday outlook: The broad stock market will likely open lower today. Then we may see a short-term consolidation following the recent decline.
The U.S. stock market indexes lost 0.6-1.1% on Thursday, as investors reacted to the new negative trade war developments. The S&P 500 index fell over 80 points of its Friday's new record high of 3,027.98 yesterday. The Dow Jones Industrial Average lost 1.1% and the Nasdaq Composite lost 0.8% on Thursday.
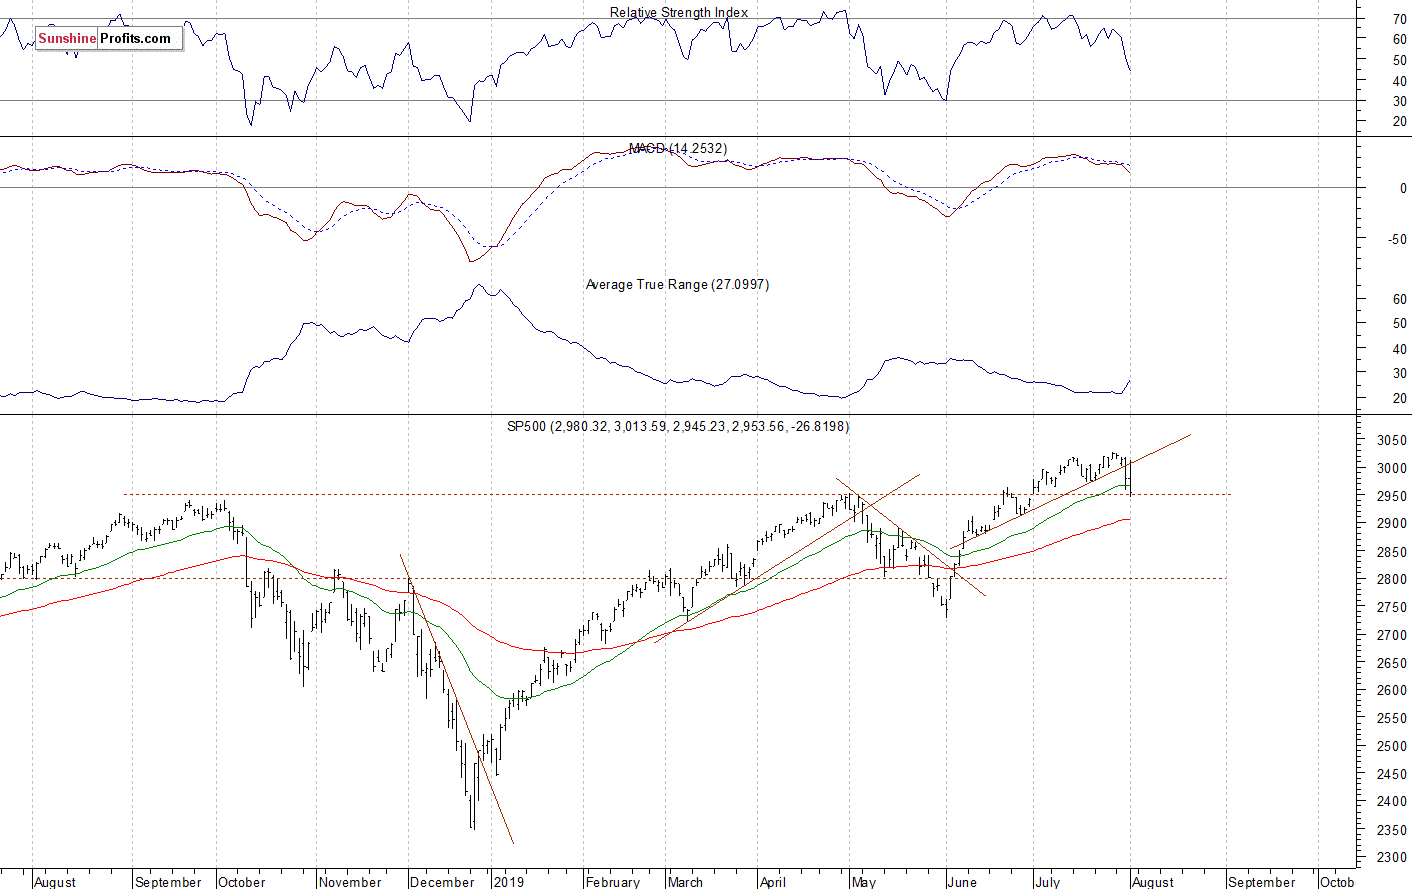
The nearest important resistance level of the S&P 500 index is now at around 2,980. The resistance level is also at 2,995-3,000, marked by the recent support level. On the other hand, the support level is at 2,945-2,955, marked by the mid-June daily gap up of 2,943.98-2,952.22 and the early May local high of around 2,954.
The broad stock market broke below its two-month-long upward trend line on Wednesday, and then it accelerated below the early May local high. Is this a downward reversal or just another correction within an over half-year-long medium-term uptrend? For now, it looks like a downward correction:
Uncertainty Ahead of Jobs Data Release
The index futures contracts trade 0.2-0.5% below their Thursday's closing prices, so expectations before the opening of today's trading session are negative. The European stock market indexes have lost 1.7-2.5% so far. Investors will wait for some important economic data announcements today: Non-Farm Employment Change, Unemployment Rate at 8:30 a.m., Revised UoM Consumer Sentiment, Factory Orders at 10:00 a.m. There will also be a speech from the President Trump at 1:45 a.m.
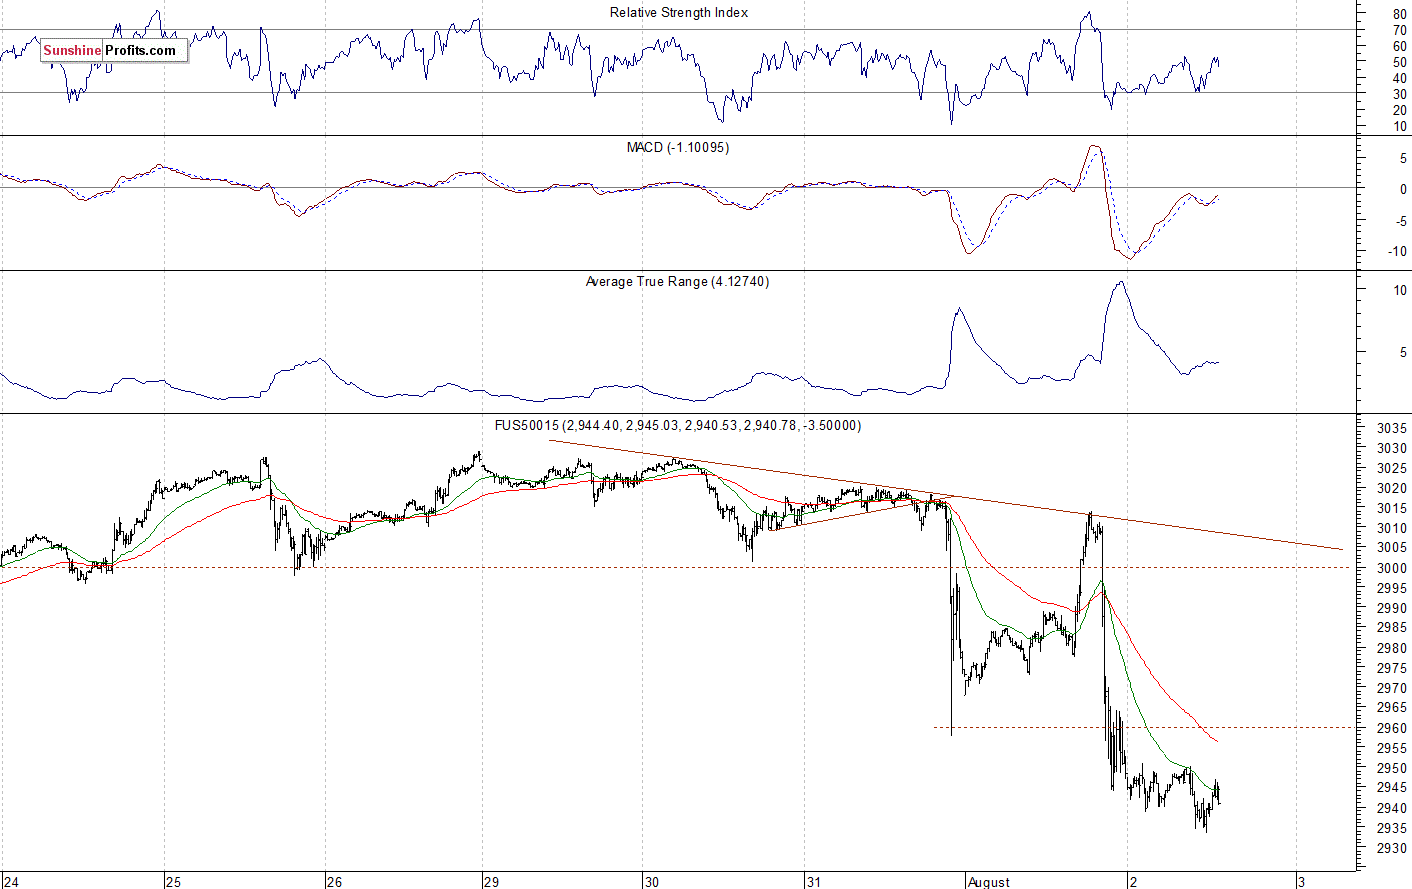
The S&P 500 futures contract trades within an intraday consolidation, as it fluctuates following yesterday's intraday sell-off. The nearest important resistance level is now at around 2,955-2,960. The next resistance level is at 2,970. On the other hand, the support level is at 2,930-2,935, among others. The futures contract remains below the Wednesday's daily low, as we can see on the 15-minute chart:
Nasdaq 100 Also Lower
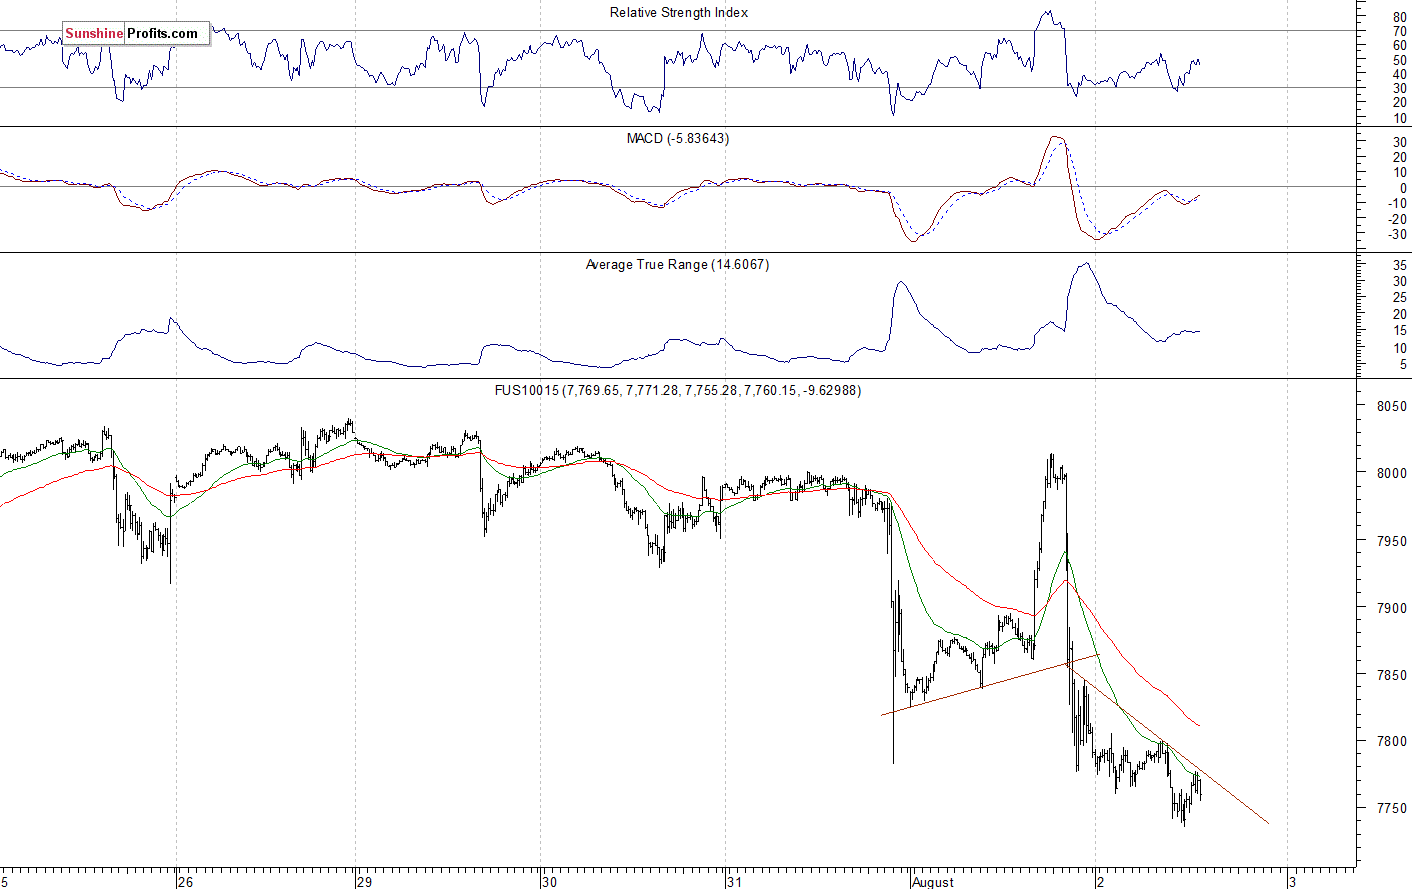
The technology Nasdaq 100 futures contract follows a similar path, as it trades within a consolidation this morning. The resistance level is now at around 7,800. On the other hand, the support level is at 7,700-7,750. The Nasdaq futures contract is below an intraday downward trend line, as the 15-minute chart shows:
Apple's Reversal Looks Confirmed
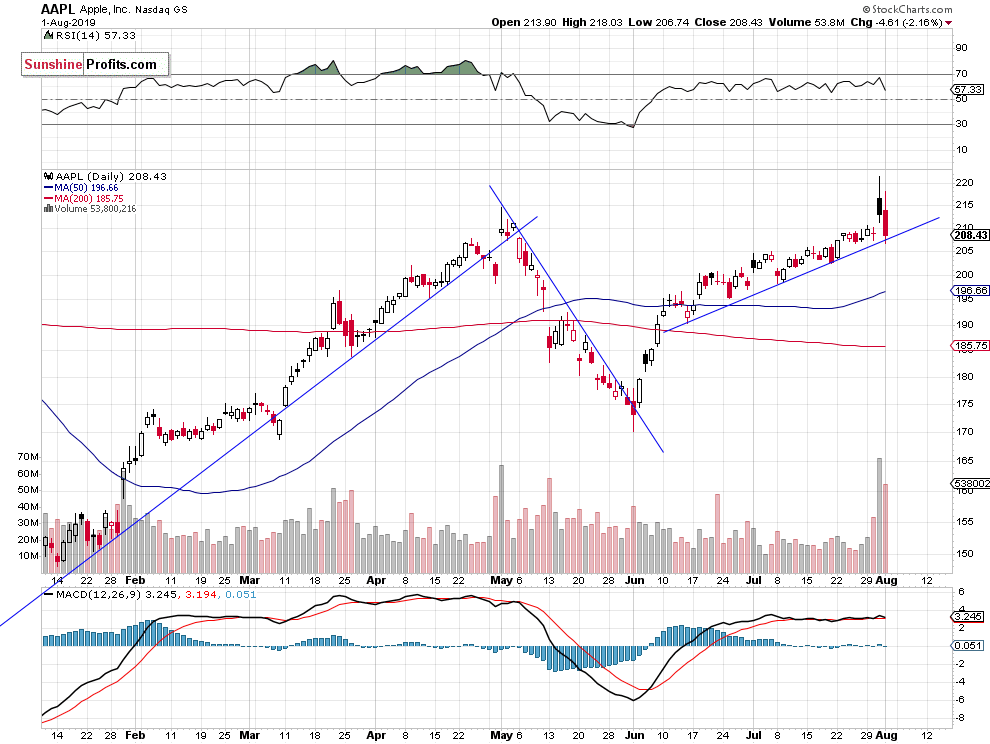
Let's take a look at the Apple, Inc. stock (AAPL) daily chart (chart courtesy of http://stockcharts.com). The stock continued to trade at the resistance level of $210-215 recently. It was the highest since the early May on Monday. But it broke higher following Tuesday's quarterly earnings release. However, the market reversed downwards off its new medium-term high:
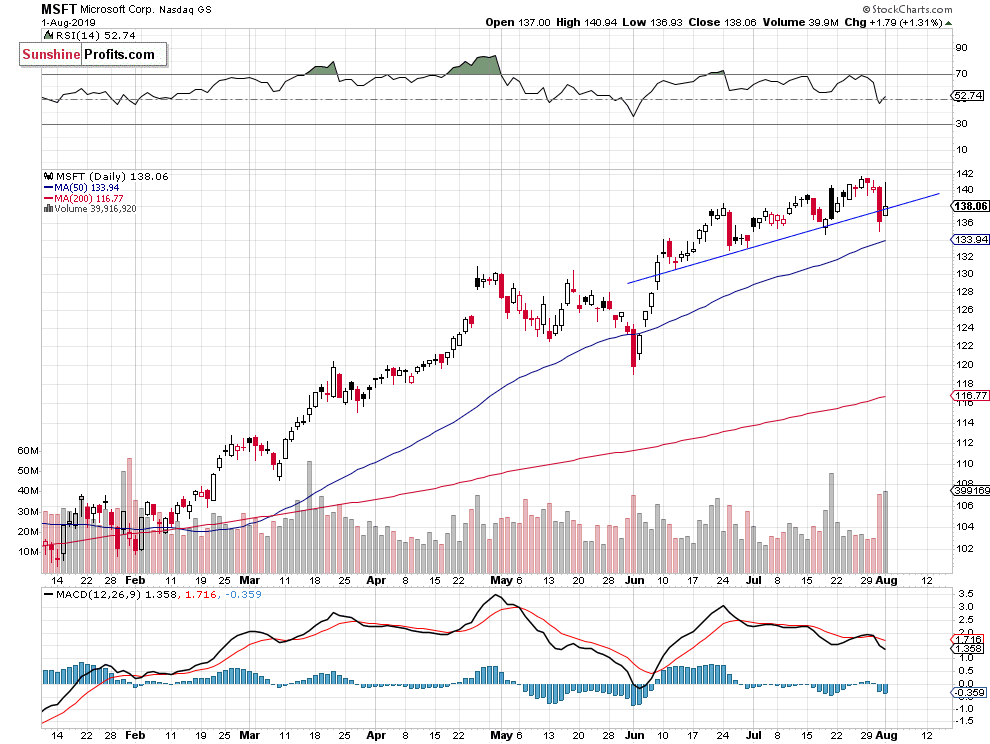
Now let's take a look at the daily chart of Microsoft Corp. stock (MSFT). The stock reached the new record high of $141.68 on Friday following recent quarterly earnings release. But on Wednesday it retraced most of the recent advance and it broke slightly below the two-month-long upward trend line. Is this a new downtrend? For now, it looks like a medium-term consolidation:
Dow Jones Below Previous High
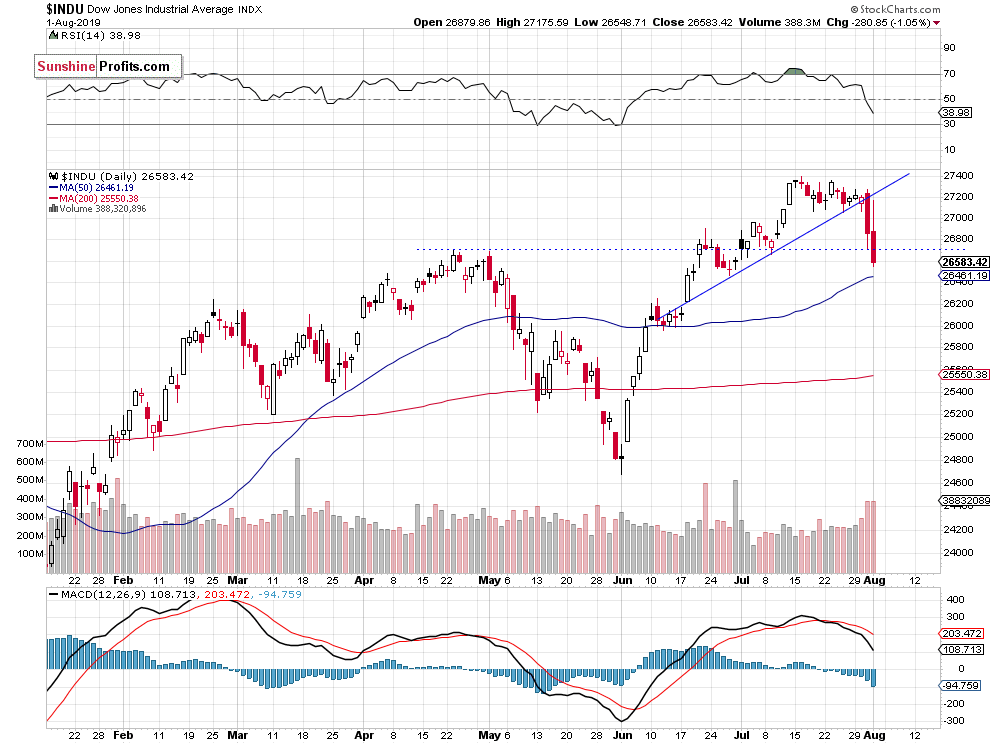
The Dow Jones Industrial Average broke below its upward trend line on Wednesday. So the recent consolidation was a topping pattern. Yesterday the market broke below its previous medium-term high. There have been no confirmed positive signals so far:
The S&P 500 index broke below the upward trend line on Wednesday, as investors reacted to the Fed's Rate Decision release. We saw technical overbought conditions along with negative technical divergences recently. And the market turned lower. But is this a new downtrend or just another downward correction within a medium-term uptrend? For now, it looks like a downward correction. However, if the index gets back below the early May local high and the mentioned mid-June daily gap up support level, we could see more selling pressure.
Concluding, the S&P 500 index will likely open lower today. Then the market may fluctuate following the recent decline. However, first and foremost investors will react to the monthly jobs data release at 8:30 a.m.
Trading position (short-term; our opinion): Short position with a stop-loss level at 3,100 and the downside target of 2,880 (S&P 500 index), opened at around 3,008 on July the 30th (the index opening level), remains justified from the risk/reward perspective.
Thank you.
Paul Rejczak
Stock Trading Strategist
Sunshine Profits - Effective Investments through Diligence and Care

