

Briefly:
Intraday trade: Our Thursday's intraday outlook was neutral. The S&P 500 index gained 0.7% after opening 0.5% higher. It basically fluctuated following higher opening. Expectations before the opening of today's trading session are negative, but the price action may be different after economic data announcements. We still prefer to be out of the market, avoiding low risk/reward ratio trades.
Medium-term trade: In our opinion, no medium-term positions are justified.
Our intraday outlook is neutral. Our short-term outlook is neutral, and our medium-term outlook is neutral:
Intraday outlook (next 24 hours): neutral
Short-term outlook (next 1-2 weeks): neutral
Medium-term outlook (next 1-3 months): neutral
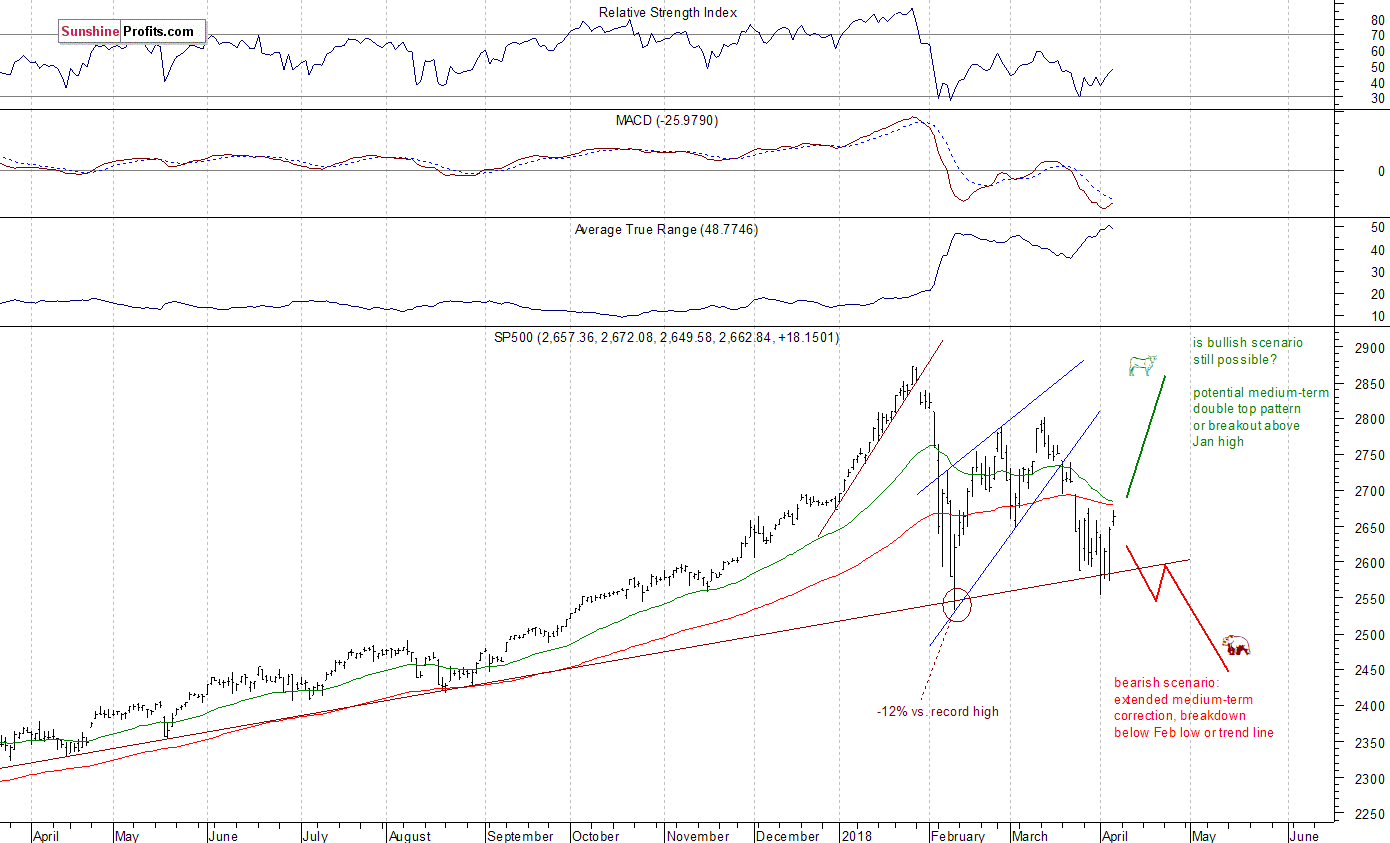
The U.S. stock market indexes gained between 0.5% and 1.0% on Thursday, extending their Wednesday's move up, as investors' sentiment remained bullish following Wednesday's rebound. The broad stock market got closer to its last week's high of around 2,675 following breakout above the level of 2,650. The S&P 500 index trades 7.2% below January 26 record high of 2,872.87. The Dow Jones Industrial Average gained 1.0%, and the technology Nasdaq Composite gained 0.5%, as big cap tech stocks were relatively weaker than the broad stock market yesterday.
The nearest important level of resistance of the S&P 500 index is now at around 2,675, marked by the above-mentioned last week's local high. The next resistance level is at 2,695-2,710, marked by March 22 daily gap down of 2,695.68-2,709.79. On the other hand, level of support is now at 2,650, marked by recent resistance level. The next support level is at 2,620, marked by Tuesday's daily high.
We can see that stocks reversed their medium-term upward course following whole retracement of January euphoria rally. Then the market bounced off its almost year-long medium-term upward trend line, and it retraced more than 61.8% of the sell-off within a few days of trading. The uptrend reversed in the middle of March, and stocks retraced almost all of their February - March rebound. The index got back down to medium-term upward trend line. There are still two possible future scenarios. The bearish one, leading us to February low or lower after breaking below medium-term upward trend line, and bullish: medium-term double top pattern or breakout higher. Previous week's sell-off made the bearish case more likely, almost a certainty. This week's action was pretty bearish, but it seems that bulls have regained some control on Wednesday and Thursday. So, is bullish case more likely now? There have been no confirmed positive signals so far. The broad stock market gauge continues to trade within a short-term consolidation along the above-mentioned upward trend line:
Negative Expectations, but Jobs Data Release Ahead
Expectations before the opening of today's trading session are negative, because the index futures contracts trade 0.5-0.8% below their yesterday's closing prices. The main European stock market indexes have lost 0.3-0.5% so far. Investors will now wait for some important economic data announcements today: Nonfarm Payrolls, Unemployment Rate at 8:30 a.m. Will these releases improve sentiment weakened by overnight trade tariffs news? It's hard to say. However, investors' sentiment may be improving ahead of coming quarterly corporate earnings releases.
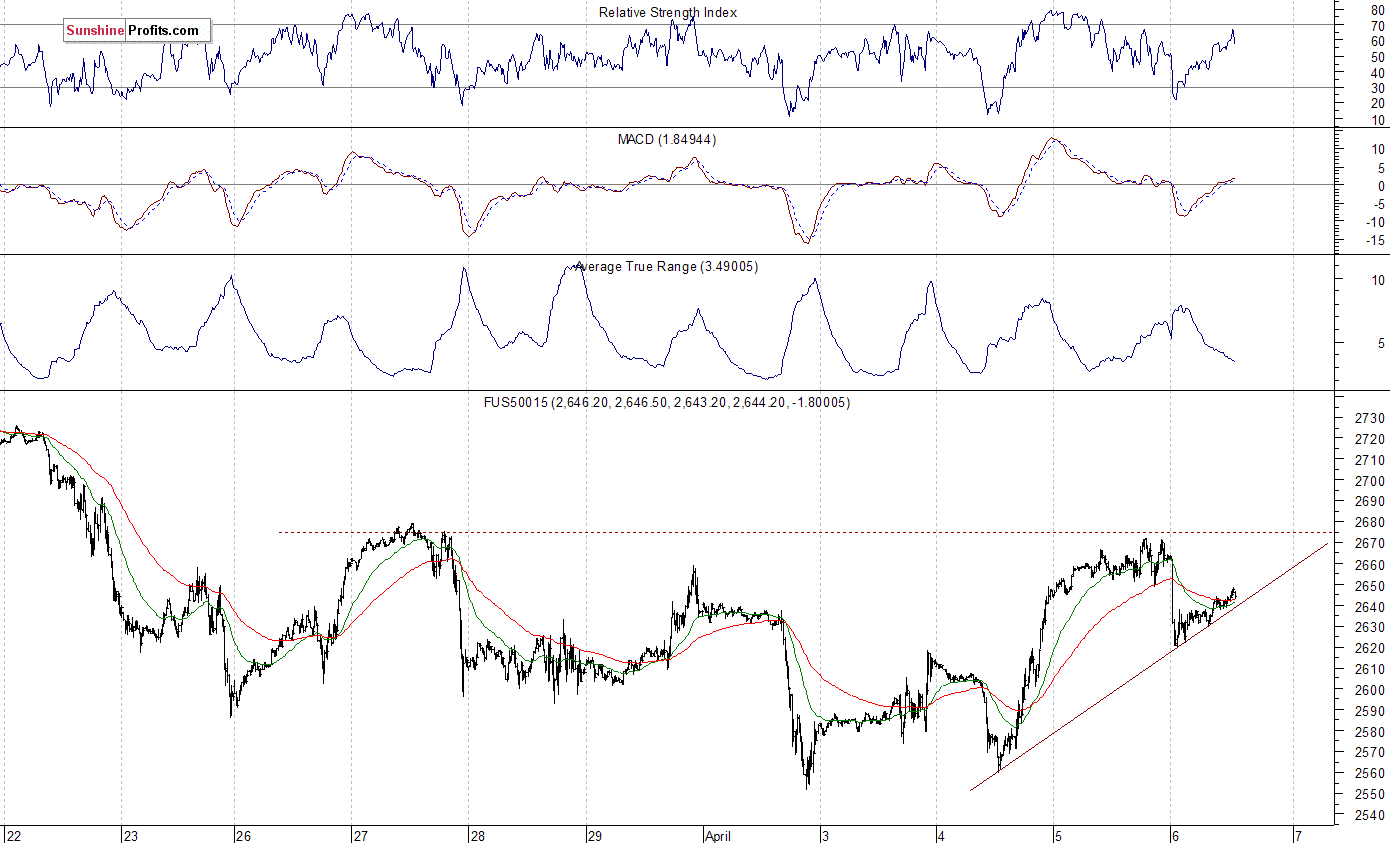
The S&P 500 futures contract trades within an intraday uptrend, as it retraces some of its overnight move down. The nearest important level of resistance is at around 2,660-2,670, marked by yesterday's intraday topping action. On the other hand, level of support is at 2,620, marked by local low. The futures contract is climbing along its short-term upward trend line so far, as we can see on the 15-minute chart:
Nasdaq Bounces Off Overnight Low
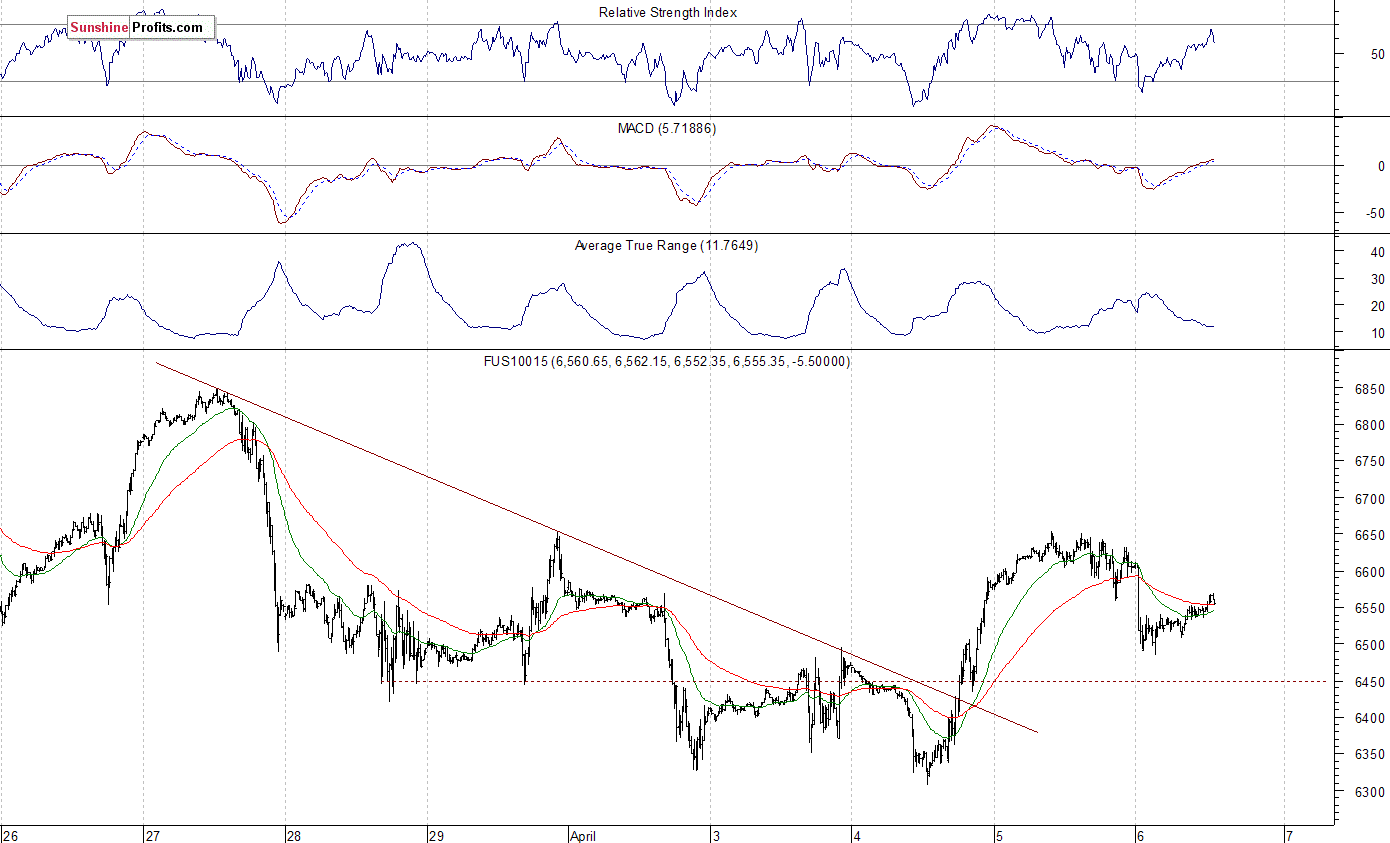
The technology Nasdaq 100 futures contract follows a similar path, as it trades within an intraday uptrend. The market broke above the level of 6,600, following Wednesday's rebound off 6,300 mark. So, we still see an increased volatility. Was this a final panic selling before more meaningful upward reversal? It is hard to say, but bulls are on the run, despite an overnight weakness. The Nasdaq futures contract extends its fluctuations after breaking above short-term downward trend line, as the 15-minute chart shows:
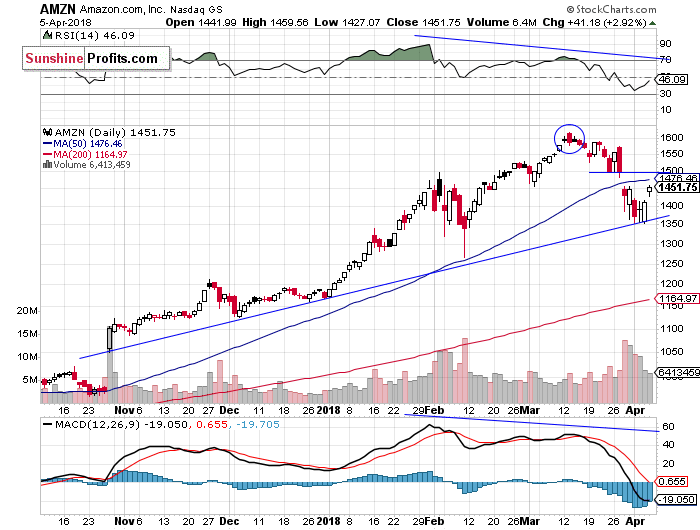
Apple, Amazon Confirming Upward Reversal
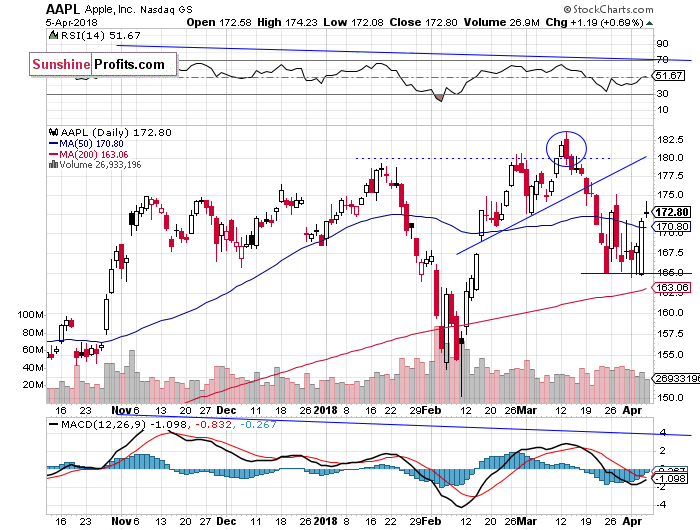
Let's take a look at Apple, Inc. stock (AAPL) daily chart (chart courtesy of http://stockcharts.com). The market was bouncing off support level at $165 recently and it got closer to the price of $175 yesterday. Is this some bottoming pattern before upward reversal? If the market breaks higher, it could retrace more of March sell-off and get close to record high again. The support level remains at $165, as we can see on the daily chart:
Now let's take a look at Amazon.com, Inc. (AMZN) daily chart. The price bounced off its medium-term upward trend line recently. It continued upwards yesterday. There is some potential resistance level, marked by late March daily gap down. So, we could see selling pressure at $1,450-1,500. The nearest important support level is now at around $1,400. The support level is also at $1,350, marked by the above-mentioned trend line:
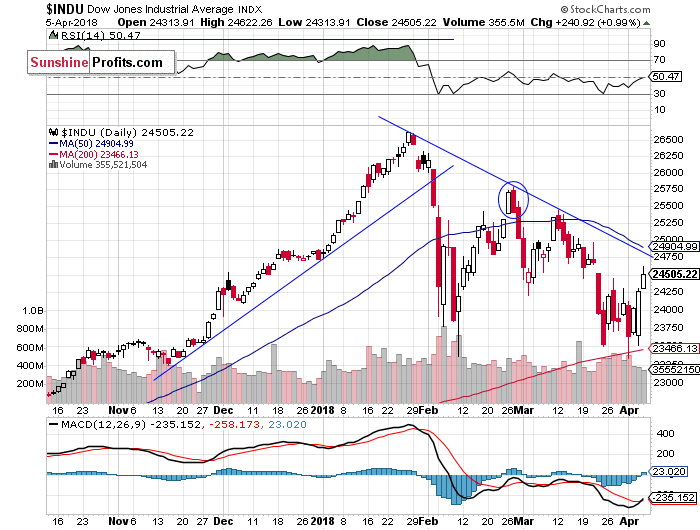
Dow Jones Closer to Downward Trend Line
The Dow Jones Industrial Average formed a positive "Harami" candlestick pattern on Tuesday. Then, the market confirmed this reversal pattern despite lower opening of Wednesday's trading session. DJIA continued higher yesterday, as it broke slightly above its two-week-long trading range. Will the blue-chip index reach its medium-term downward trend line? There is a resistance level at around 24,750:
Concluding, the S&P 500 index is expected to open lower following additional trade tariffs overnight announcement. However, there will be monthly jobs data release at 8:30 a.m. So, we may see more volatility ahead of the opening of today's trading session. The coming quarterly corporate earnings releases are potentially positive for the market.
The early March rally failed to continue following monetary policy tightening, trade war fears, negative political news. What was just profit-taking action, quickly became a meaningful downward reversal. Breakdown below over-month-long rising wedge pattern made medium-term bearish case more likely, and after some quick consolidation, the index accelerated lower, towards its early February low. Just like we wrote in our several Stocks Trading Alerts, the early February sell-off set the negative tone for weeks or months to come.
Currently, we prefer to be out of the market, avoiding low risk/reward ratio medium-term trades. We will let you know when we think it is safe to get back in the market.
To summarize: no medium-term positions are justified from the risk/reward perspective at this moment.
Intraday trade:
No intraday position is justified from the risk/reward perspective today.
No medium-term position is justified from the risk/reward perspective at this moment.
Thank you.
Paul Rejczak
Stock Trading Strategist
Stock Trading Alerts

