

Briefly:
Intraday trade: The S&P 500 index lost 0.2% on Monday, after opening 0.2% lower. So our Monday's intraday neutral outlook proved accurate. The stock market will likely open much lower today as investors' sentiment worsens following global stock markets' sell-off. We prefer to be out of the market, avoiding low risk/reward ratio trades.
Medium-term trade: In our opinion, no medium-term positions are justified.
Our intraday outlook is neutral. Our short-term outlook is neutral, and our medium-term outlook is neutral:
Intraday outlook (next 24 hours): neutral
Short-term outlook (next 1-2 weeks): neutral
Medium-term outlook (next 1-3 months): neutral
The U.S. stock market indexes were mixed between -0.4% and 0.0% on Monday, as investors hesitated following Friday's fluctuations. The S&P 500 index remained relatively close to its mid-March local high of around 2,800. It currently trades 3.4% below January's 26th record high of 2,872.87. The Dow Jones Industrial Average lost 0.4%, and the technology Nasdaq Composite was unchanged on Monday.
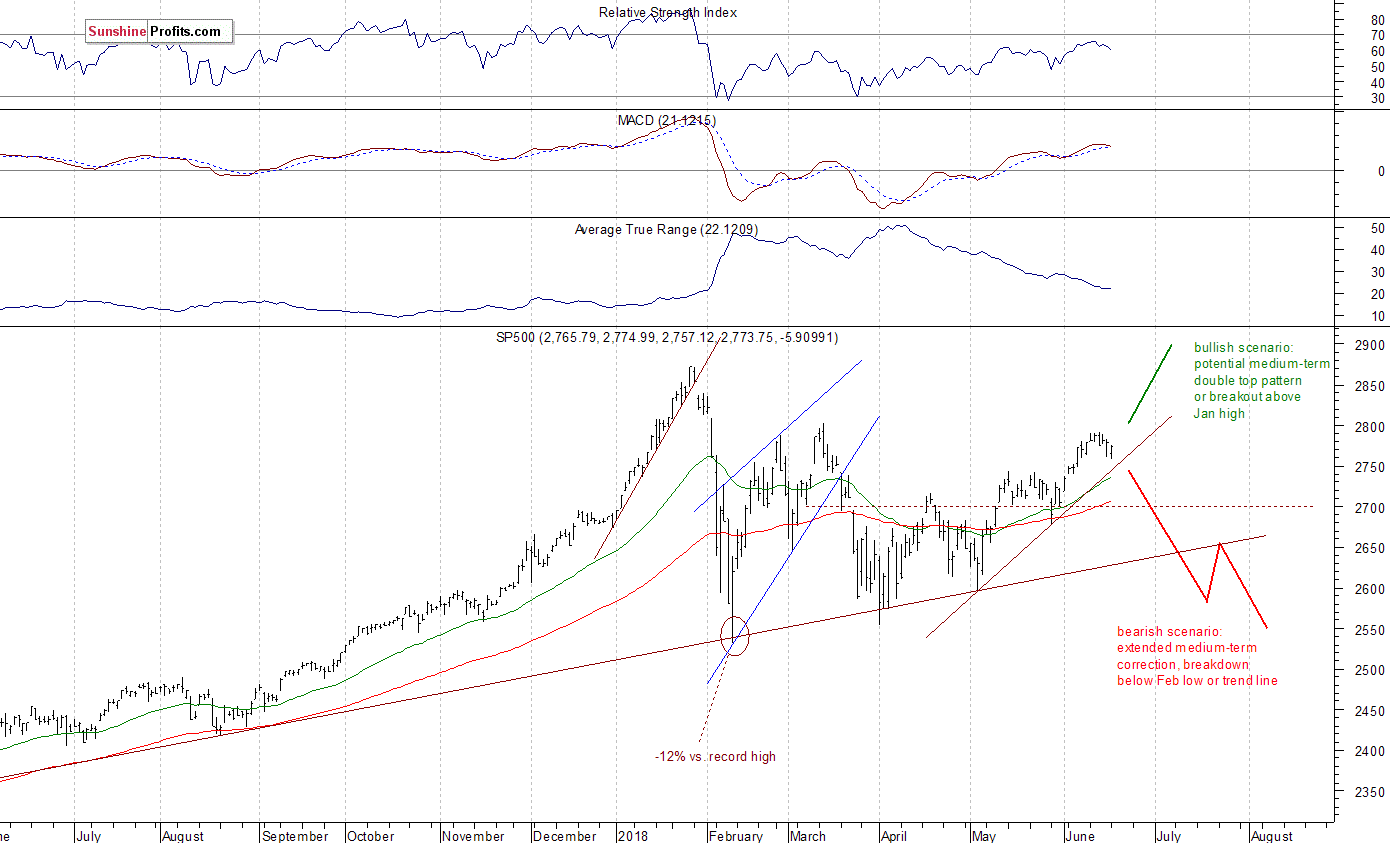
The nearest important level of resistance of the S&P 500 index remains at around 2,780-2,800, marked by the recent local highs along with mid-March local high. The resistance level is also at 2,830-2,840, marked by the late January short-term consolidation. On the other hand, support level is at 2,750, marked by the previous level of resistance. The next important level of support is at 2,735-2,740, marked by last week's Monday's daily gap-up of 2,736.93-2,740.54. The support level is also at 2,700-2,720.
The broad stock market traded within a short-term consolidation recently, as investors took profits off the table following the early June rally. The S&P 500 index bounced off its resistance level of around 2,800, and it looks like it may retrace some of its April-June advance. Is this a new downtrend or just downward correction? There are still two possible medium-term scenarios - bearish that will lead us below February low following trend line breakdown, and the bullish one in a form of medium-term double top pattern or breakout towards 3,000 mark. There is also a chance that the market will just go sideways for some time, and that would be positive for bulls in the long run (some kind of an extended flat correction):
Negative Expectations, Still a Correction?
Expectations before the opening of today's trading session are very negative, because the index futures contracts trade 1.0-1.3% below their Monday's closing prices. The European stock market indexes have lost 0.5-1.2% so far. Investors will wait for some economic data announcements today: Housing Starts, Building Permits at 8:30 a.m. The broad stock market will likely retrace most of its early June rally at the opening of today's trading session. Will the index continue below the support level of 2,700-2,720? Probably not. We may see a bounce or an upward reversal off that support level. However, it could be just some dead-cat-bounce upward correction.
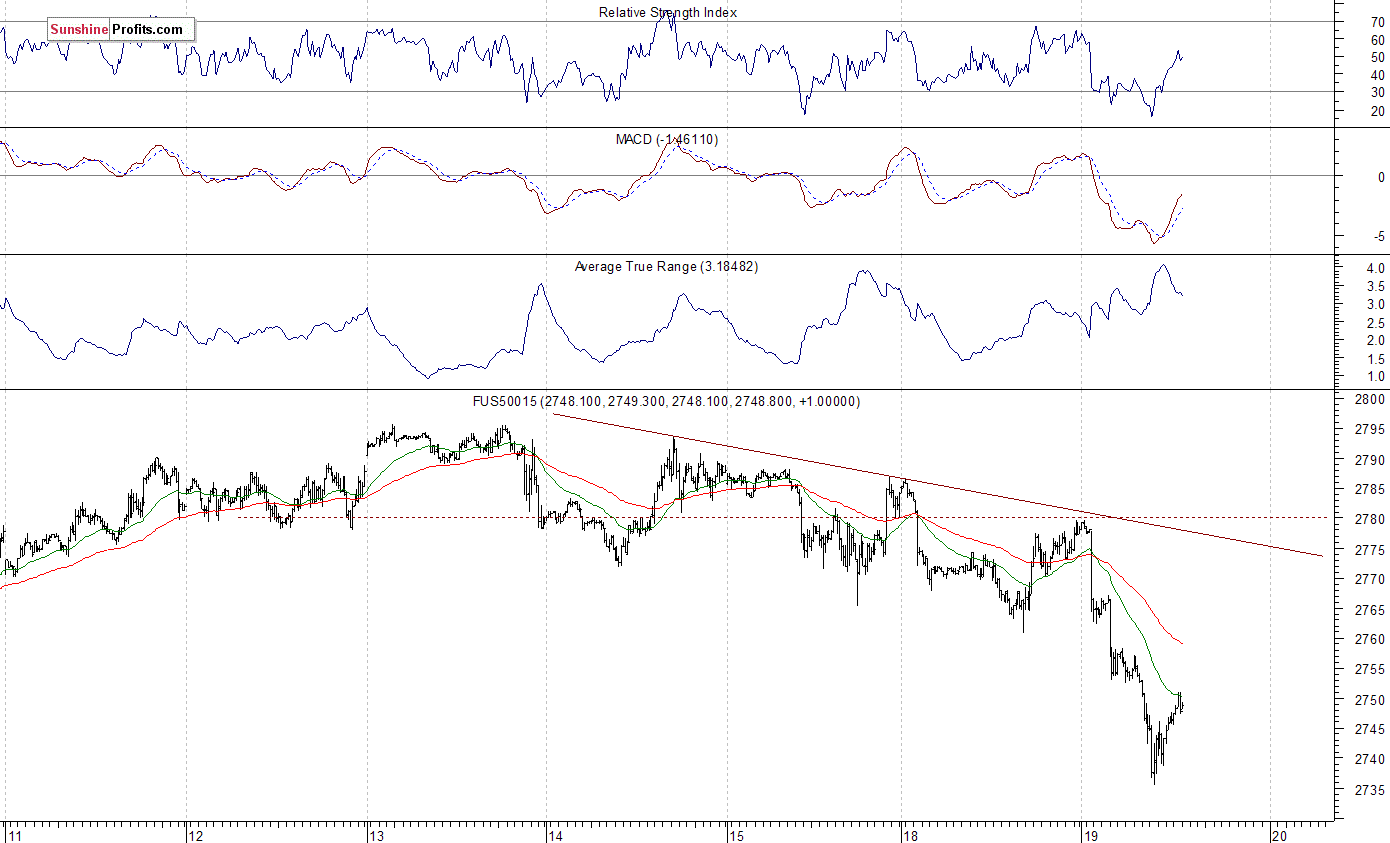
The S&P 500 futures contract trades within an intraday downtrend, as it extends its overnight sell-off. The nearest important level of support is at around 2,735-2,740, marked by today's local low and some previous local highs. On the other hand, the https://www.sunshineprofits.com/gold-silver/dictionary/gold-correction/ is at 2,750-2,755, marked by the previous support level. The resistance level is also at 2,760-2,765. The futures contract trades below its recent consolidation, as we can see on the 15-minute chart:
Nasdaq Also Lower
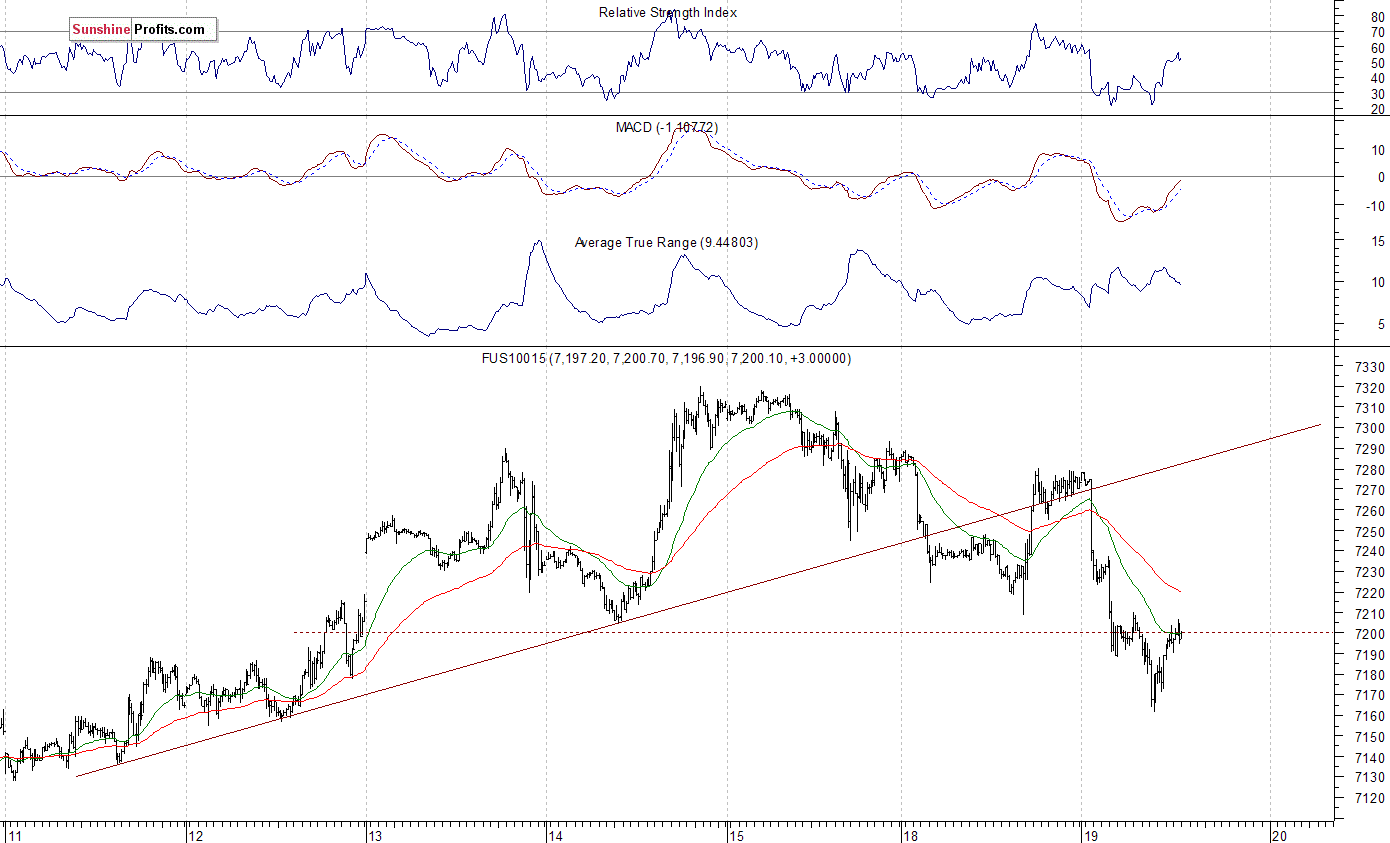
The technology Nasdaq 100 futures contract follows a similar path, as it trades much lower after going down overnight. The nearest important level of resistance is at around 7,200-7,220, marked by the recent local low. The resistance level is also at 7,250-7,280. On the other hand, support level is at 7,150, and the next level of support remains at 7,000-7,100. The Nasdaq futures contract trades along the level of 7,200, as the 15-minute chart shows:
Apple Drifts Lower, Amazon at New Record High
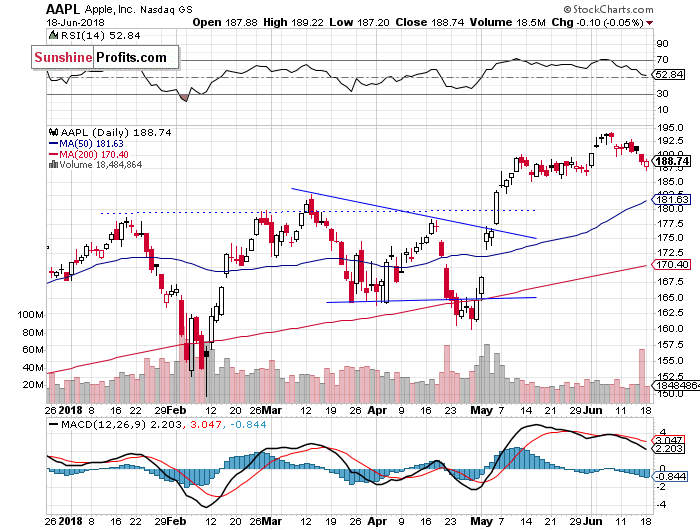
Let's take a look at Apple, Inc. stock (AAPL) daily chart (chart courtesy of http://stockcharts.com). It reached new record high two weeks ago, as it slightly extended its uptrend following a breakout above the price of $190. Then the stock retraced some of its advance, as it fell below $190 again. It will probably continue its short-term downtrend today. Potential support level is at around $185, marked by the previous local lows:
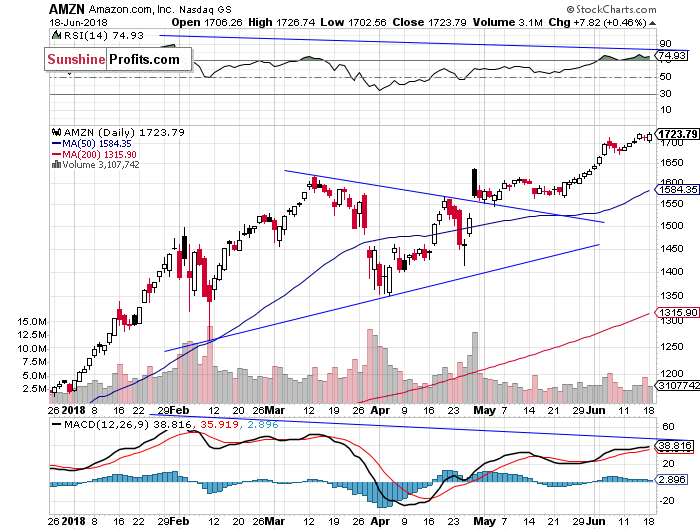
Now let's take a look at Amazon.com, Inc. stock (AMZN) daily chart. It reached new record high yesterday at the level of $1,726.74. So the stock remains relatively very strong vs. the broad stock market. But will it remain close to all-time high when the whole market is about to retrace most of its early June rally? The nearest important level of support is at around $1,670-1,700, marked by the recent local lows. We still can see some negative technical divergences:
Dow Jones at its Upward Trend Line
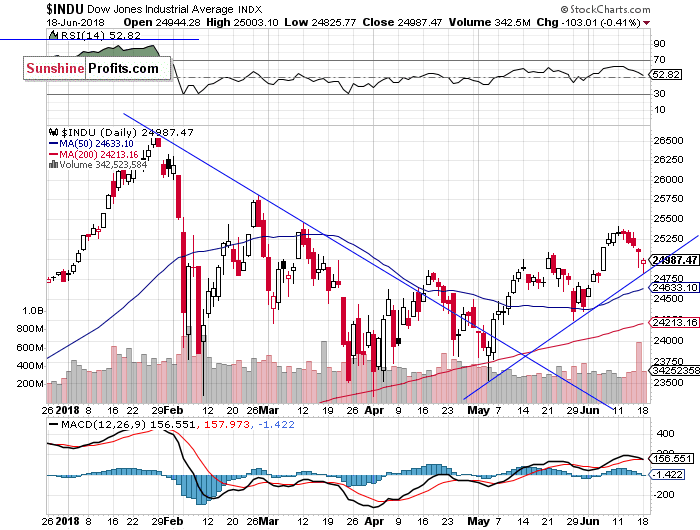
The Dow Jones Industrial Average broke below its short-term consolidation on Friday and it fell closer the level of 25,000. The blue-chip stocks' gauge may break below its two-month-long upward trend line today. Will it continue much lower? For now, it looks like a downward correction within an uptrend. However, if DJIA breaks below the support level of around 24,250-24,500, we could see some more selling pressure:
The S&P 500 index is likely to open much lower today, as investors react to negative news release about new trade tariffs on China. So is this a downward reversal and the beginning of a new downtrend? For now, it looks like a downward correction following almost three-month-long advance. However, if the index breaks below the support level of 2,700-2,720, we could see more selling pressure.
Concluding, stocks will probably open much lower today, as investors react to global stock markets' rout. For now, it looks like a downward correction within a three-month-long uptrend. So there is a chance, the S&P 500 index will bounce off support level of around 2,700-2,720. If not, we could see more selling pressure.
Currently, we prefer to be out of the market, avoiding low risk/reward ratio medium-term trades. We will let you know when we think it is safe to get back in the market.
To summarize: no medium-term positions are justified from the risk/reward perspective at this moment.
Intraday trade:
No intraday position is justified from the risk/reward perspective today.
No medium-term position is justified from the risk/reward perspective at this moment.
Thank you.
Paul Rejczak
Stock Trading Strategist
Stock Trading Alerts

