

Briefly:
Intraday trade: The S&P 500 index gained 1.9% on Thursday, after opening 0.7% higher. The broad stock market will probably open much lower today. We may see an attempt at breaking below the recent local lows. There have been no confirmed positive signals so far.
Trading position (short-term; our opinion): no positions are justified from the risk/reward perspective.
Our short-term outlook is neutral, and our medium-term outlook is neutral:
Short-term outlook (next 1-2 weeks): neutral
Medium-term outlook (next 1-3 months): neutral
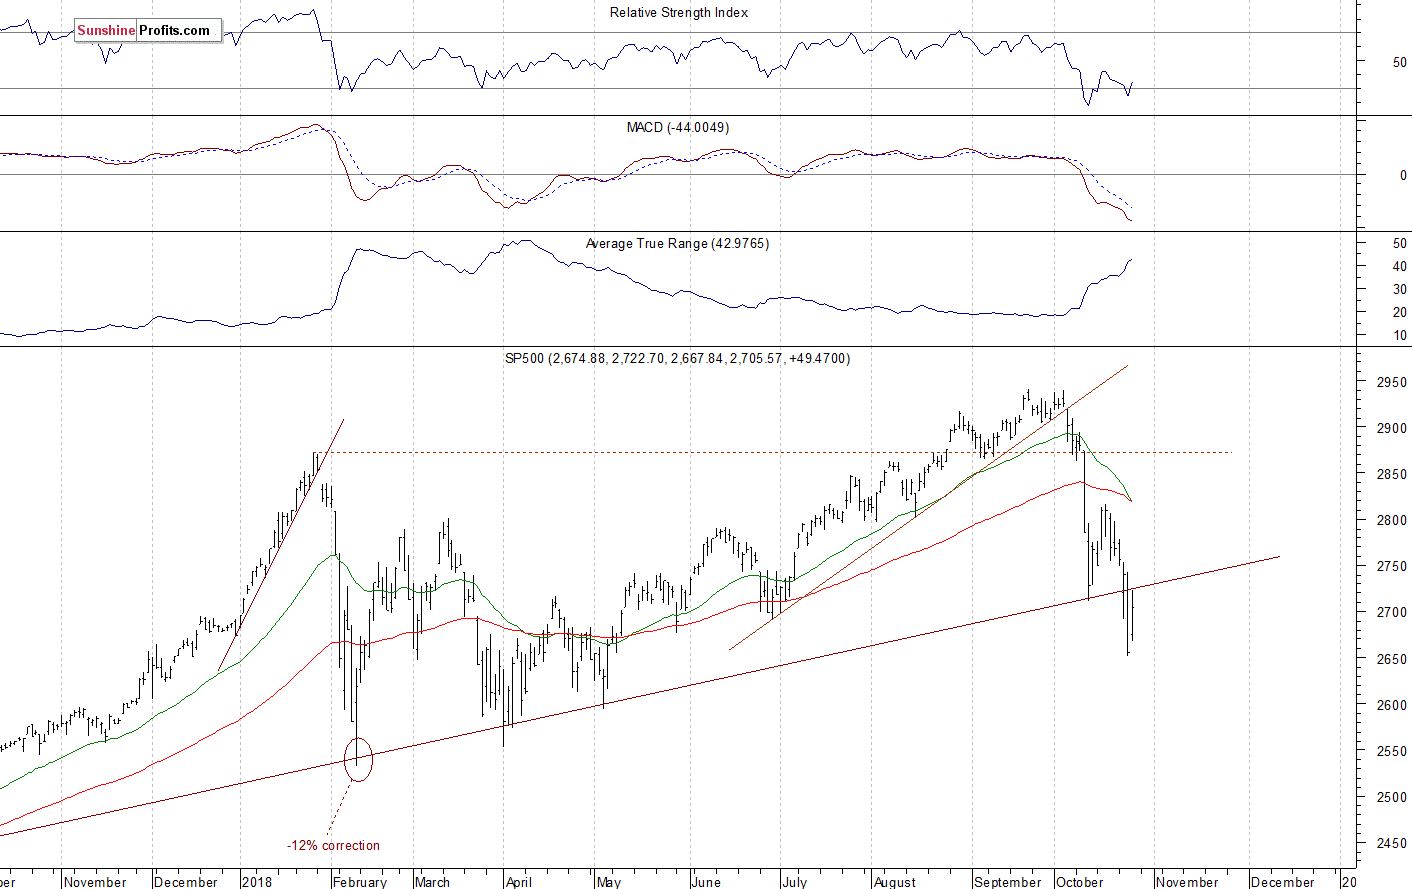
The U.S. stock market indexes gained 1.6-3.0% on Thursday, retracing some of their recent sell-off, as investors' sentiment improved ahead of the quarterly earnings releases. The S&P 500 index got back above 2,700 mark. It currently trades 8.0% below its September the 21st record high of 2,940.91. The Dow Jones Industrial Average gained 1.6% and the Nasdaq Composite gained 3.0% on Thursday.
The nearest important level of resistance of the S&P 500 index is now at around 2,730, marked by the long-term upward trend line. The next resistance level is at 2,750-2,760. On the other hand, the support level is at 2,650-2,670, marked by the recent local lows. The next support level is at 2,600-2,620.
The broad stock market accelerated its downtrend recently, as the S&P 500 index fell below 2,700 mark. Since then it is fluctuating within a volatile consolidation. Yesterday it retraced some of the sell-off, but it is expected to open much lower today. The S&P 500 index fell almost 10% off its late September record high, so the downward correction is still slightly smaller than January's-February's sell-off of 12%. And there have been no confirmed positive signals so far:
Very Negative Expectations
Expectations before the opening of today's trading session are very negative today, because the index futures contracts trade 0.9-2.3% below their yesterday's closing prices. However, their Thursday's closing prices were way below the closing price of the cash market. So today's opening price of the cash market will be even lower than the futures contracts' quotes indicate. The European stock market indexes have lost 1.5-2.4% so far. Investors will wait for some economic data announcements this morning: Advance GDP number at 8:30 a.m., Michigan Sentiment at 10:00 a.m. Investors will also wait for more quarterly earnings releases. The broad stock market will likely get back down to its Wednesday's local low. We may see an attempt at breaking lower. We still can see some short-term technical oversold conditions.
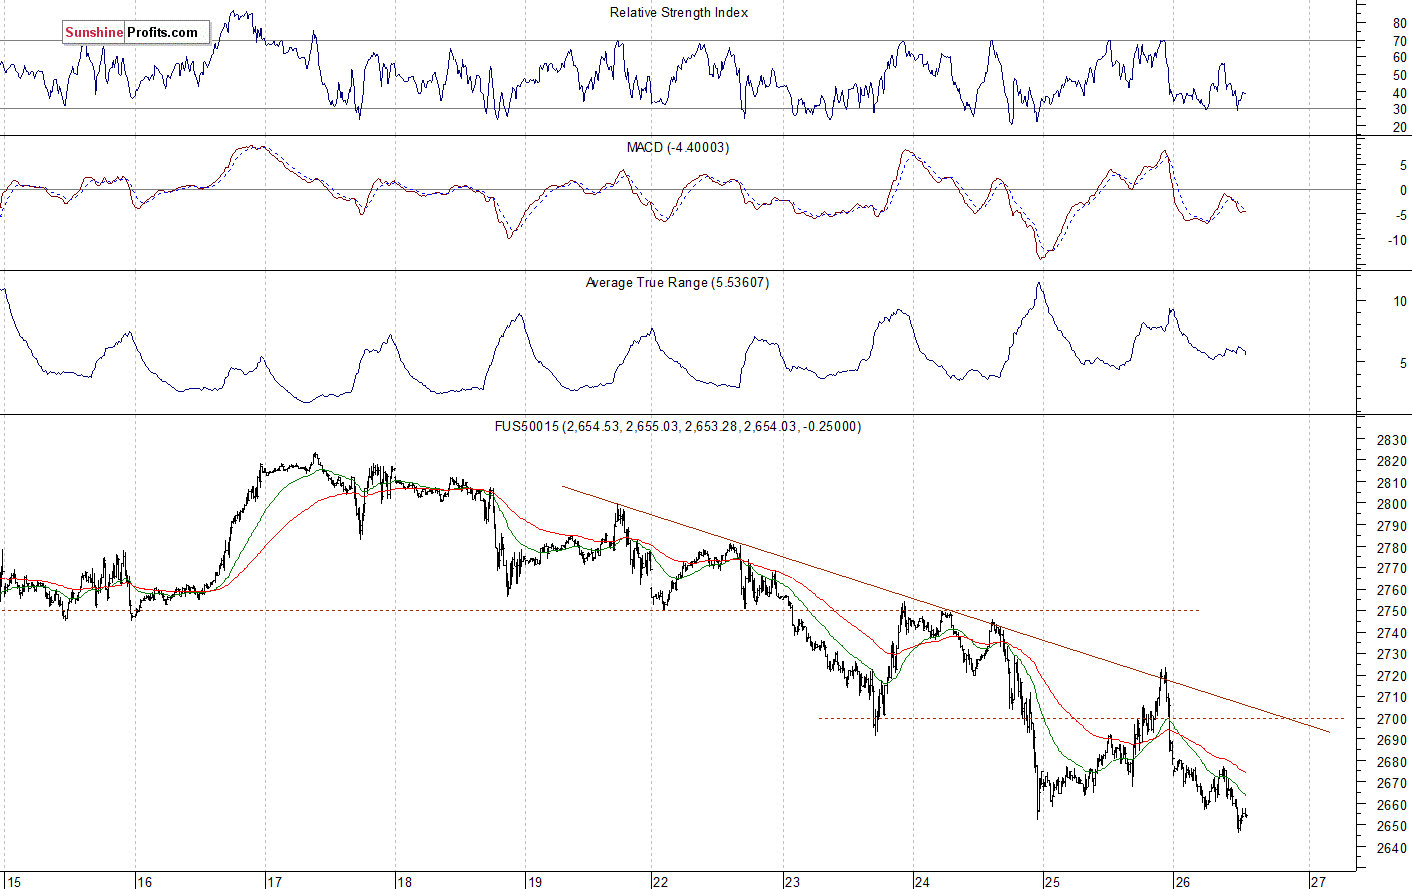
The S&P 500 futures contract trades within an intraday downtrend, as it extends its yesterday's after-hours decline. It reached the new medium-term low below the level of 2,650. The nearest important level of support is at around 2,645-2,650. On the other hand, the resistance level is at 2,670-2,675, among others. The futures contract continues to trade below its short-term downward trend line, as we can see on the 15-minute chart:
Nasdaq Leading Lower
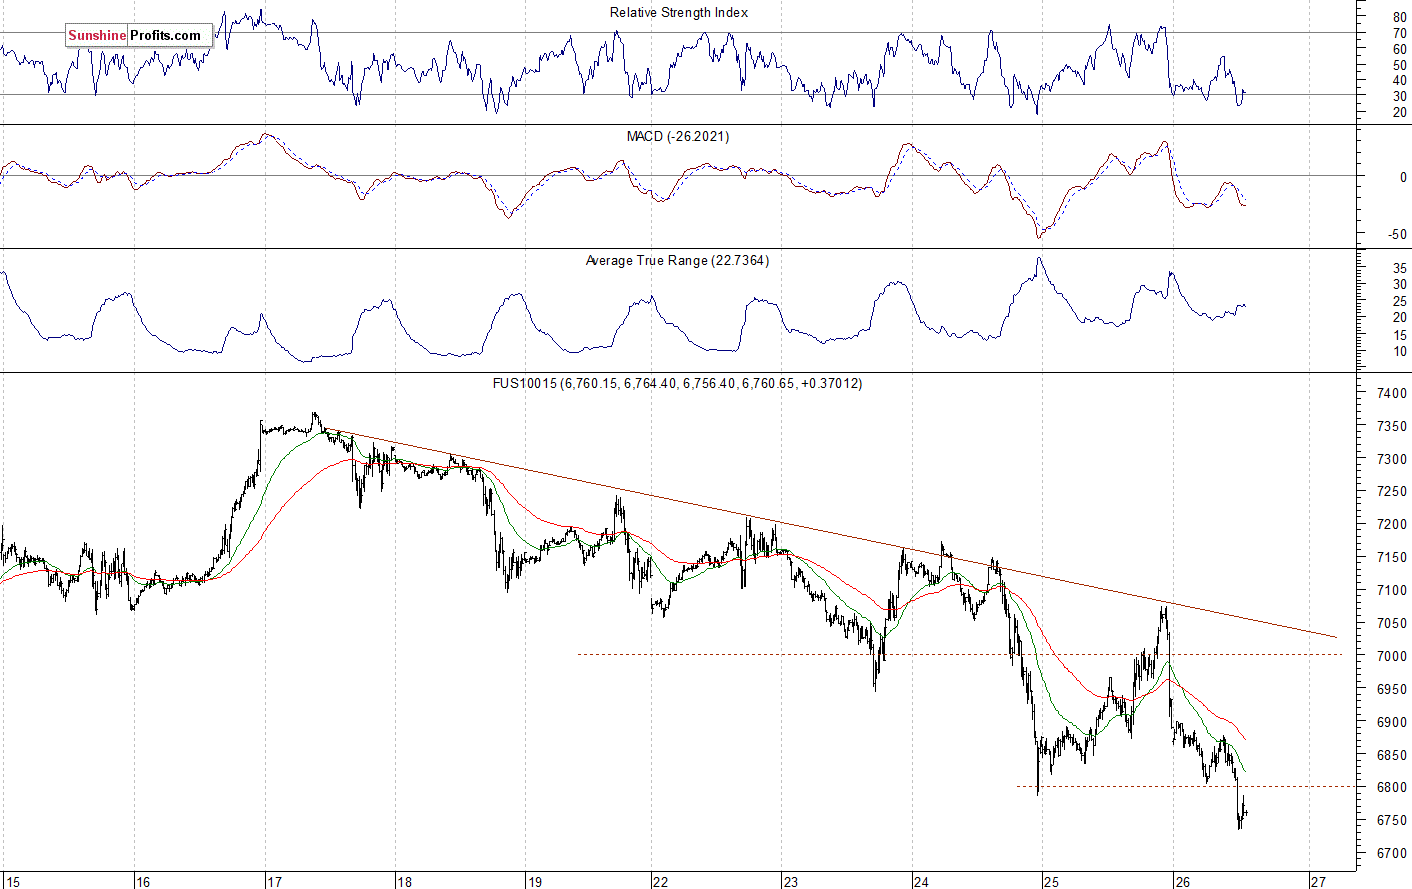
The technology Nasdaq 100 futures contract is also extending its yesterday's after-hours' rout. The market reached a new low at around 6,735. So it fell almost 1,000 points off its October the 1st record high above the level of 7,700. We could see more short-term volatility. The nearest important level of resistance is now at around 6,800-6,850. On the other hand, a potential support level is at around 6,700. The Nasdaq futures contract extended the downtrend this morning, as the 15-minute chart shows:
Apple Remains Strong, Amazon Crashes After Earnings
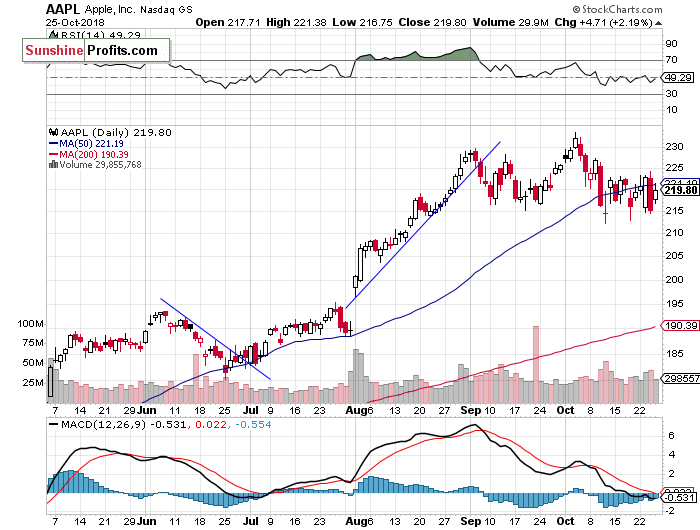
Let's take a look at Apple, Inc. stock (AAPL) daily chart (chart courtesy of http://stockcharts.com). It reached the new record high at the level of $233.47 in the early October, as it continued to act relatively strong. Then the stock retraced its rally. The support level remains at around $215. On Tuesday the stock bounced off that support level, but it came back lower on Wednesday. Yesterday it bounced back higher again. Overall, the stock continues to trade within a two-month-long consolidation:
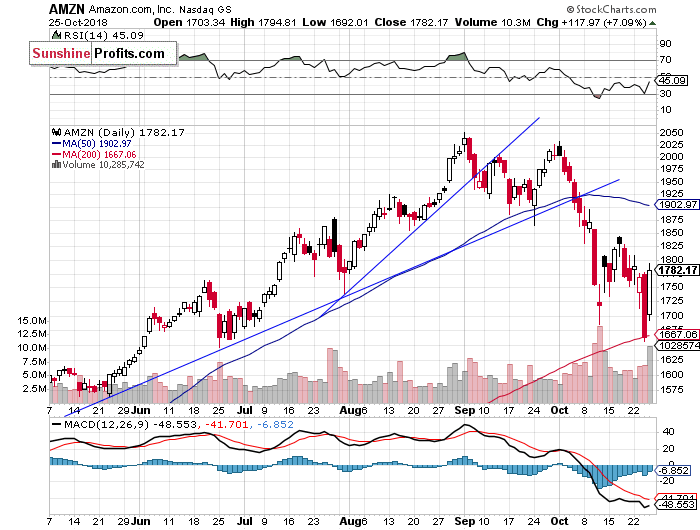
Now let's take a look at Amazon.com, Inc. stock (AMZN) daily chart. It is expected to open much lower today following yesterday's quarterly earnings release. So yesterday's rebound was just a quick correction within a downtrend. The stock may reach the level of $1,600 at the opening of today's trading session. There have been no confirmed positive signals so far. However, we can see technical oversold conditions:
Will Dow Jones Continue Lower?
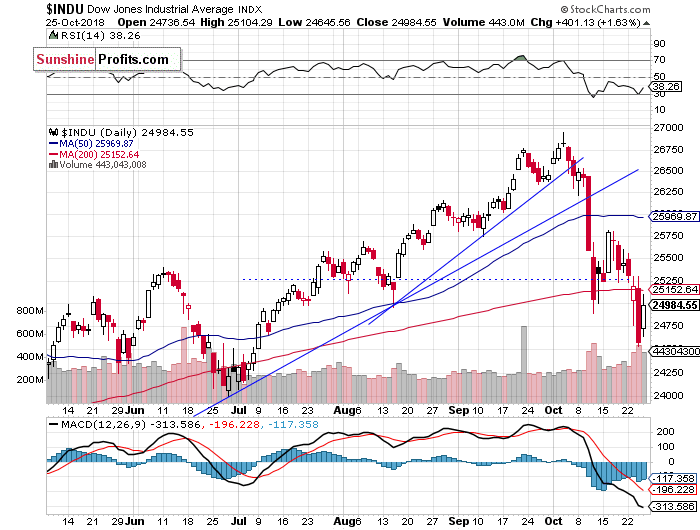
The Dow Jones Industrial Average reached its new all-time high at the level of 26,951.81 on October the 3rd. Then the blue-chip stocks' gauge broke below its medium-term upward trend lines and the support level of around 26,000. It quickly continued towards the 25,000 mark. There we saw a consolidation, but the index broke lower. The nearest important level of support is at around 24,000-24,250, marked by the medium-term local low:
The S&P 500 index retraced some of its Wednesday's sell-off yesterday, as it got back above 2,700 mark. However, it is expected to open much lower today. So we may see more volatile fluctuations following the recent decline. There have been no confirmed positive signals so far.
Concluding, the S&P 500 index will probably open much lower today. Yesterday's advance looked like a dead-cat-bounce upward correction. And it was. We could see more volatile fluctuations. Stocks may bounce again at some point.
Trading position (short-term; our opinion): no positions are justified from the risk/reward perspective.
Thank you.
Paul Rejczak
Stock Trading Strategist
Stock Trading Alerts

