

Greetings. I hope you enjoyed the weekend and have come into the new week rejuvenated and relaxed.
As I search through instruments, looking for potential opportunities, one thing stands out: most US equity ETFs and indices seem overbought. That’s okay, though. A bull market like this is bound to reach overbought conditions. In my opinion, it’s important to wait for a pullback before going long. Buying the dips is a good idea in bull markets. It’s so simple, right? Yet, do we always do that?
As a result of many instruments bearing a similar-looking price chart and an overbought common technical theme, I’ve begun to look for some things that have fallen out of favor recently in an attempt to find value. We all know that the sector rotation from growth to value was the theme earlier in 2021. There were outflows from tech, and capital found its way to Dow 30 stocks and the like, as investors hunted for value with dividend yield.
During my scanning and filtering in an attempt to find some potential opportunities that have pulled back or consolidated, I ran into an interesting product, the Invesco MSCI Sustainable Future ETF (ERTH). ERTH holds worldwide companies that make efficient use of natural resources in a limited way: pollution prevention, alternative energy, green building, and sustainable agriculture are parts of the holdings. This ETF was catapulting higher approaching the US presidential election, reaching a high of $83.72 in January 2021. Let’s begin by taking a look at the daily chart.
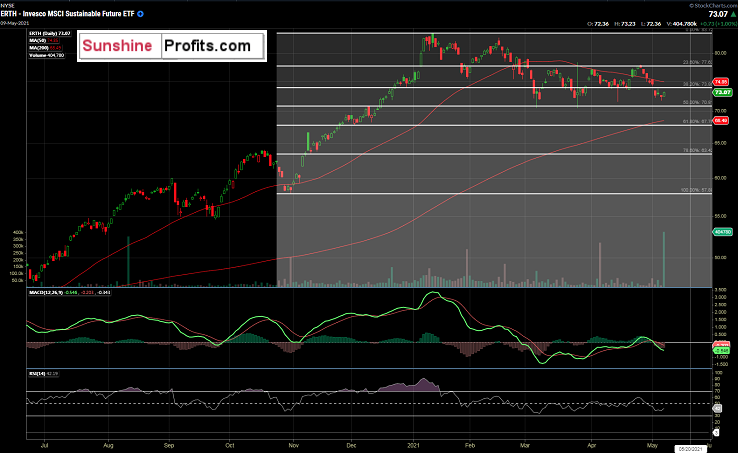
Figure 1 -Invesco MSCI Sustainable Future ETF (ERTH) Daily Candles June 23, 2020 - May 7, 2021. Source stockcharts.com
Here we can see the price uptrend in 2020 with the high of $83.72 reached on January 12, 2021. Since then, we have seen the price trend lower to sideways, which appears to be a healthy bull market consolidation pattern. I like to see consolidations such as this in a market trending upward. Looking at it further, it is currently trading below its 50-day moving average of $74.85 and the last trade price on May 7, 2021, of $73.97. What sticks out to me here is the huge volume that traded on May 7, 2021, with 404,780 shares traded. This activity is the highest daily volume for ERTH throughout this chart. It seems that somebody or some entity wanted or needed to get long ERTH on Friday.
Next, we can see that the product has indeed been making higher lows since March 5, 2021. Notice how the first two of these higher lows closely coincided with the 50% Fibonacci retracement of $70.81. The daily MACD has crossed the zero line recently, which portended lower prices to come. The Daily RSI reading is around 42 and could cross the 50 line if prices increase in the short term, which would be a bullish signal.
However, whenever possible, I like to prepare for an entry on a pullback. I realize that, right now, it feels like the broader markets will never pull back. This is all the more reason that there could be some kind of pullback in the cards in the broader indices at some point in the near future. So, in preparation for a broader market pullback, I look for the next level where there could be buyers of ERTH. A broad market pullback could send most instruments lower, and if that happens, it is always great to have a premeditated plan for entries. Keeping this in mind and seeing that ERTH is trading below its 50-day moving average, I begin to think about the 200-day moving average.
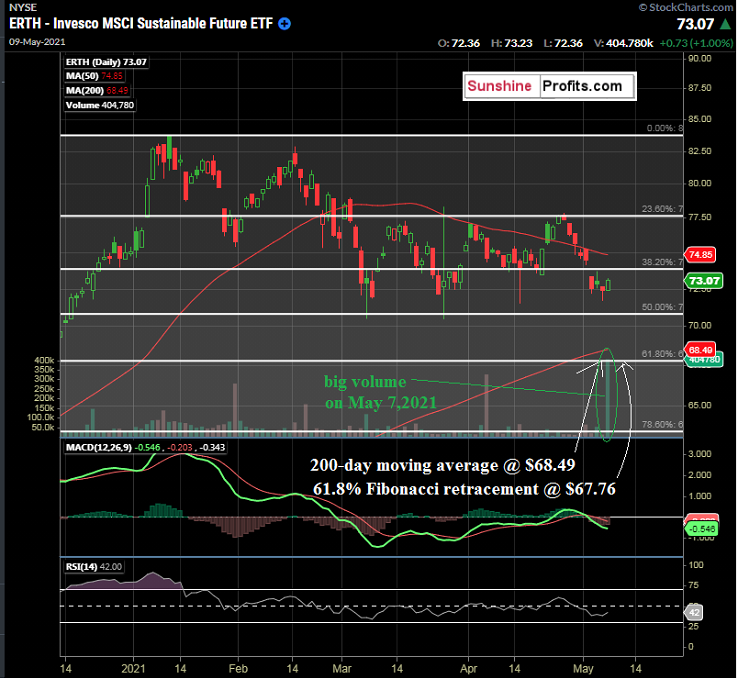
Figure 2 -Invesco MSCI Sustainable Future ETF (ERTH) Daily Candles December 14, 2020 - May 7, 2021. Source stockcharts.com
Here we can see the 200-day moving average at $68.49 and the 61.8% Fibonacci retracement level taken from the October 30, 2020, low and the January 12, 2021 high. This indicator confluence is visual music to my ears.
The question now becomes, will it pull back to these levels, or will the higher lows pattern hold as support? That is the million-dollar question in ERTH. I see the broader indices pulling back at some point, soon potentially affecting ERTH, which leads me to play the waiting game. I prefer to be waiting with dry powder on hand versus being in a losing trade waiting for the market to go back my way.
To become more confident in my viewpoint, I dig into the hourly chart, which shows the recent downtrend more clearly.
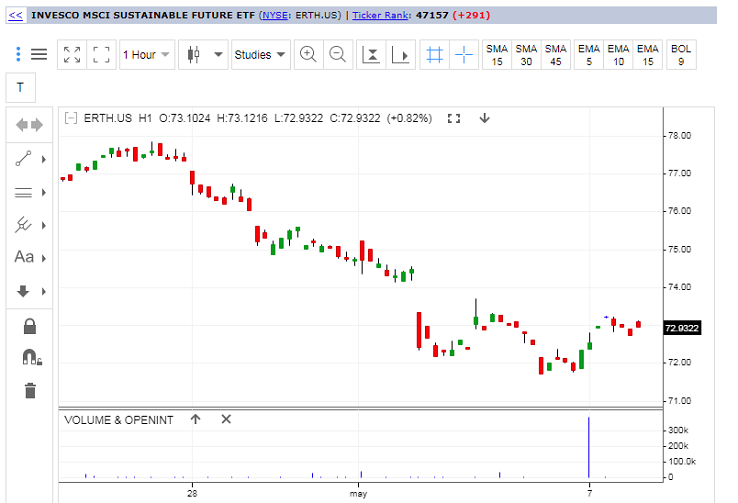
Figure 3 -Invesco MSCI Sustainable Future ETF (ERTH) Daily Candles April 23, 2021 - May 7, 2021. Source stooq.com
Analyzing this, other than the large share volume on May 7, 2021, I see no clear signal of a major short-term bottom. So, for me, combining all of the data discussed above, I would prefer to see a pullback.
For an entry into ERTH on the long side, I would be looking for a pullback between the range of the 200-day moving average and the 61.8% retracement level. This equates to a range between $67.76 and $68.49. If it does not pull back, it could run away to the upside before an entry. More aggressive traders could consider putting on a quarter to a half of the total position size at current levels near $73, but I prefer to be waiting and ready on a pullback.
To sum up the current viewpoint and opinion:
I have a BUY call for:
- Invesco MSCI Sustainable Future ETF (ERTH) between $67.76 - $68.49. Waiting for a pullback is wise. Always use a stop loss level that caters to your individual risk tolerance.
- First Trust NASDAQ Clean Edge Smart Grid Infrastructure Index Fund (GRID) between $86.91 and $88.17. This could be a long-term holding for those that want to have exposure to the US Infrastructure story as it develops. Short-term traders can look at the 52-week high of $90.96 and high $90.00s to the psychological $100.00 level as take profit level ideas. Always use a stop loss level that caters to your individual risk tolerance.
- S&P 500 (SPX): but ONLY on a pullback to; or below the 50-day moving average (currently 4014) making the suggested range for entry 3990 - 4014. A close below the 50-day moving average on a given day is a suggested stop loss level. Adjust stop level for your individual risk tolerance.
Wishing You A Great Upcoming Week, and Good Trades to You All!
Thank you.
Rafael Zorabedian
Trading Strategist

