

Are you getting frustrated waiting for a meaningful pullback in US equity ETFs? There have been pullbacks in some sectors if you know where to look.
If you like to buy on pullbacks in bull markets (like me), you may have trouble swallowing some of the price levels and medium-term overbought technicals on many instruments right now.
Digging deeper into the trenches, some areas have had meaningful pullbacks, and we are going to get into one ETF right now that is currently trading at/near key technical levels.
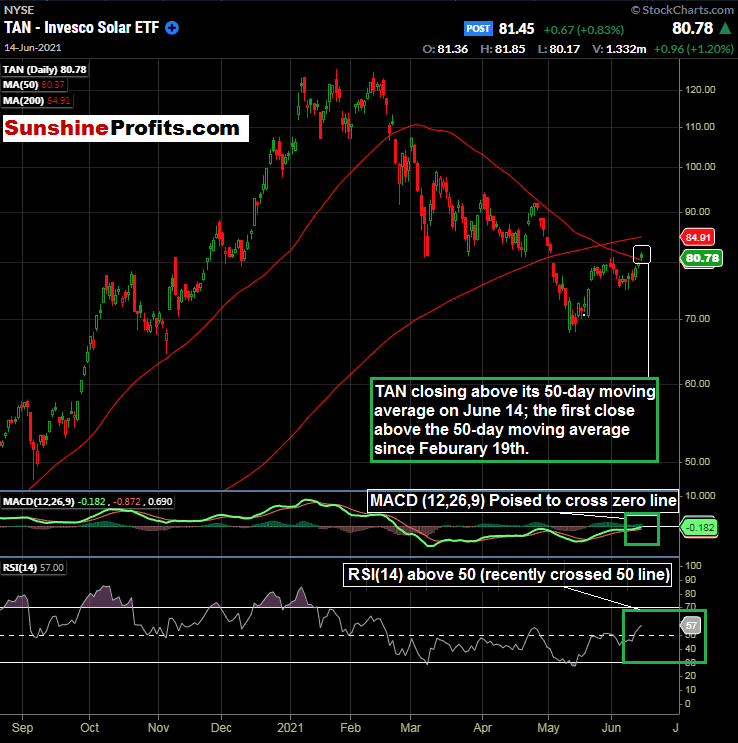
Figure 1 - Invesco Solar ETF (TAN) August 21, 2020 - June 14, 2021, Daily Candles Source stockcharts.com
I like to find bullish short to medium-term technicals, and the Invesco Solar ETF (TAN) just closed over its 50-day moving average yesterday. This technical action comes after a period of retracement and consolidation that dates back to the beginning of 2021. Its 52-week high close is $121.94, put in back on February 9, 2021.
The TAN ETF strategy and top holdings can be viewed here.
So, while everyone is still talking about inflation and the upcoming Fed decision, we can focus our attention on an ETF that has pulled back nicely over a four + month time period and is exhibiting some signs of bullish technical strength. Also, take note of the RSI above 50 (57) and the MACD poised to cross the zero line.
We can see that June 14th's candle was a gap higher and a close above the 50-day moving average. More clarity can be obtained by viewing an intraday 15-minute chart:
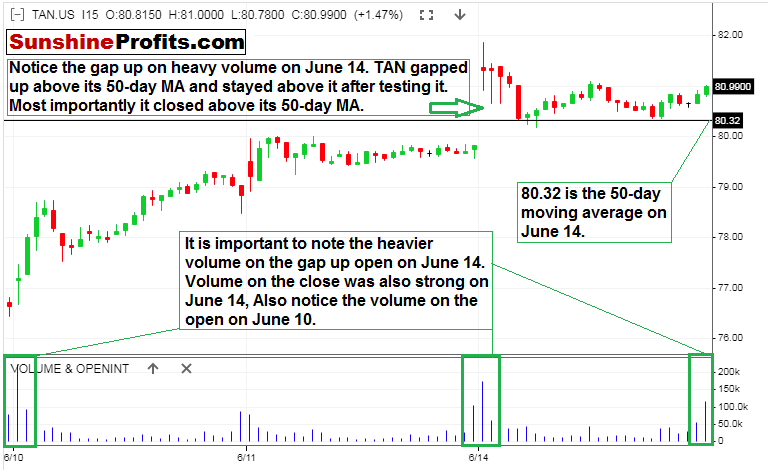
Figure 2 - Invesco Solar ETF (TAN) June 10, 2021 - June 14, 2021, 15 Minute Candles Source stooq.com
The gap-up volume and TAN’s ability to stay above and close above its 50-day moving average could be a bullish signal.
US Administration and Solar Outlook
Just like some of the other markets that I am currently following, TAN seems to make sense given the current US administration and democratic congressional majority. In fact, just as I am writing this, Reuters published an article about first-quarter US solar installations soaring. I do wish that this article would come out later instead, but it is out now.
Although there are some supply chain concerns in solar right now (think commodities), there ought to be many initiatives and subsidies put forth by the Biden administration in the coming years. Regardless of your personal opinion on solar vs. fossil fuels, the idea is to try to profit from economic conditions. TAN could be a great addition to holdings to get exposure from a sector that has already experienced a meaningful pullback; brought on partially by the buy the rumor, sell the fact type of trading action that we saw in TAN from November 2020 (US presidential election) and January 2021 (inauguration).
Based on the technicals that we have covered above and the pullback/consolidation that we have seen in the medium-term in TAN, this seems like a potentially solid entry point area.
For additional details on the US Solar Market, the SEIA (Solar Energy Industries Association) just released their Q2 2021 report. You can view it here. It contains numerous datasets, charts, and other data, including projected residential and commercial installation projections.
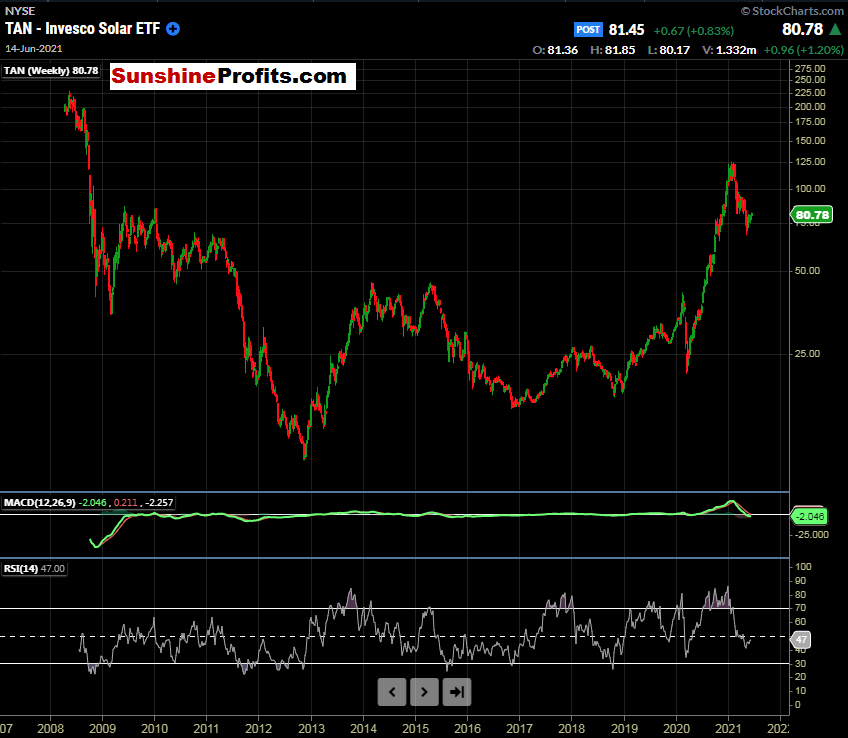
Figure 3 - Invesco Solar ETF (TAN) April 14, 2008 - June 14, 2021, Weekly Candles Source stockcharts.com
Let’s also take note that TAN has traded at these levels before. It traded north of $220 back in the Summer of 2008. Hint, hint: there was $4 per gallon retail gasoline in the US at that time. I think it is wise to know the long-term trading history of instruments that are covered.
What could TAN do if additional solar subsidies are issued by the Biden administration and residential + commercial installations increase? Time will tell.
To sum up the current viewpoint and opinion:
I have BUY opinions for:
- iShares Trust Russell 2000 ETF (IWM) for an index reconstitution trade. At this time, I would be looking to be long and then exiting upon the actual reconstituted index going into place on June 28, 2021. Buy the rumor, sell the fact type of trade. Buy Pullbacks. For equity-bearish folks, see the IWM/SPY spread idea in the May 27th publication. Always use a stop loss level that caters to your individual risk tolerance.
- Update: 06/15: The IWM shed 0.29% in Monday’s session to close at $231.02. It is still well above the $223.36 level when initiating coverage. Opinion: stay long. I think there is still time to get on board here, with the plan being to sell on June 28, 2021. See the May 27th publication.
- Defiance Quantum ETF (QTUM) between $44.00 - $49.50. Update 06/15: QTUM closed at $49.66 on Monday. In case you missed this one, I think there is still time to get on board and will raise the buy idea zone to $44.00 - $49.50. It looks like it wants to break out of its range soon, but could find some sellers at the psychologically important $50 level. Always use a stop loss level that caters to your individual risk tolerance.
- Amplify Transformational Data Sharing ETF (BLOK) between the 200-day moving average and $40.00 200-Day Moving Average is currently $39.49. BLOK has a history of high volatility, so proceed with caution. Always use a stop loss level that caters to your individual risk tolerance. Update 06/15: Patience still. I want to jump on board, but prefer to see how Bitcoin negotiates the $40,000 level. Wait for $40.00 to the 200-Day moving average. Monitoring.
- Invesco MSCI Sustainable Future ETF (ERTH) between $67.76 - $70.82. Always use a stop loss level that caters to your individual risk tolerance. Update 06/15: ERTH closed at $76.73 on Monday. Hold longs. Chugging along. If you missed this one, let’s see if we can get a pullback to the 50-day moving average, which currently sits at $74.00. I am liking this one more and more for a long-term holding and will be willing to hold through short-term pullbacks at this time.
- Invesco Exchange-Traded Fund Trust - S&P SmallCap 600 Pure Value ETF (RZV) at the 50-day moving average. Patience and wait for the pullback. Always use a stop loss level that caters to your individual risk tolerance. Update 06/15: RZV 50-day MA is 92.34 as of the close Monday. Monitoring.
- iShares Global Timber & Forestry ETF (WOOD) Initial buy idea zone between $79.07 and the 200-day moving average ($79.61 as of 06/14 close). Update 06/15: Patience and wait for the pullback. Monitoring. Always use a stop loss level that caters to your individual risk tolerance. I will be revisiting this name and lumber soon for developments.
- SPDR S&P 500 ETF (SPY) between $412.26 (61.8% Fibonacci retracement level above) and the 50-day moving average ($416.21 as of the close on June 14th). Always use a stop loss level that caters to your individual risk tolerance.
- Invesco Solar ETF (TAN) between the 50-day moving average ($80.32 as of June 14th) and $81.50. Look for an intraday pullback for entry. Always use a stop loss level that caters to your individual risk tolerance.
I have SELL opinions for:
NONE
I have a HOLD opinion for:
- First Trust NASDAQ Clean Edge Smart Grid Infrastructure Index Fund (GRID). GRID has traded through our idea range of between $86.91 and $88.17. Update 06/15: GRID closed at $91.78 yesterday. Opinion: hold longs.
- Always use a stop loss level that caters to your individual risk tolerance.
Thank you for reading today’s Stock Trading Alerts. Your readership is valued and appreciated. Have a great day!
Thank you,
Rafael Zorabedian
Stock Trading Strategist

