

Trading position (short-term; our opinion): short positions with stop-loss at 3050 and the initial downside target at 2200 are justified from the risk/reward perspective. It's a big-picture trade if you will, which means that the trade parameters are relatively distant price points. Remember that you can adjust your own position sizing so that the risk per trade meets your very personal preferences. We'll manage the open position flexibly and in line with the incoming signals supporting/refuting the projections, but the above price points are the big picture layout.
S&P 500 has overcome Thursday's intraday highs, breaking above the 50% Fibonacci retracement of the slide from the mid-Feb highs to the mid-March lows. The setup appears too bullish to ignore. Is it time to jump in on the long side, or is the air getting too think at these altitudes?
Let's get right into yesterday's price action in S&P 500 (charts courtesy of http://stockcharts.com ).
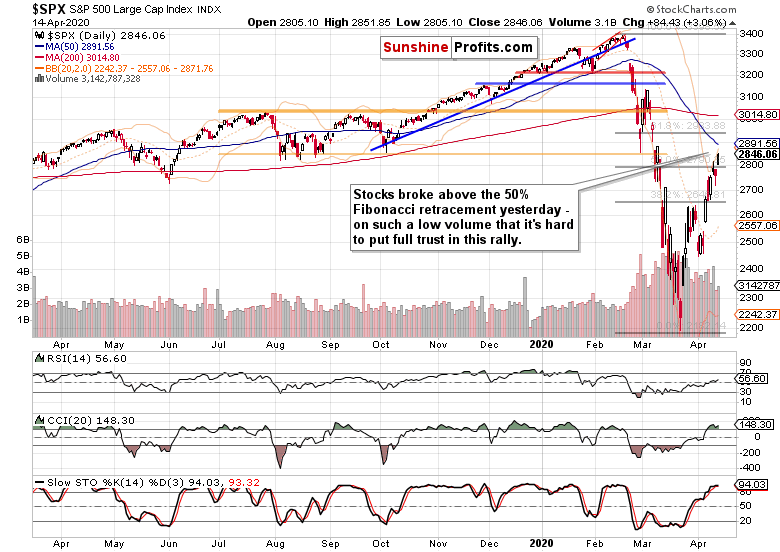
Yes, stocks broke above the 50% Fibonacci retracement and closed darn near their intraday highs. But note the low daily volume. One can be easily forgiven when looking for a much higher one on such a key resistance breakout - expecting a higher reading is justified. Moves that happen on comparatively low volume, are best viewed with a healthy dose of suspicion. Lacking bullish follow-through, Tuesday's upswing belongs among them.
Let's bring up our yesterday's observation:
(...) It's certainly true that quite a few tradable, sizable market moves start with a fake run in the opposite direction that ultimately burns itself out and reverses course. And this is what we're likely witnessing these days in stocks as well.
(...) Regardless of the backing-and-filling that may come over the nearest days, another leg lower will come as surely as an increase in selling pressure.
We may be indeed witnessing the opening phase of another leg lower, as the S&P 500 futures are struggling to defend the 2800 mark in today's premarket trading. Is that a verification of the breakout above the 50% Fibonacci retracement, or rather an invalidation thereof?
In search for the answer, let's check yesterday's debt market performance - first, the high yield corporate bond as it's what's supposed to be quite far on the risk curve (yeah, pre-Fed intervention in the corporate market), and then its ratio to the safest debt instruments backed by the full faith and credit of the US - the short-dated Treasuries. Finally, we'll see whether stretching out the time horizon makes any difference, and draw conclusions.
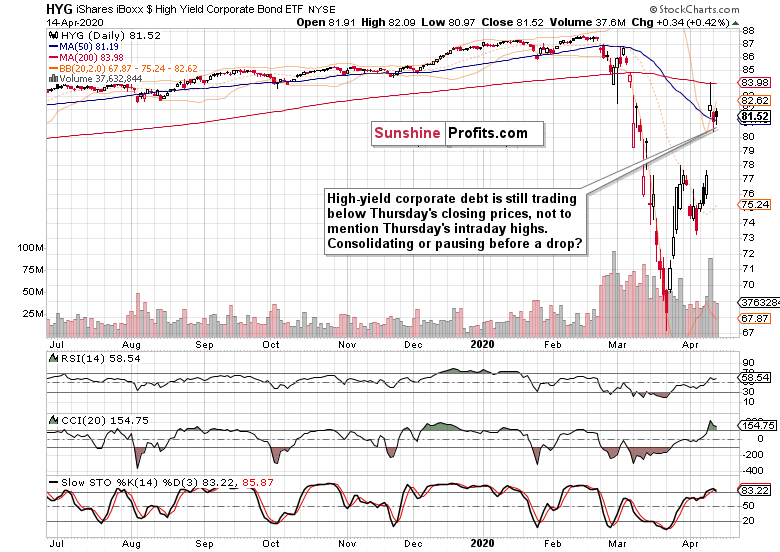
High-yield corporate debt didn't add to its Thursday's gains yesterday either. The longer any continuation of the move higher takes, the more doubt the sizable Thursday's gap invites. Especially when examined from the high daily volume perspective and long upper knot of Thursday's session - that's a bearish combination. Regardless of the Fed's moves, corporate bonds will indicate shortly whether they're consolidating or hanging in the balance prior to moving lower.
What message is the ratio of these bonds against the short-term Treasuries sending? Should the bullish sentiment return and the financial stress calm then, then this ratio should be going up. Is it?
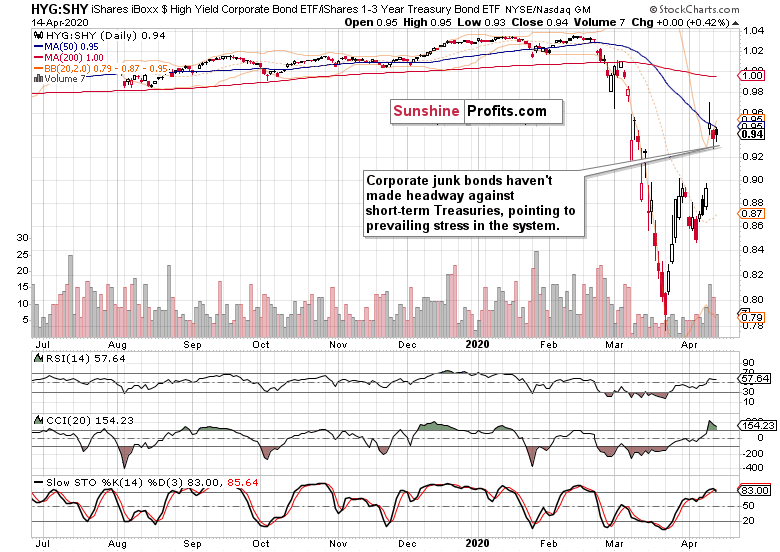
Not really. After opening higher, it had been slightly declining yesterday. In short, no progress has been made. Now, does the picture change if we extend the Treasuries' time horizon? After all, that's where the signs of upcoming inflation (given all the money thrown at the coronavirus fallout management) should manifest themselves. So, is the ratio holding up similarly well compared to shorter-dated Treasuries or not? If it is, then it points to continuing risk aversion. If it isn't and longer-dated Treasuries aren't breaking down in a big way, then their little-moved yields indicate readiness to park money in Treasuries while waiting for better times to come (i.e. it's about return of the money as opposed to return on the money).
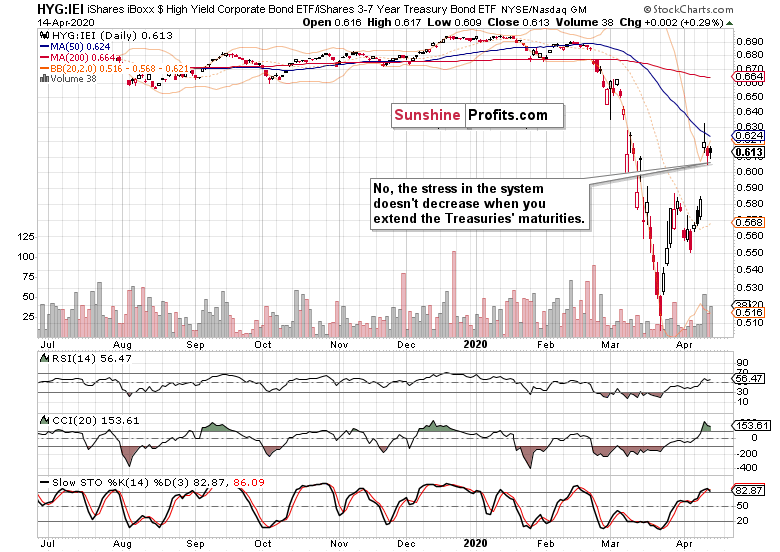
Changing the time horizon didn't reveal a new perspective. In such an environment, it's understandable that stocks underperform instead of racing to new highs.
Before summarizing, let's quote our yesterday's parting notes:
(...) While the Fed projects the power to stave off depression, they cannot buy us a true recovery. And that's why we expect another leg lower in the coming days and weeks. Base-building is a process and while today's bullish gap coupled with the sharp advance over 2800 shortly after today's market open may appear encouraging, it works to lure the bulls into the market at a time when the risk-reward ratio isn't really on their side.
As stock futures trade around 2780 currently, today's session is shaping up to be a shot across the bow for the stock bulls. Do they stand a chance at getting their act together?
Summing up, the stock bulls took the initiative again yesterday, but this time, the credit markets underperformed on a daily basis. That makes yesterday's breakout above the 50% Fibonacci retracement look wobbly - the risk of breakout invalidation and renewed selling remains high. And indeed, today's premarket action regardless of the upbeat coronavirus message coming from the hard-hit NYC, is confirming our yesterday's words about the risk-reward ratio not being on the bulls' side exactly. As the market needs to somehow digest recent gains. sideways trading followed by renewed selling pressure taking on the March lows, is an optimistic scenario. The medium-term outlook remains bearish, and the short position justified as stocks won't likely shrug off weak incoming April and May data on retail sales, consumer confidence, employment, manufacturing or the GDP - let alone the Q1 earnings hit and lowered Q2 guidance as the lockdowns have started to really bite. Bulls beware, weekly unemployment claims are approaching!
Trading position (short-term; our opinion): short positions with stop-loss at 3050 and the initial downside target at 2200 are justified from the risk/reward perspective. It's a big-picture trade if you will, which means that the trade parameters are relatively distant price points. Remember that you can adjust your own position sizing so that the risk per trade meets your very personal preferences. We'll manage the open position flexibly and in line with the incoming signals supporting/refuting the projections, but the above price points are the big picture layout.
Thank you.
Monica Kingsley
Stock Trading Strategist
Sunshine Profits - Effective Investments through Diligence and Care

