

Briefly:
Intraday trade: Our Thursday's intraday trading outlook was neutral. It proved accurate, because the S&P 500 closed just 0.1% lower following lower opening of the trading session (-0.2%). The market retraced some of its month-long rally, but we still can see some medium-term overbought conditions along with bullish investors' sentiment. The downtrend is likely to extend today, but there is also a growing possibility of a short-term bounce. Therefore, we prefer to be out of the market today, avoiding low risk/reward ratio trades.
Medium-term trade: In our opinion, no medium-term positions are justified.
Our intraday outlook is neutral again. Our short-term outlook is neutral, and our medium-term outlook is neutral:
Intraday outlook (next 24 hours): neutral
Short-term outlook (next 1-2 weeks): neutral
Medium-term outlook (next 1-3 months): neutral
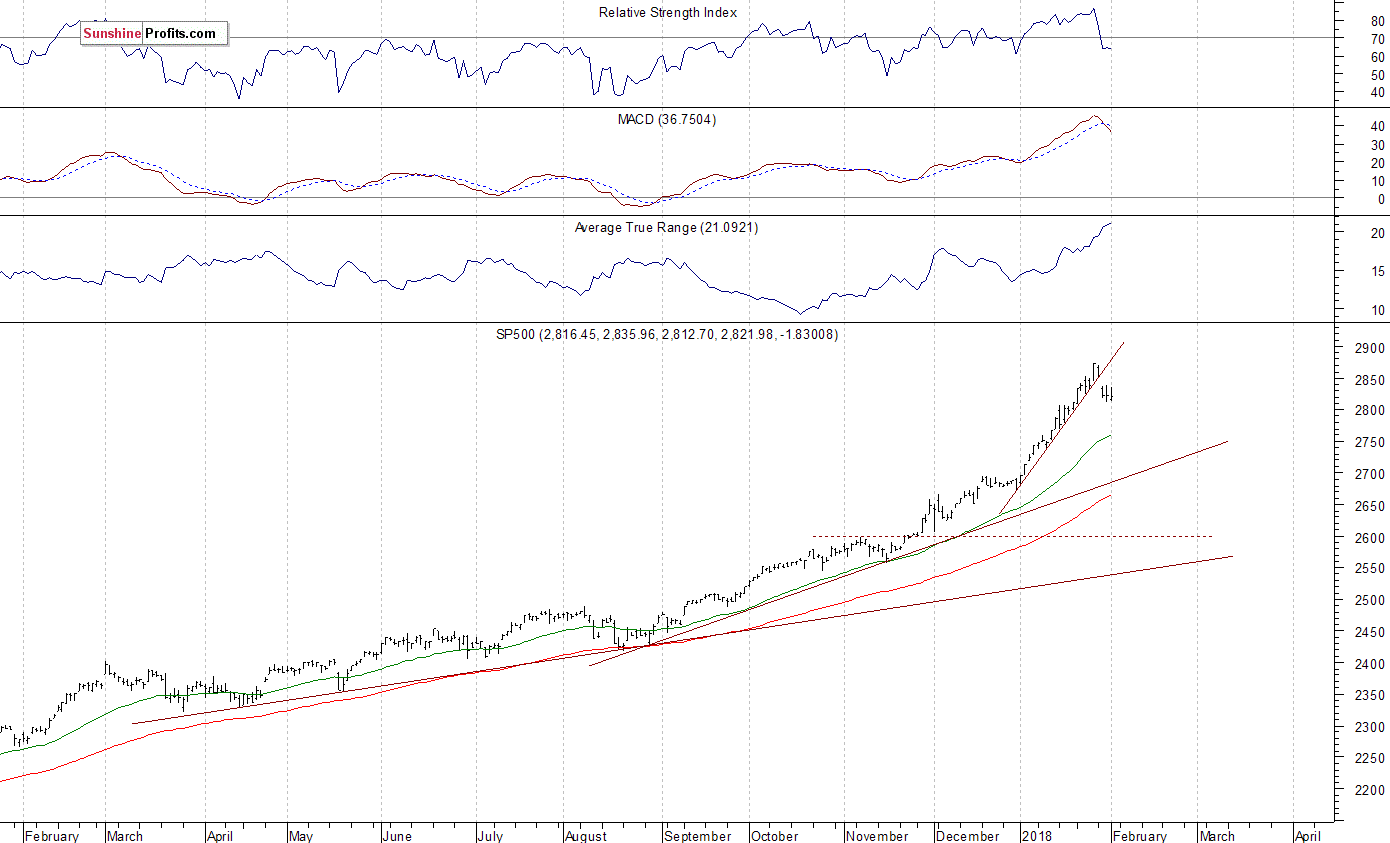
The U.S. stock market indexes were mixed between -0.4% and +0.2% on Thursday, extending their short-term consolidation, as investors continued to hesitate following relatively strong move down in the early week. The market remains within a downward correction of its almost month-long rally. The S&P 500 index remains below its Tuesday's daily gap down. It currently trades around 2.2% below its January 26 record high of 2,872.87. Yet, it remains 4.6% above its December 29 close of 2,673.61. The Dow Jones Industrial Average gained 0.2% yesterday, as it was relatively stronger than the broad stock market again. On the other hand, the technology Nasdaq Composite lost 0.4% ahead of some major quarterly corporate earnings releases.
The nearest important level of support of the S&P 500 index is still at 2,790-2,800, marked by the January mid-month consolidation. The next level of support remains at 2,770-2,780, marked by some previous local lows. On the other hand, the nearest important level of resistance is at 2,840-2,850, marked by Tuesday's daily gap down of 2,837.75-2,851.48. The next resistance level remains at around 2,870-2,875, marked by Friday's record high of 2,872.87. The resistance level is the price level at which the selling interest is strong enough to overcome buying pressure and push the price lower. It usually refers to previous high or highs, gap downs, trend lines, retracement levels etc.
We still can see medium-term technical overbought conditions on the daily chart of the S&P 500 index. There is a pretty big chance that the index reached some major medium-term high on Friday. It broke below its month-long upward trend line on Tuesday following gap-down opening of the trading session, confirming reversal of the uptrend. The market is likely to continue lower, but its short-term downside potential seems limited by a support level of 2,790-2,800:
Negative Expectations Ahead Of Jobs Data
The main index futures contracts trade 0.7-0.9% lower vs. their Thursday's closing prices this morning. So, expectations before the opening of today's trading session are very negative. The European stock market indexes have lost 0.3-1.2% so far. Investors will wait for some important economic data announcements: Nonfarm Payrolls, Unemployment Rate at 8:30 a.m., Michigan Sentiment number, Factory Orders at 10:00 a.m. The market expects that Nonfarm Payrolls were at +181,000, and Unemployment Rate was at 4.1% in January. Investors will also wait for more quarterly corporate earnings releases.
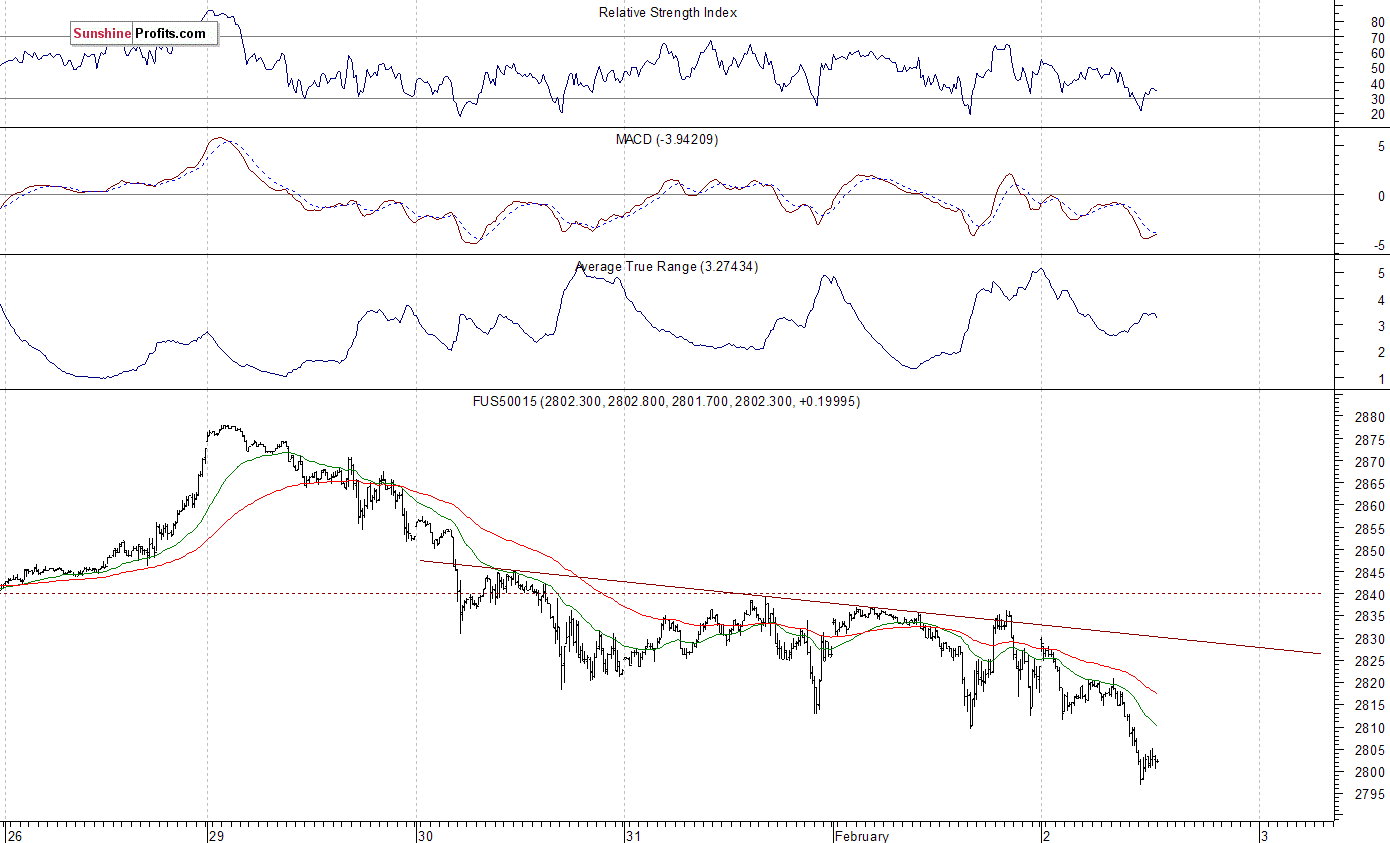
The S&P 500 futures contract trades within an intraday downtrend, as it breaks below its three-day-long trading range. The market is at potential support level of around 2,800. The next level of support is at 2,760-2,780, marked by some mid-January fluctuations. The nearest important level of resistance is now at 2,810-2,820, marked by recent support level. The next resistance level remains at 2,840-2,845, marked by short-term local highs. The futures contract extends its downtrend this morning, as we can see on the 15-minute chart:
Nasdaq Breaks Lower
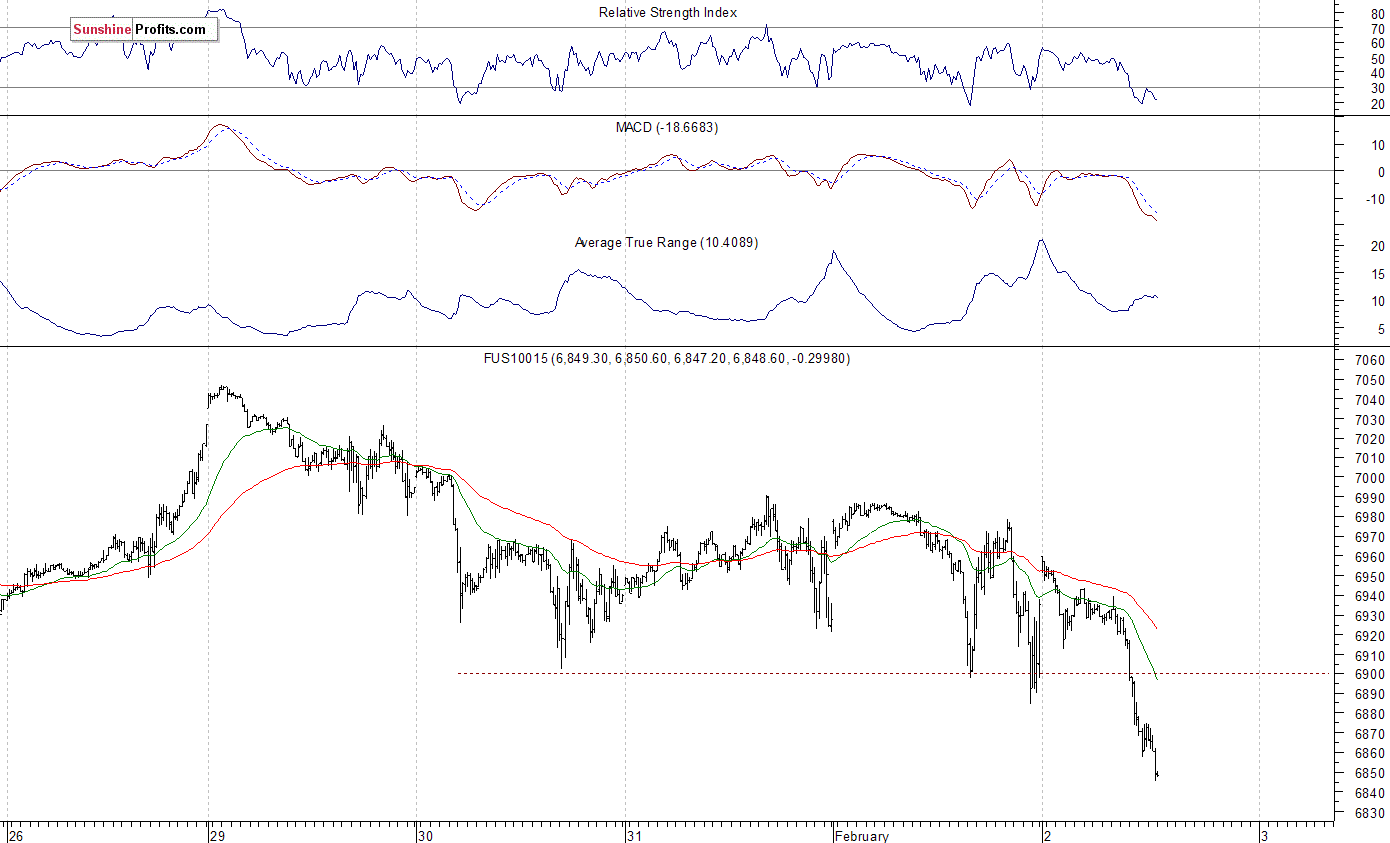
The technology Nasdaq 100 futures contract follows a similar path, as it breaks below its recent consolidation and reaches new lows within a short-term downtrend. It also breaks below its last week's lows - technology stocks were relatively stronger than the broad stock market up till now. The market retraced almost 200 points off its Monday's overnight record high so far. It seems that quarterly earnings release won't drive the market to record highs, because yesterday's reactions to Apple, Alphabet (Google), Amazon after-hours releases were very mixed.
The nearest important level of support of the Nasdaq 100 futures contract is at around 6,840-6,850, marked by some previous local highs. The next support level is at 6,700-6,730, among others. On the other hand, resistance level is now at 6,900, marked by recent level of support. The next resistance level is at 6,980-7,000. The Nasdaq futures contract trades below 6,900 mark, as the 15-minute chart shows:
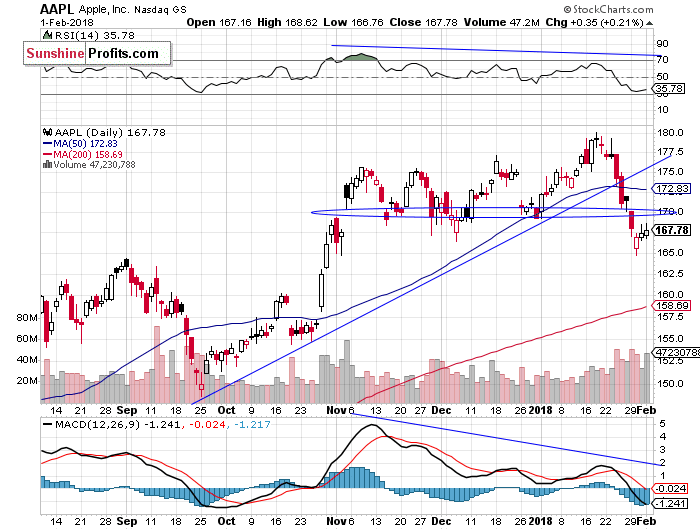
Let's take a look at Apple, Inc. stock (AAPL) daily chart (chart courtesy of http://stockcharts.com) - worth mentioning because Apple's market capitalization is around $850 billion, which is two times more than the current value of all the cryptocurrencies combined. It was relatively weak vs. the broad stock market recently, as it extended its short-term downtrend. The stock reached new record high two weeks ago, following short-term consolidation along the support level of $175. The market got closer to $180 mark, but it failed to continue higher. Consequently, the stock retraced its whole January advance. It broke below its November-December lows on Tuesday. The stock trades within a potential support level of $165-170. Yesterday's after-hours reaction to quarterly earnings release was neutral, so the price may extend its short-term fluctuations:
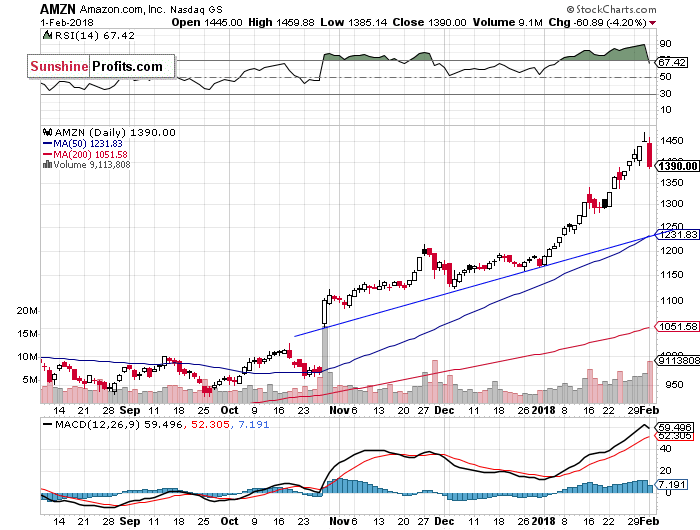
On the other hand, Amazon.com, Inc. stock (AMZN) was relatively strong vs. the broad stock market. Despite an overall weakness, it further extended its month-long rally recently. The stock retraced some of its move up yesterday, as it fell below $1,400 mark before quarterly earnings report announcement. However, it has managed to get back to its record high following after-hours release. It has gained more than 5%. So, we didn't see "buy rumors, sell news" action. This may lead to some volatility along the record high. The market may be trading within some medium-term topping pattern here:
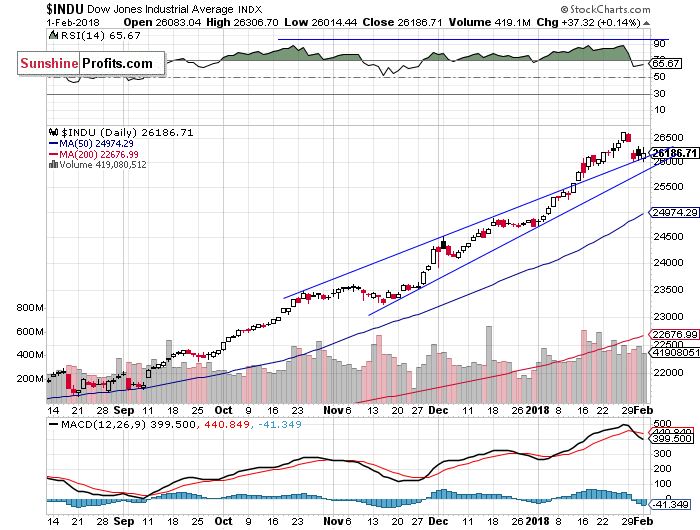
The Dow Jones Industrial Average daily chart shows that blue-chip index retraced weeks-long record-breaking move up on Tuesday. For now, it looks like a downward correction, but we still can see medium-term negative technical divergences - the most common divergences are between asset’s price and some indicator based on it (for instance the index and RSI based on the index). In this case, the divergence occurs when price forms a higher high and the indicator forms a lower high. It shows us that even though price reaches new highs, the fuel for the uptrend starts running low. The market got close to its previously broken rising wedge pattern. It is acting as a support level right now. However, the price is still walking a thin line here - just between that support level of around 26,000 and its relatively big Tuesday's daily gap down:
Concluding, the S&P 500 index was virtually flat on Thursday, as it extended its short-term consolidation following Monday-Tuesday sell-off. The broad stock market retraced its last week's advance, breaking below Tuesday-Thursday consolidation. Is this a new downtrend or just correction following month-long rally? For now, it looks like a correction, but we still see technical overbought conditions along with overly bullish investors' sentiment. However, there is some fear ahead of the opening of today's trading session. It looks like the early sign of a short-term bottom.
The S&P 500 index traded around 7.5% above its December 29 yearly closing price on Friday a week ago. This almost month-long rally seems unprecedented. The legendary investor John Templeton once said that "bull markets are born on pessimism, grow on skepticism, mature on optimism and die on euphoria”. So, is this an euphoria phase of the nine-year-long bull market? It's hard to say, but some major downside risks are growing.
There have been no confirmed negative signals so far, but we still can see medium-term overbought conditions. We can use indicators such as Relative Strength Index (RSI), Stochastic Oscillator, Money Flow Index to identify overbought conditions. For example, one can view a given market as "overbought" if the RSI indicator for this market is above 70. Paying attention to the overbought/oversold status of the market is very useful, but there are many other factors that need to be considered before placing a trade.
Currently, we prefer to be out of the market, avoiding low risk/reward ratio medium-term trades. We will let you know when we think it is safe to get back in the market.
To summarize: no medium-term positions are justified from the risk/reward perspective at this moment.
Intraday trade:
No intraday position is justified from the risk/reward perspective today.
No medium-term position is justified from the risk/reward perspective at this moment.
Thank you.
Paul Rejczak
Stock Trading Strategist
Stock Trading Alerts

