

Briefly:
Intraday trade: Our yesterday's neutral intraday outlook has proved accurate. The S&P 500 index gained 0.1% following an overall narrow intraday trading range. Investors await today's FOMC Statement release, among others. The market may retrace some of its recent rally, as the S&P 500 index is still at potential resistance level of around 2,500. On the other hand, support level is relatively close, at last week's Tuesday's daily gap up of 2,488.95-2,490.37. Therefore, we still prefer to be out of the market, avoiding low risk/reward ratio trades.
Medium-term trade: In our opinion, short position is favored (opened on June 5 at 2,437.83, with stop-loss at 2,510, and profit target at 2,300, S&P 500 index).
Our intraday outlook remains neutral, and our short-term outlook is bearish, as we expect downward correction. Our medium-term outlook remains bearish:
Intraday outlook (next 24 hours): neutral
Short-term outlook (next 1-2 weeks): bearish
Medium-term outlook (next 1-3 months): bearish
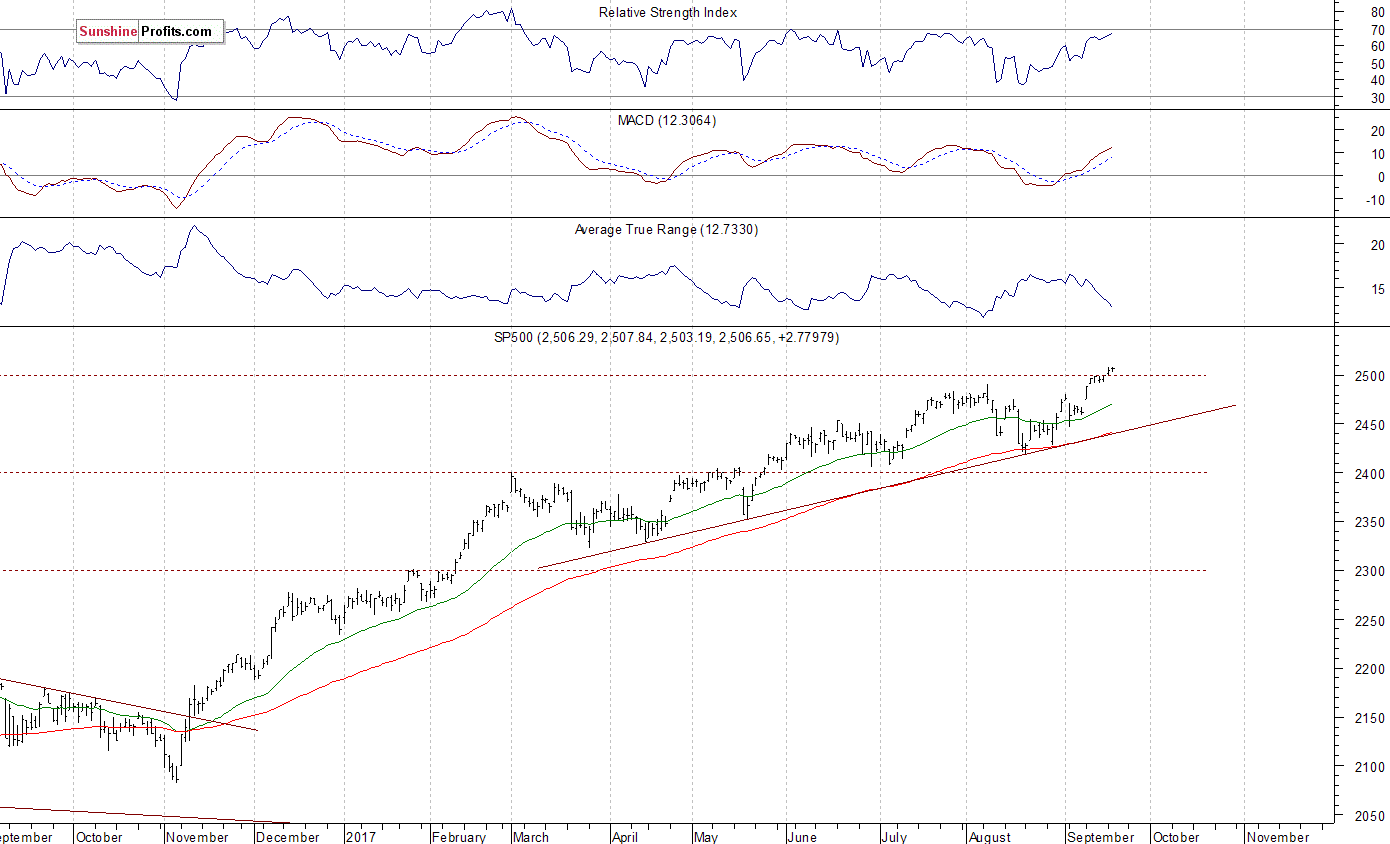
The U.S. stock market indexes gained 0.1-0.2% on Tuesday, fluctuating close to new record highs, as investors took some short-term profits off the table. The S&P 500 index remained slightly below its Monday's new all-time high at the level of 2,508.32. The Dow Jones Industrial Average has reached new record high at the level of 22,386.01 yesterday. The technology Nasdaq Composite fluctuated below Monday's new all-time high of 6,477.77. The nearest important level of resistance of the S&P 500 index is at around 2,510-2,520. On the other hand, support level is at 2,490-2,500, marked by last week's Tuesday's daily gap up of 2,488.95-2,490.37, among others. The next support level remains at around 2,465-2,475, marked by last Monday's daily gap up of 2,467.11-2,474.52. The level of support is also at 2,460, marked by previous short-term consolidation. The S&P 500 index resumed its long-term uptrend, as it reached new record above the level of 2,500. The uptrend continues despite some short-term technical overbought conditions. However, we still can see medium-term negative technical divergences:
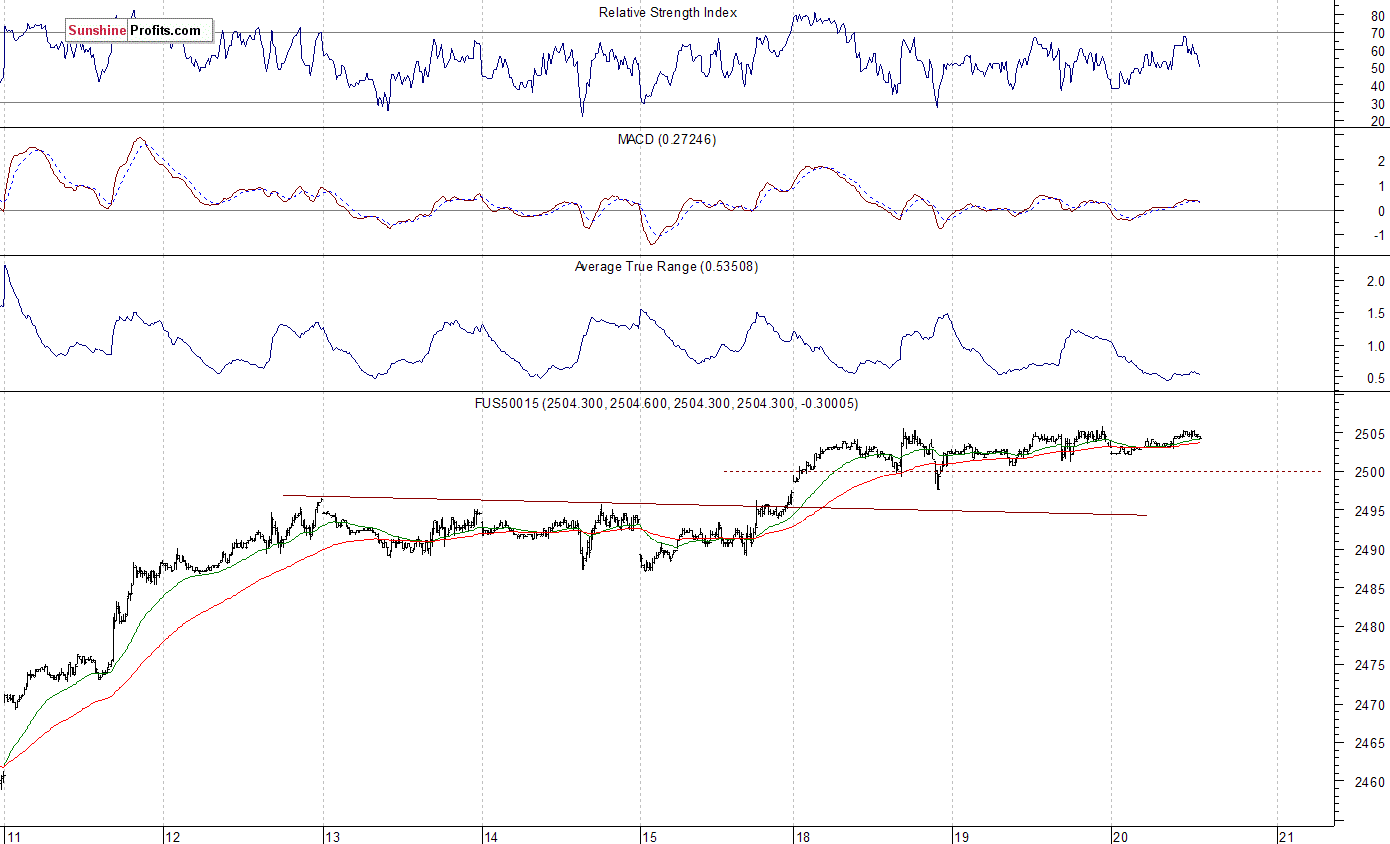
Expectations before the opening of today's trading session are virtually flat, with index futures currently between -0.05% and +0.05% vs. their Tuesday's closing prices. The European stock market indexes have been mixed so far. Investors will now wait for some economic data announcements: Existing Home Sales number at 10:00 a.m., Crude Oil Inventories at 10:30 a.m., the FOMC Statement at 2:00 p.m. The market expects that the FOMC monetary policy will remain unchanged. The S&P 500 futures contract trades within an intraday consolidation following overnight uptrend. It continues to trade close to record high above the level of 2,505. The nearest important level of resistance is at around 2,505-2,510. On the other hand, support level remains at 2,495-2,500, marked by previous level of resistance. The next support level is at 2,480-2,485, marked by short-term consolidation. The support level is also at 2,465-2,470, among others. The futures contract trades within a short-term consolidation above 2,500 mark, as we can see on the 15-minute chart:
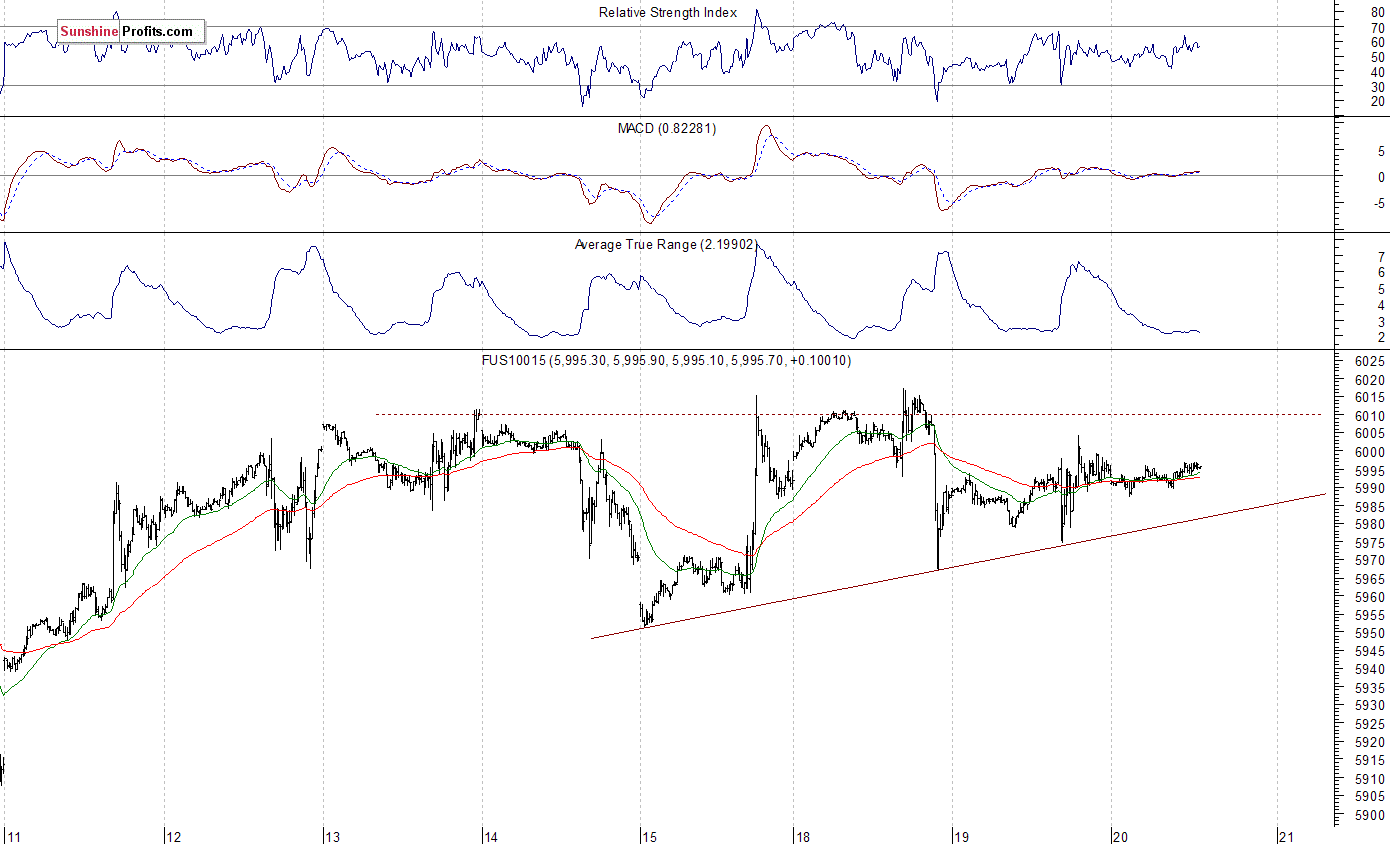
The technology Nasdaq 100 futures contract trades within a similar intraday consolidation following yesterday's fluctuations. It is relatively weaker than the broad stock market, as it still trades around 0.3-0.5% below record high. The nearest important level of resistance is at around 6,000. The next resistance level remains at 6,020, marked by the September 1 all-time high. On the other hand, support level is at 5,950-5,970, marked by some short-term local lows. The next level of support is at 5,920, marked by previous fluctuations. The Nasdaq futures contract continues to trade along the level of 6,000, as the 15-minute chart shows:
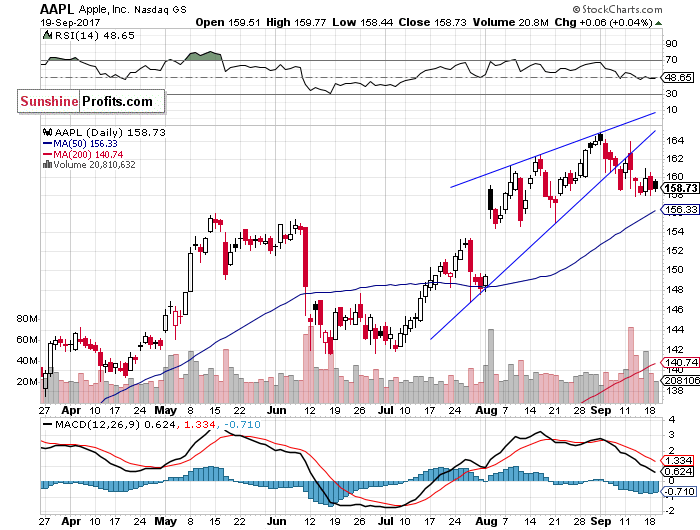
Let's take a look at Apple, Inc. stock (AAPL) daily chart (chart courtesy of http://stockcharts.com). It continues to trade below previously broken upward trend line and below an over-month-long rising wedge pattern. The Apple stock has weighting of around 4.0% in the S&P 500 index. We still can see some relative weakness vs. the broad stock market index:
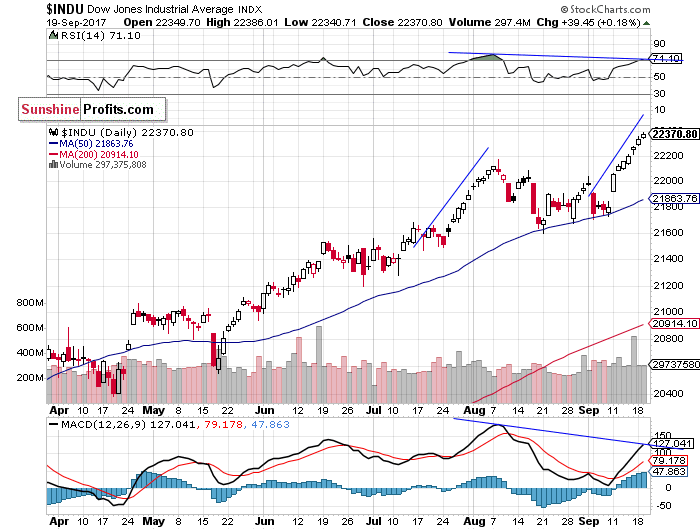
Now, let's take a look at the Dow Jones Industrial Average daily chart (chart courtesy of http://stockcharts.com). The blue-chip index remains relatively stronger than the broad stock market, as it continues its uptrend. Will it extend this move up despite some overbought conditions and negative technical divergences? So far, it looks similar to July - August advance:
Concluding, the S&P 500 index remained close to its new record high on Tuesday, as investors took short-term profits off the table. Will the bull market extend even further? Will it accelerate? There have been no confirmed short-term negative signals so far. However, we still can see some medium-term overbought conditions along with negative technical divergences.
We continue to maintain our medium-term short position (opened at 2,437.83 on June 5 - opening price of the S&P 500 index). Stop-loss level is very close, at 2,510 and potential profit target is at 2,300 (S&P 500 index). One can trade S&P 500 index using futures contracts (S&P 500 futures contract - SP, E-mini S&P 500 futures contract - ES) or an ETF like the SPDR S&P 500 ETF - SPY. It is always important to set some exit price level in case some events cause the price to move in the unlikely direction. Having safety measures in place helps limit potential losses while letting the gains grow.
To summarize: medium-term short position in S&P 500 index is justified from the risk/reward perspective with the following entry prices, stop-loss orders and profit target price levels:
Intraday trade:
No intraday position is justified from the risk/reward perspective today.
Medium-term trade:
S&P 500 index - short position: profit target level: 2,300; stop-loss level: 2,510
S&P 500 futures contract (December) - short position: profit target level: 2,297; stop-loss level: 2,507
SPY ETF (SPDR S&P 500, not leveraged) - short position: profit target level: $230; stop-loss level: $251
SDS ETF (ProShares UltraShort S&P500, leveraged: -2x) - long position: opening price: $12.56; profit target level: $13.98; stop-loss level: $11.82
Thank you.
Paul Rejczak
Stock Trading Strategist
Stock Trading Alerts

