

Briefly:
Intraday trade: Our yesterday's intraday trading outlook was neutral. It proved wrong because the S&P 500 index gained 0.6% following slightly higher opening of the trading session. The index may retrace some of its recent rally today, as investors are likely to take short-term profits off the table. Therefore, intraday short position is favored. Stop-loss is at the level of 2,560 and potential profit target is at 2,530 (S&P 500 index).
Medium-term trade: In our opinion, no medium-term positions are justified.
Our intraday outlook is bearish today. Our short-term outlook is neutral, and our medium-term outlook is neutral:
Intraday outlook (next 24 hours): bearish
Short-term outlook (next 1-2 weeks): neutral
Medium-term outlook (next 1-3 months): neutral
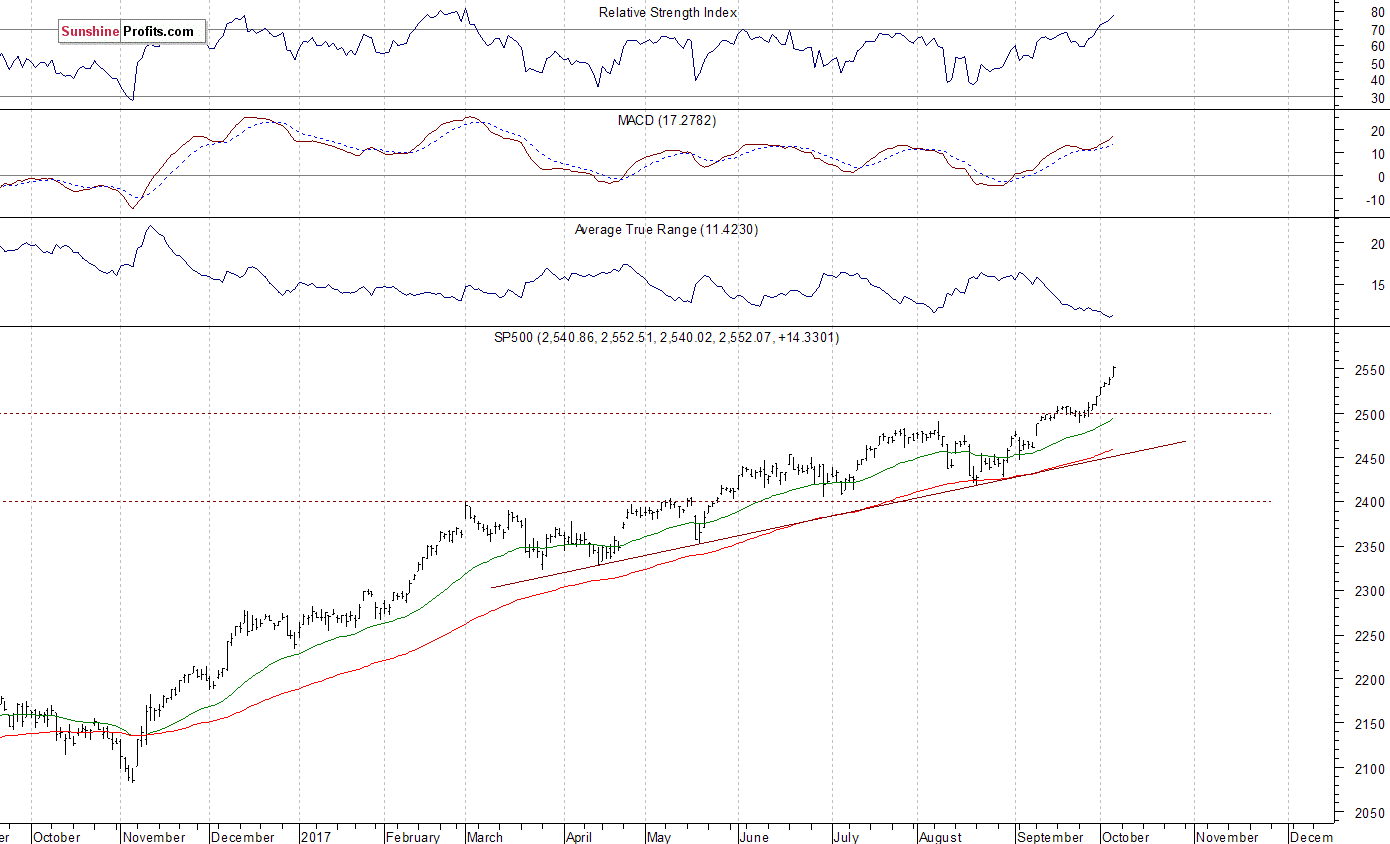
The U.S. stock market indexes gained between 0.5% and 0.8% on Thursday, extending their short-term uptrend, as investors' sentiment remained very bullish. The S&P 500 index has reached yet another new all-time high at the level of 2,552.51. It currently trades around 62 points or 2.5% above its early August local high of 2,490.87. The Dow Jones Industrial Average reached new record high at the level of 22,777.04, and the technology Nasdaq Composite reached new all-time high at the level of 6,587.21. The nearest important level of support of the S&P 500 index is at around 2,530, marked by some recent fluctuations. The next support level is at 2,520, marked by Tuesday's daily gap up of 2,519.44-2,520.40. The support level is also at 2,500-2,510, marked by previous level of resistance and local highs. The S&P 500 index accelerated its uptrend recently. We still can see medium-term negative technical divergences along with technical overbought conditions. However, there have been no confirmed negative signals so far.
Will Uptrend Continue?
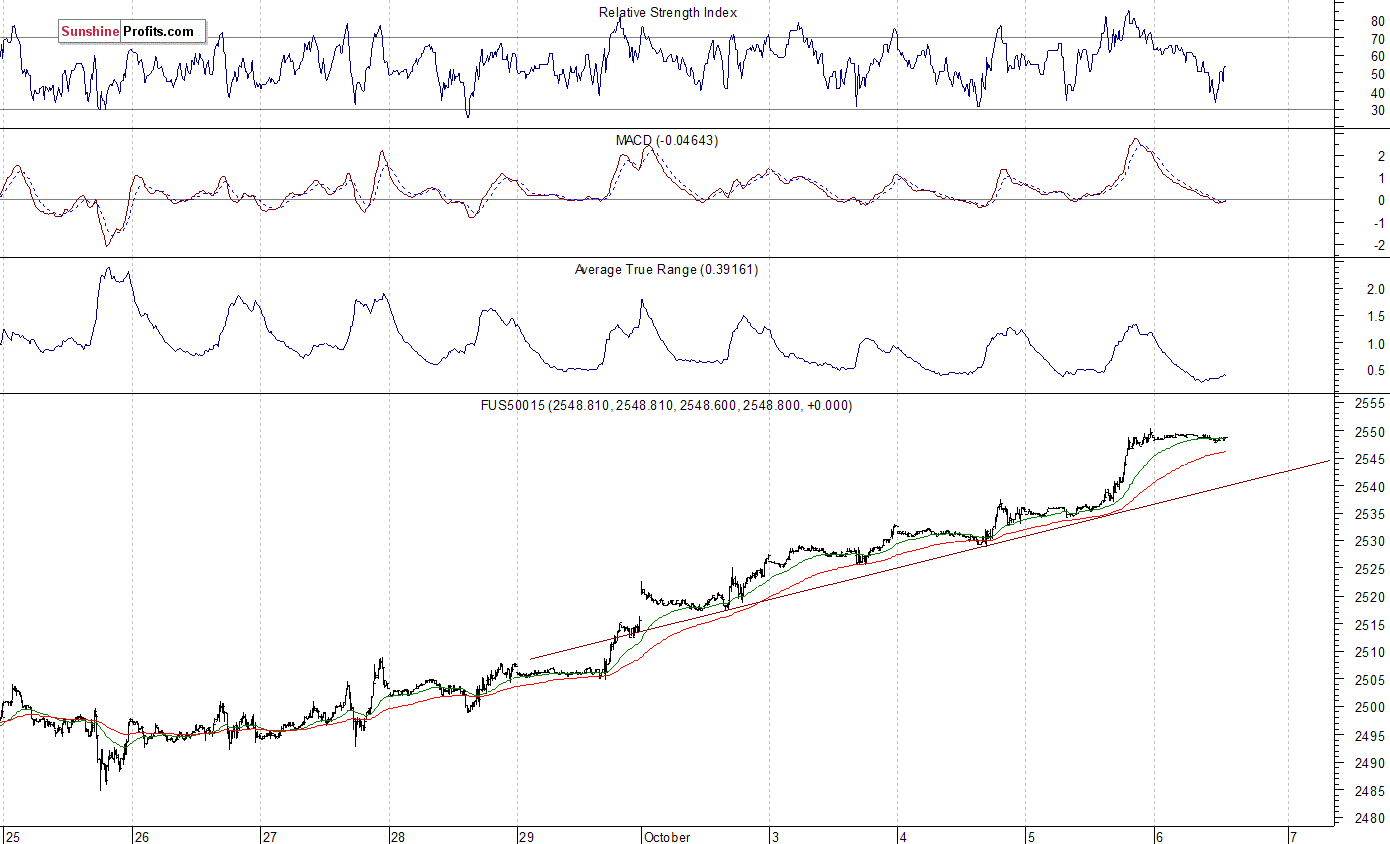
Expectations before the opening of today's trading session are virtually flat, with index futures currently between -0.05% and +0.05% vs. yesterday's closing prices. The European stock market indexes have been mixed so far. Investors will now wait for some important economic data announcements: Nonfarm Payrolls, Unemployment Rate at 8:30 a.m., Wholesale Inventories number at 10:00 a.m. The market expects that Nonfarm Payrolls number was at +82,000 in September. Investors will also wait for quarterly corporate earnings releases. The S&P 500 futures contract trades within an intraday consolidation following yesterday's rally. The nearest important level of resistance is at around 2,550, marked by new record high. On the other hand, level of support is at 2,535-2,540, marked by previous resistance level. The next support level is at 2,530, marked by short-term consolidation. The next support level is also at 2,520-2,525, marked by recent local lows. The futures contract is trading along new record high, as the 15-minute chart shows:
Nasdaq At New Record High
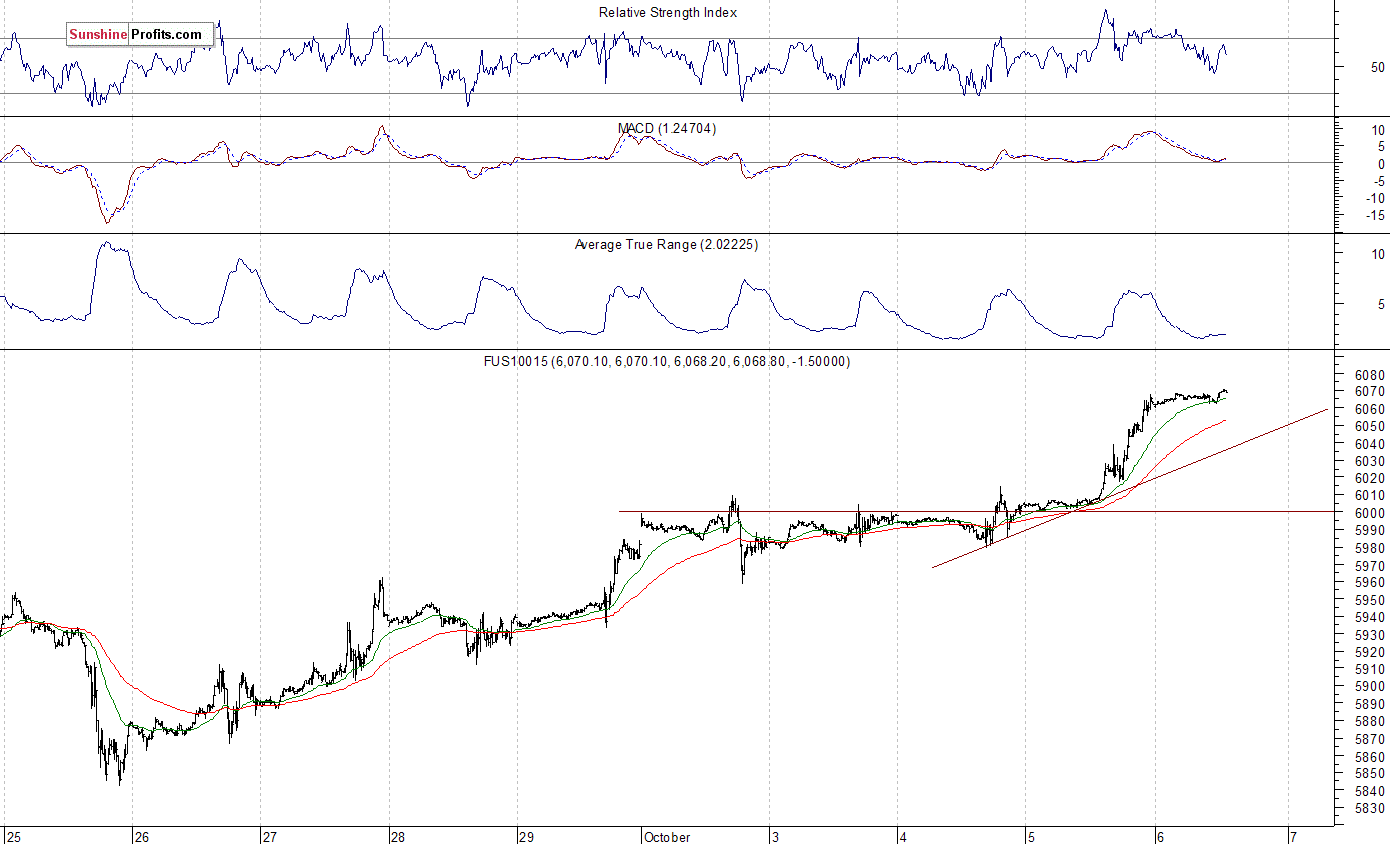
The technology Nasdaq 100 futures contract trades along new record highs, as it extends its uptrend today. The nearest important level of support is at around 6,000-6,020, marked by previous resistance level. Potential level of resistance is currently at around 6,100. The Nasdaq 100 futures contract trades broke above the level of 6,000, as we can see on the 15-minute chart:
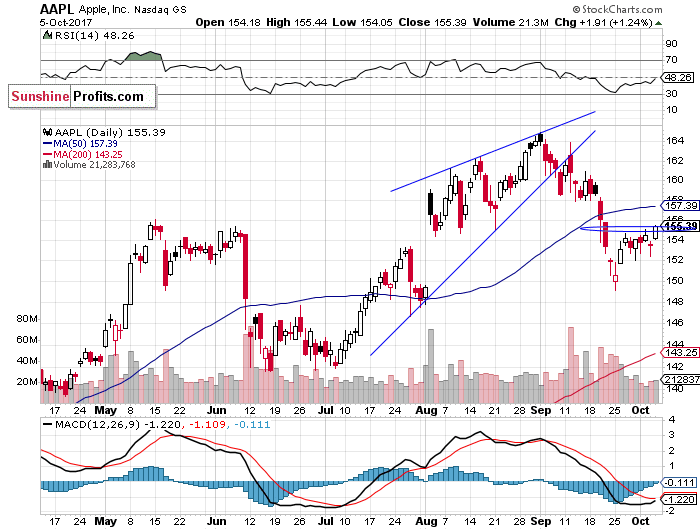
Let's take a look at Apple, Inc. stock (AAPL) daily chart (chart courtesy of http://stockcharts.com). It remains relatively weaker than the record-breaking broad stock market gauges. The price bounced off support level at around $150 recently. Is this a new uptrend? Or just upward correction before another leg lower? There have been no confirmed positive signals so far. The price trades at short-term resistance level of $155, marked by previous local lows:
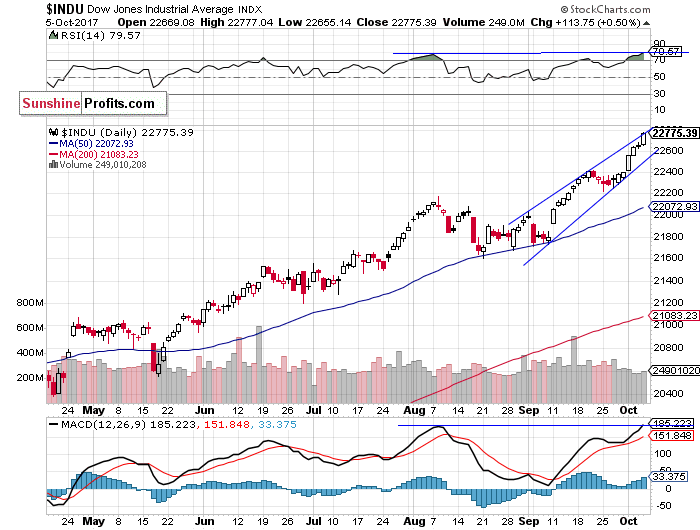
Now, let's take another look at the Dow Jones Industrial Average daily chart (chart courtesy of http://stockcharts.com). The blue-chip index reaches new record highs, as it gets closer to 23,000 mark. There have been no confirmed negative signals so far. However, we still can see some negative technical divergences. The price continues higher, while the technical indicator like RSI (Relative Strength Index) or MACD (Moving Average Convergence/Divergence) forms a lower high or remains at the same level. It shows us that even though price reaches new highs, the fuel for the uptrend starts running low. Bearish divergence is a moderately useful tool for detecting a coming reversal in the bullish trend, therefore it needs a confirmation. We can see relatively steep month-long upward trading channel or some negative rising wedge pattern. Is this a topping pattern? The price is at the upper trend line of that pattern:
Concluding, the S&P 500 index accelerated its uptrend on Thursday, as it gained 0.6%. Is this some blow-off top following recent advance? There have been no confirmed negative signals so far. However, we can see technical overbought conditions and negative divergences. The broad stock market may retrace some of its recent advance at some point.
Our medium-term short position (opened on June 5 at 2,437.83 - opening price of the S&P 500 index) has been closed on Tuesday, October 3, at the stop-loss level of 2,530 - S&P 500 index. We lost 92.17 index points or 3.8% on that trade, betting against long-term uptrend. Overall, this four-month-long medium-term bearish position proved wrong. It is always important to set some exit price level in case some events cause the price to move in the unlikely direction. Having safety measures in place helps limit potential losses while letting the gains grow. Currently, we prefer to be out of the market, avoiding low risk/reward ratio trades. We will let you know when we think it is safe to get back in the market.
To summarize: no intraday or medium-term positions are justified from the risk/reward perspective at this moment.
Intraday trade:
S&P 500 index - short position: profit target level: 2,530; stop-loss level: 2,560,
S&P 500 futures contract (September) - short position: profit target level: 2,527; stop-loss level: 2,557
SPY ETF (SPDR S&P 500, not leveraged) - short position: profit target level: $253; stop-loss level: $256
Medium-term trade:
No medium-term position is justified from the risk/reward perspective at this moment.
Thank you.
Paul Rejczak
Stock Trading Strategist
Stock Trading Alerts

