

Briefly:
Intraday trade: Our Friday's intraday trading outlook was bearish. It proved wrong because the S&P 500 gained 0.9% following higher opening of the trading session. However, the price reached our stop-loss level of 2,670 early in the day. It is always important to set some exit price level in case some events cause the price to move in the unlikely direction. Having safety measures in place helps limit potential losses while letting the gains grow. The S&P 500 index continued up to 2,680 mark on Friday. We still can see technical overbought conditions. However, there have been no confirmed negative signals so far. Therefore, we prefer to be out of the market again, avoiding low risk/reward ratio trades.
Medium-term trade: In our opinion, no medium-term positions are justified.
Our intraday outlook is neutral today. Our short-term outlook is neutral, and our medium-term outlook is neutral:
Intraday outlook (next 24 hours): neutral
Short-term outlook (next 1-2 weeks): neutral
Medium-term outlook (next 1-3 months): neutral
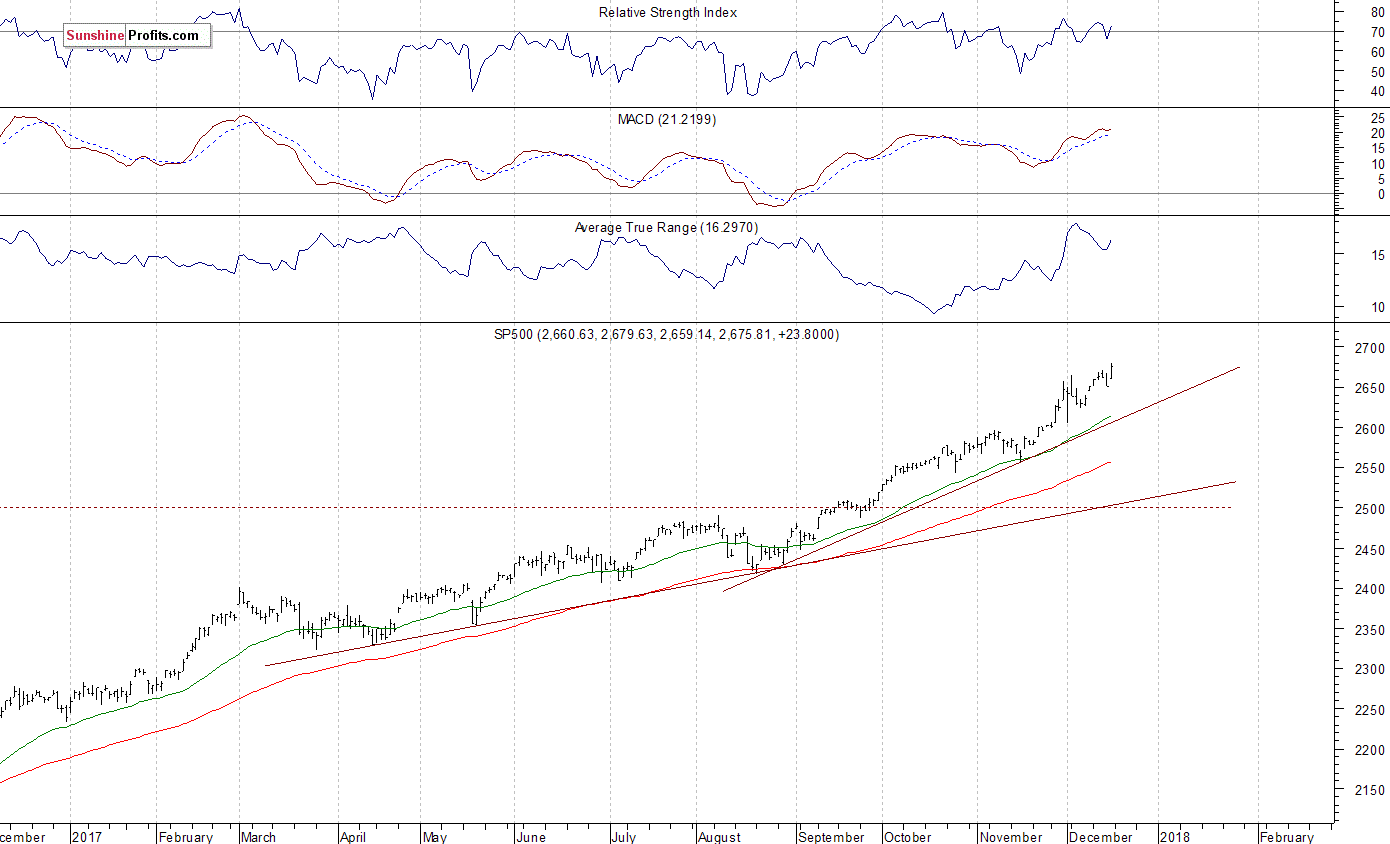
The U.S. stock market indexes gained between 0.6% and 1.2% on Friday, as investors sentiment much improved following economic data, tax cuts plan releases, among others. The S&P 500 index has reached yet another new all-time high at the level of 2,679.63, after breaking above its short-term consolidation. It closed around 0.2% above last week's Wednesday's previous record high. The Dow Jones Industrial Average was relatively weaker than the broad stock market, as it gained 0.6%, However, it reached new all-time high of 24,688.69, just slightly above Thursday's record level. The technology Nasdaq Composite was relatively stronger. It gained 1.2% and reached new all-time high at 6,945.82. The nearest important level of support of the S&P 500 index is at 2,670, marked by recent consolidation. The next level of support is at 2,640-2,650, marked by the December 8 daily gap up of 2,640.99-2,644.10. On the other hand, resistance level is at around 2,680, marked by new all-time high. Potential resistance level is also at 2,700. There have been no confirmed negative signals so far. However, we still can see medium-term technical overbought conditions along with negative technical divergences:
Positive Expectations, Will Rally Continue?
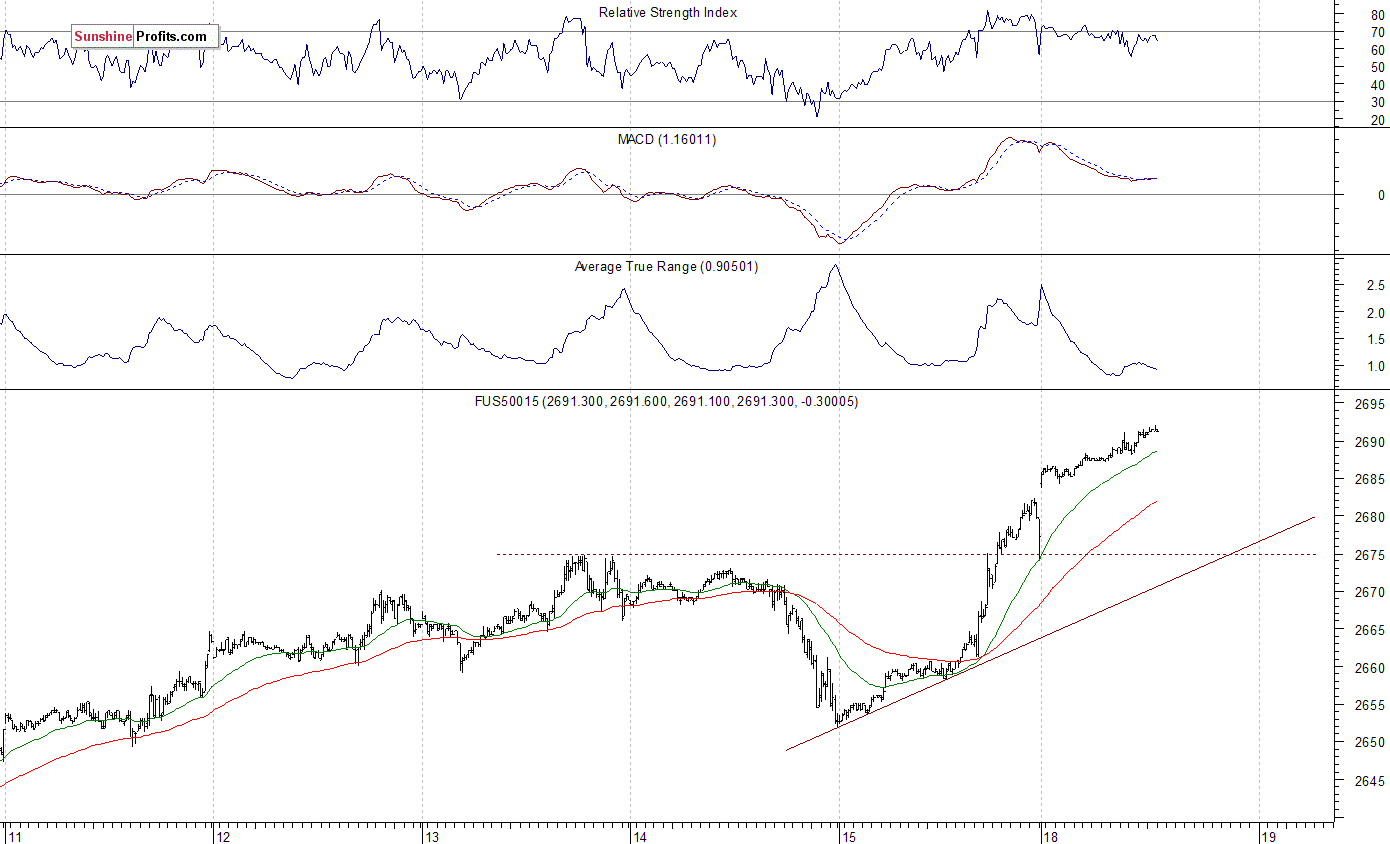
Expectations before the opening of today's trading session are positive, with index futures currently up 0.4-0.6% vs. Friday's closing prices. The European stock market indexes have gained 0.4-1.6% so far. Investors will wait for the NAHB Housing Market Index release at 10:00 a.m. The market expects that it was at 70 in December. The S&P 500 futures contract trades within an intraday uptrend, as it extends its Friday's rally. The nearest important level of support is at around 2,680-2,685, marked by an overnight low. On the other hand, resistance level is at round 2,700. The futures contract trades along new record high, as we can see on the 15-minute chart:
Nasdaq At New Record High
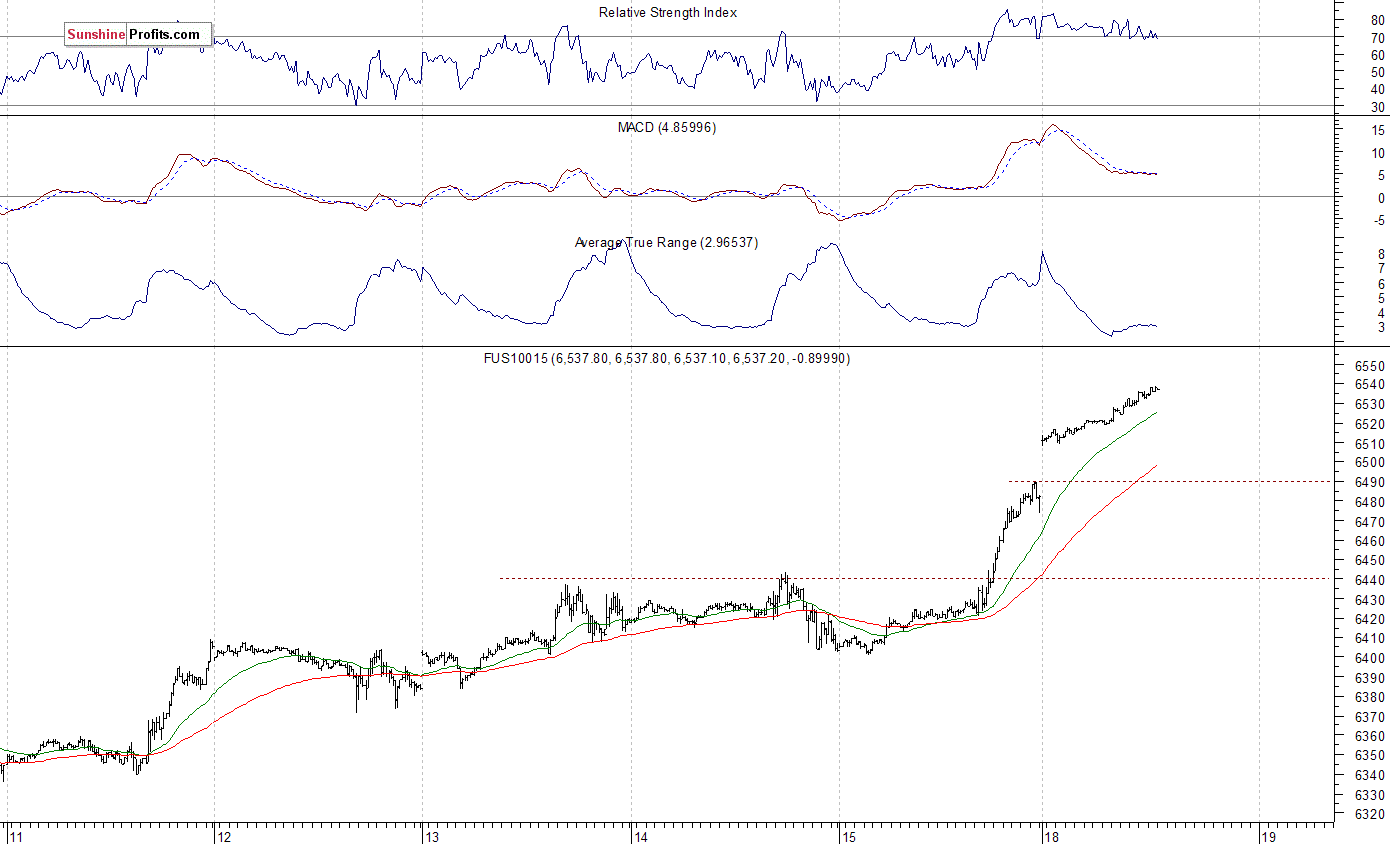
The technology Nasdaq 100 futures contract follows a similar path, as it continues its short-term uptrend towards new record highs above the level of 6,500. The nearest important level of support is at around 6,510-6,520, and the next support level is at 6,490-6,500, marked by the overnight opening gap-up. The Nasdaq 100 futures contract extends its Friday's rally today, as the 15-minute chart shows:
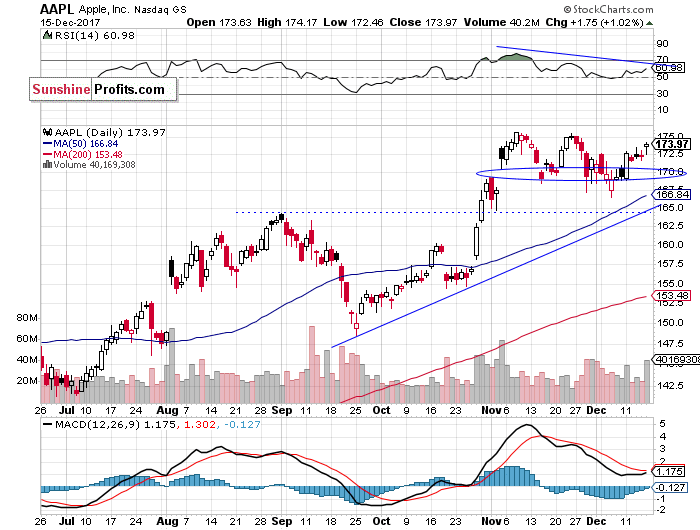
Let's take a look at Apple, Inc. stock (AAPL) daily chart (chart courtesy of http://stockcharts.com) once again. The price reached new record high a month ago, as it extended its uptrend following better-than-expected quarterly earnings release. Since then it fluctuated along the level of $170. The price bounced off support level of the early November daily gap up recently. Is this a month-long topping pattern or just consolidation before another leg up? Will the stock continue its Friday's move up and reach new record high?
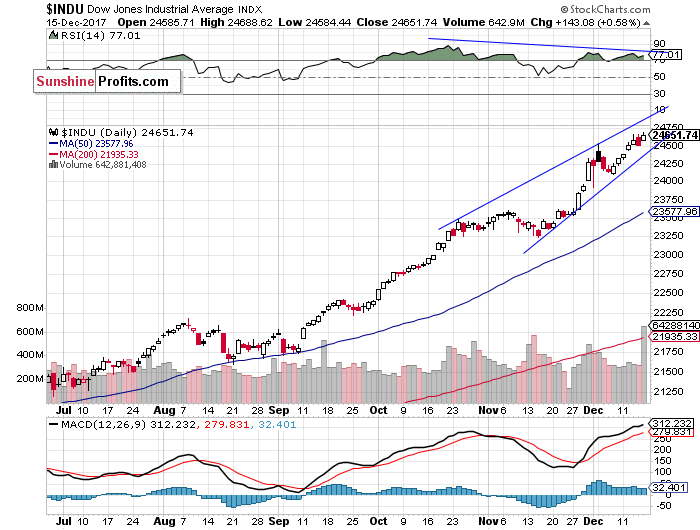
The Dow Jones Industrial Average daily chart shows that blue-chip index extended its uptrend on Friday, despite Thursday's weakness. We still can see negative technical divergences. The most common divergences are between asset’s price and some indicator based on it (for instance the index and RSI based on the index). In this case, the divergence occurs when price forms a higher high and the indicator forms a lower high. It shows us that even though price reaches new highs, the fuel for the uptrend starts running low. We also see potential two-month-long rising wedge pattern:
Concluding, the S&P 500 index broke above its short-term consolidation on Friday, as it gained 0.9%. The broad stock market has reached new record high following economic data, tax cuts plan releases. We still can see medium-term overbought conditions along with negative technical divergences. However, there have been no confirmed negative signals so far.
Currently, we prefer to be out of the market, avoiding low risk/reward ratio medium-term trades. We will let you know when we think it is safe to get back in the market.
To summarize: no medium-term positions are justified from the risk/reward perspective at this moment.
Intraday trade:
No intraday position is justified from the risk/reward perspective today.
No medium-term position is justified from the risk/reward perspective at this moment.
Thank you.
Paul Rejczak
Stock Trading Strategist
Stock Trading Alerts

