

Briefly:
Intraday trade: The S&P 500 index lost 0.7% on Monday, after opening 0.9% higher. The broad stock market will probably open slightly higher today. We may see another attempt at bouncing towards the previous support level of around 2,700. However, there have been no confirmed positive signals so far.
Trading position (short-term; our opinion): no positions are justified from the risk/reward perspective.
Our short-term outlook is neutral, and our medium-term outlook is neutral:
Short-term outlook (next 1-2 weeks): neutral
Medium-term outlook (next 1-3 months): neutral
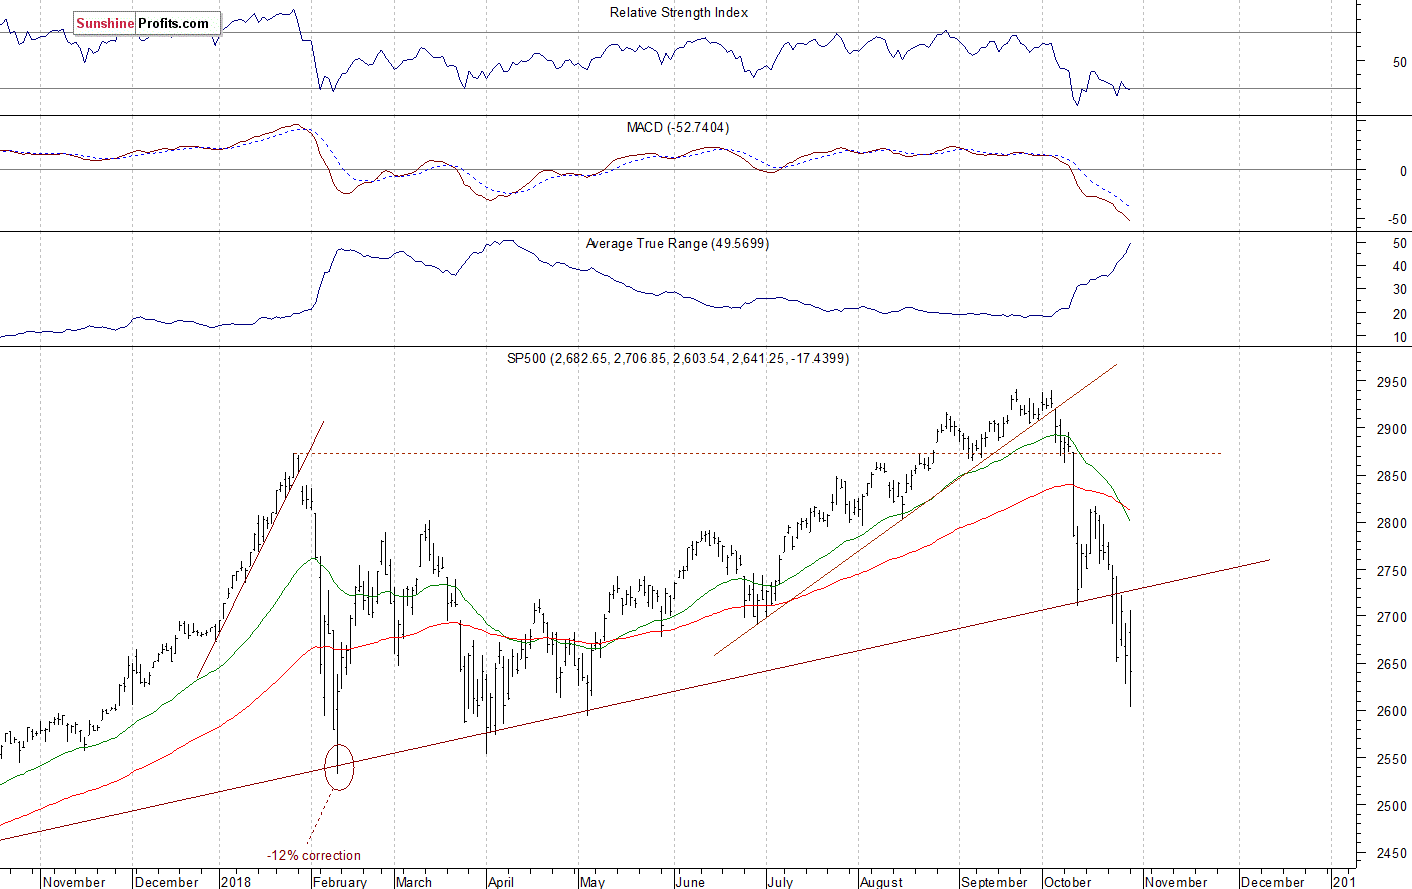
The U.S. stock market indexes lost between 0.7% and 1.6% on Monday, as they extended their downtrend before bouncing off at the end of the day. The S&P 500 index has reached the new medium-term low at the level of 2,603.54. It was 11.5% below September the 21st record high of 2,940.91. It currently trades 10.2% below the all-time high. The Dow Jones Industrial Average lost 1.0% and the Nasdaq Composite lost 1.6% yesterday.
The nearest important level of resistance of the S&P 500 index remains at around 2,690-2,700, marked by the previous support level. The next resistance level is at 2,730, marked by the long-term upward trend line. The resistance level is also at 2,750-2,760. On the other hand, the support level is at 2,630-2,650. The level of support is also at around 2,600, marked by yesterday's daily low and the early May local low of 2,594.62.
The broad stock market further extended its downtrend yesterday, as the S&P 500 index fell closer to 2,600 mark. There have been no confirmed positive signals so far. However, we could see another attempt at reversing higher here. The S&P 500 index fell 11.5% off its late September record high, so the downward correction is still slightly smaller than the January's-February's sell-off of 12%:
Mixed Expectations
Expectations before the opening of today's trading session are slightly positive, because the index futures contracts trade 0.3% above their yesterday's closing prices. The European stock market indexes have been mixed so far. Investors will wait for the Consumer Confidence number release at 10:00 a.m. today. Investors will also wait for more quarterly earnings releases. The broad stock market will likely extend its volatile consolidation following a breakdown the long-term upward trend line and the support level of 2,700. We may see an attempt at getting closer to 2,700 mark again (S&P 500 index). We still can see short-term technical oversold conditions.
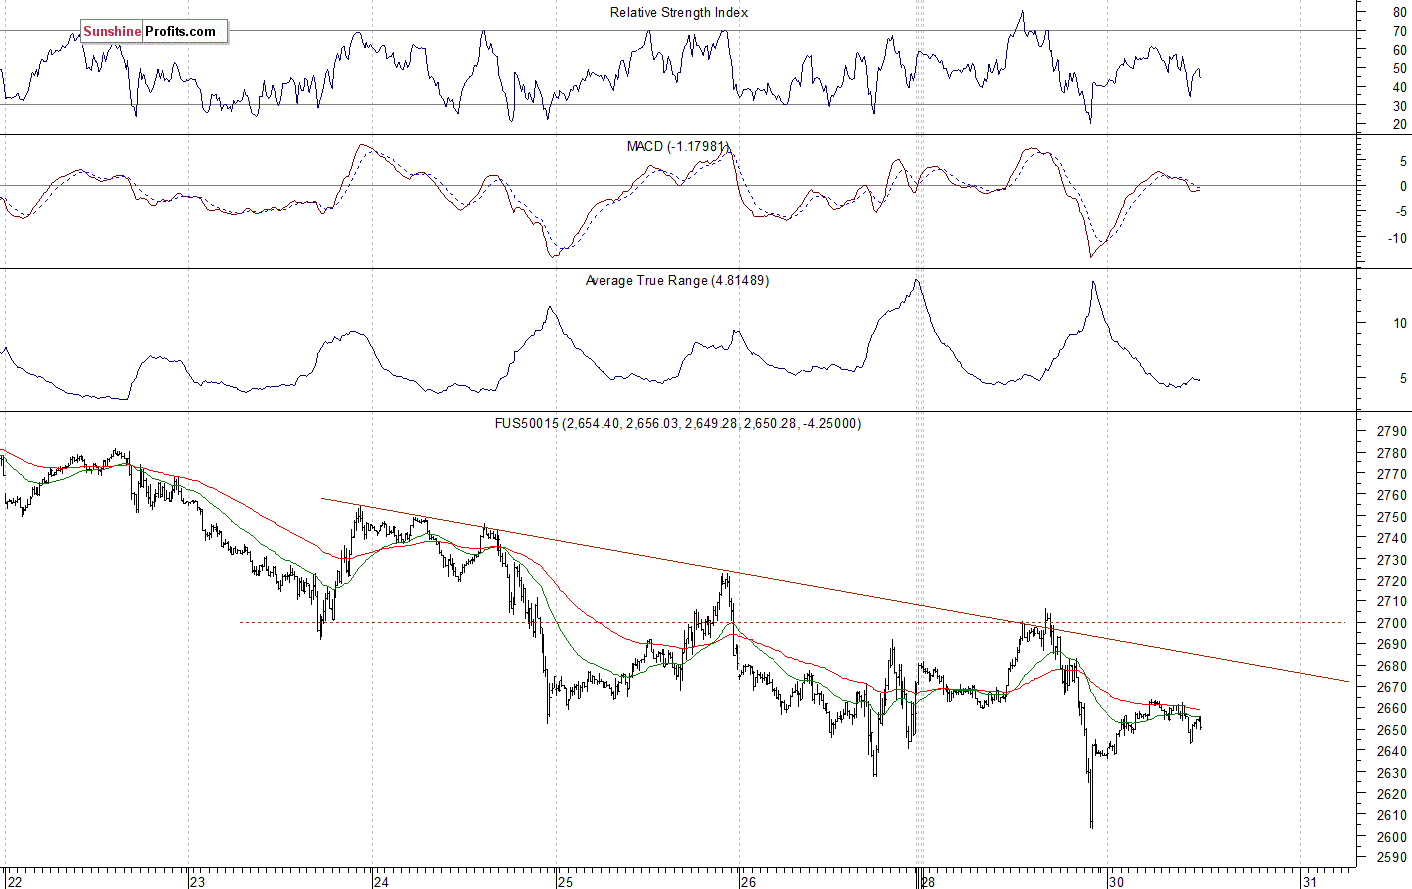
The S&P 500 futures contract trades within an intraday consolidation following yesterday's late-day rebound. The nearest important resistance level is now at around 2,680-2,700. On the other hand, the support level is at 2,600-2,620. The futures contract extends its short-term consolidation along the level of 2,650, as we can see on the 15-minute chart:
Nasdaq Bounced Off 7,000
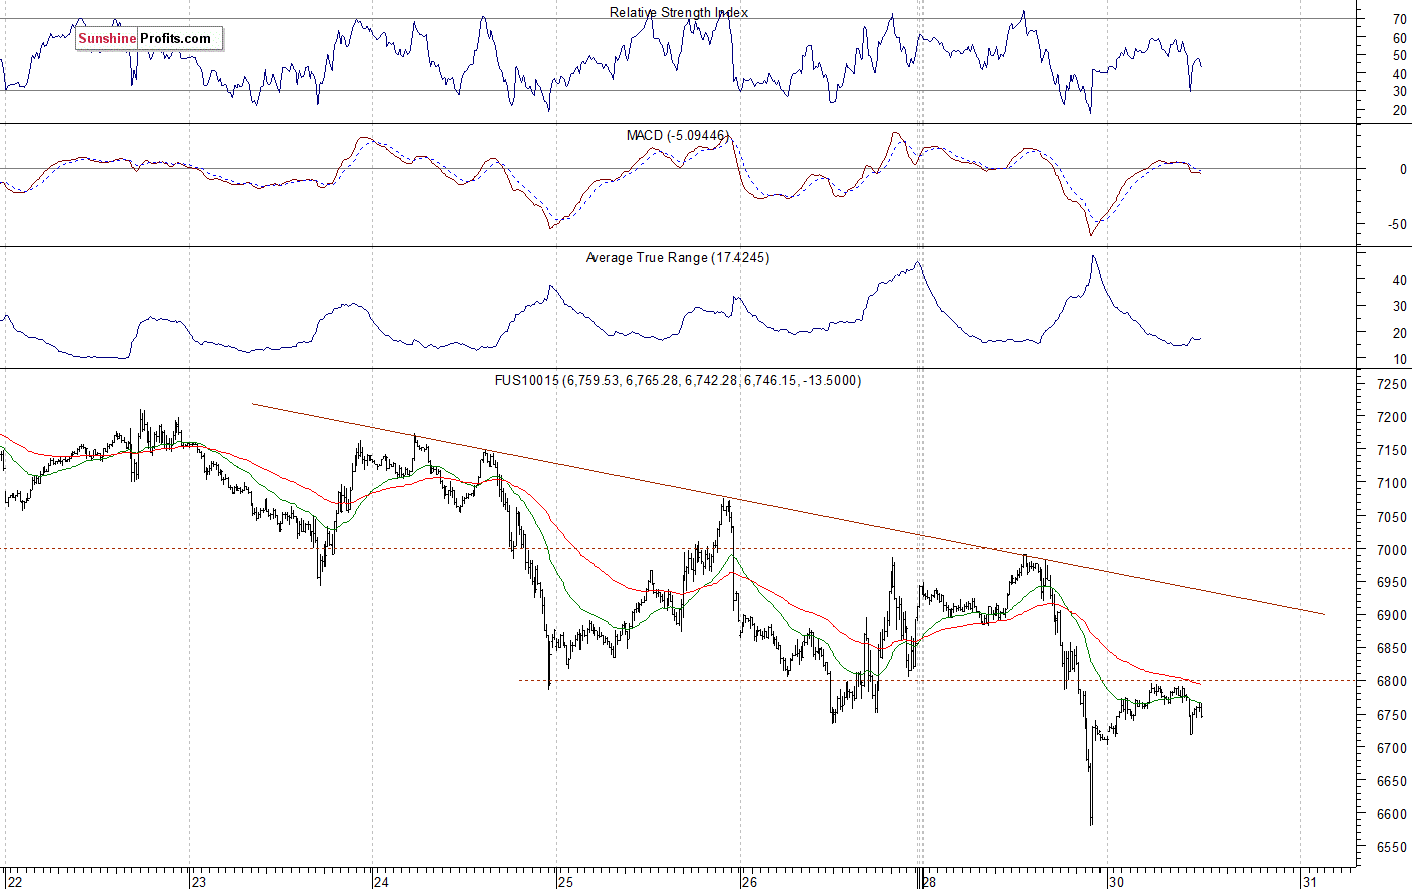
The technology Nasdaq 100 futures contract follows a similar path, as it trades within an intraday consolidation. The market reached the new low at around 6,580 yesterday. So it fell 1,150 points off its October the 1st record high above the level of around 7,730. We could see more short-term volatility. The nearest important level of resistance is now at around 6,800-6,900. On the other hand, the support level is at 6,600-6700, among others. The Nasdaq futures contract continues to trade below its short-term downward trend line, as the 15-minute chart shows:
Amazon Disaster, Apple Remains Relatively Strong
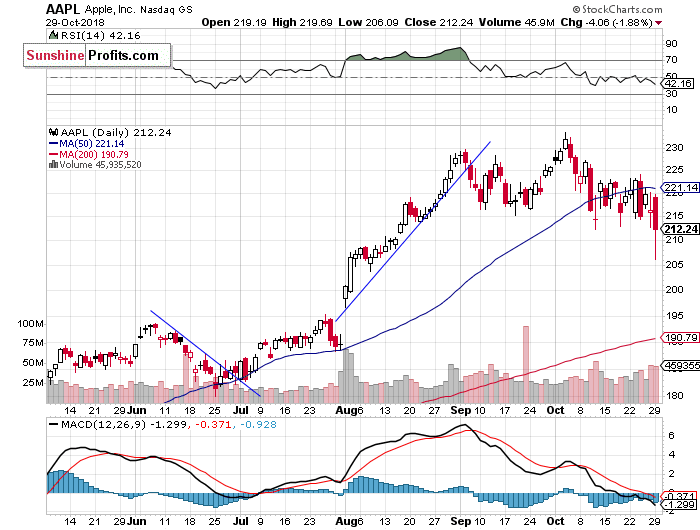
Let's take a look at Apple, Inc. stock (AAPL) daily chart (chart courtesy of http://stockcharts.com). It reached the new record high at the level of $233.47 in the early October, as it continued to act relatively strong. Then the stock retraced the short-term rally. The support level remained at around $215, and the price kept bouncing off that level despite the overall stock market weakness. However, the market followed the broad stock market's weakness yesterday, as it fell towards the price of $205. Was it a downward correction or the meaningful breakdown lower? The stock came back to the broken support level, so the question remains. Investors will wait for the quarterly earnings release on November the 1st.
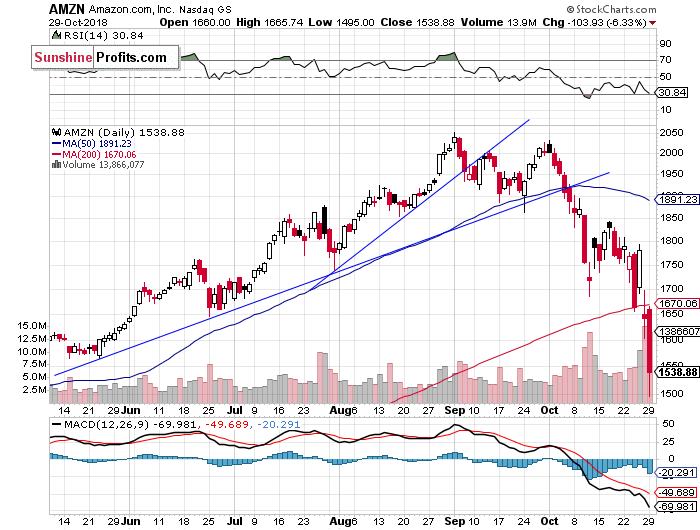
Now let's take a look at Amazon.com, Inc. stock (AMZN) daily chart. It accelerated its sell-off on Friday, following Thursday's quarterly earnings release. Then it fell lower yesterday, as it reached the price of $1,500. The stock trades within a very strong downtrend. However, we may see an attempt at reversing higher at some point:
Dow Jones Also Lower
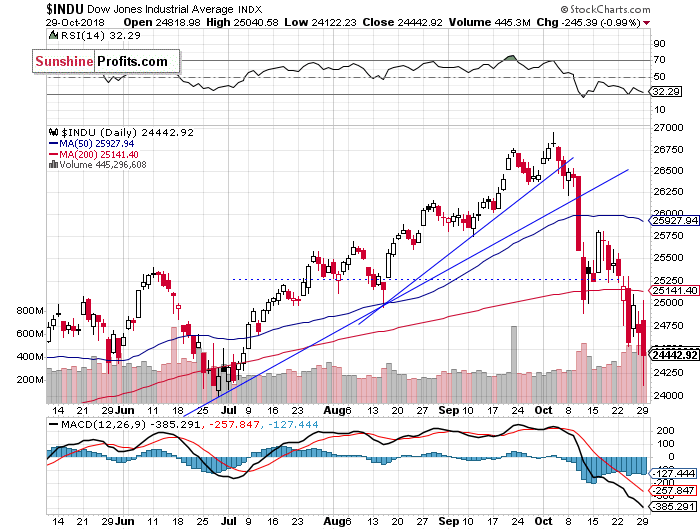
The Dow Jones Industrial Average reached its new all-time high at the level of 26,951.81 on October the 3rd. Then the blue-chip stocks' gauge broke below its medium-term upward trend lines and the support level of around 26,000. It quickly continued towards the 25,000 mark. There we saw a consolidation, but the index broke lower again. The nearest important level of support is still at around 24,000-24,250, marked by the previous local low. The blue-chip index reached the new medium-term low yesterday:
German DAX Reversing Higher?
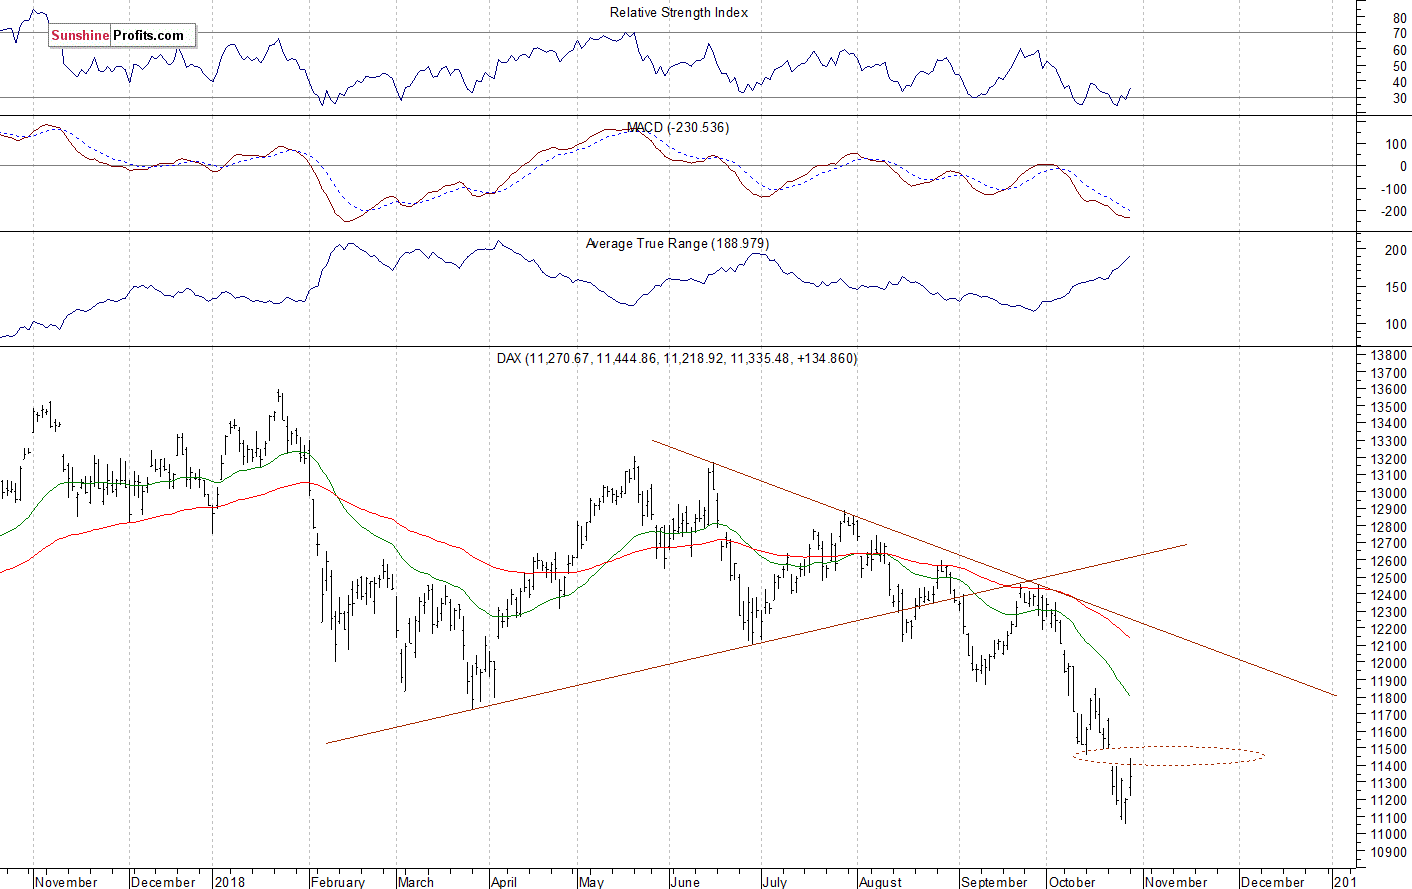
Let's take a look at the German DAX index now. It was relatively weaker than the U.S. broad stock market recently, as it remained below its late March local low of 11,727. Last week it accelerated the downtrend following gapping down on Tuesday. The nearest important resistance level is at 11,400-11,500, marked by that daily gap down. Was it a so-called "exhaustion gap" before reversing higher? Yesterday, the market retraced some of its recent decline, and it traded within the mentioned gap down:
The S&P 500 index extended its downtrend once again yesterday, as it fell close to the level of 2,600 before bouncing off at the end of the day. Stocks are expected to open slightly higher today. Will the downtrend reverse here? There have been no confirmed positive signals so far.
Concluding, the S&P 500 index will probably open slightly higher today. However, we may see more volatile fluctuations. For now, it looks like a consolidation following the recent rout.
Trading position (short-term; our opinion): no positions are justified from the risk/reward perspective.
Thank you.
Paul Rejczak
Stock Trading Strategist
Stock Trading Alerts

