

Briefly:
Intraday trade: Our Tuesday's intraday trading outlook was neutral. It proved accurate because the S&P 500 index gained just 0.3%. The market remained within its Monday's consolidation. Will the short-term move up continue? The index is expected to open higher today, so it may slightly extend its Friday-Monday's advance. We prefer to be out of the market today, avoiding low risk/reward ratio trades.
Medium-term trade: In our opinion, no medium-term positions are justified.
Our intraday outlook is neutral. Our short-term outlook is neutral, and our medium-term outlook is neutral:
Intraday outlook (next 24 hours): neutral
Short-term outlook (next 1-2 weeks): neutral
Medium-term outlook (next 1-3 months): neutral
The U.S. stock market indexes gained 0.2-0.5% on Tuesday, as investors' sentiment slightly improved following rebound off Friday's low. However, the S&P 500 index remained within its Monday's trading range. It gained 0.3%. Stocks are extending their over-week-long volatile fluctuations after the early February sell-off. The S&P 500 index retraced some of its recent move down, but it trades 7.3% below its January 26 record high of 2,872.87. Last Friday it traded 11.8% below its January 26 record high of 2,872.87 (-340.2 points). The Dow Jones Industrial Average gained 0.2%, and the technology Nasdaq Composite gained 0.5% yesterday.
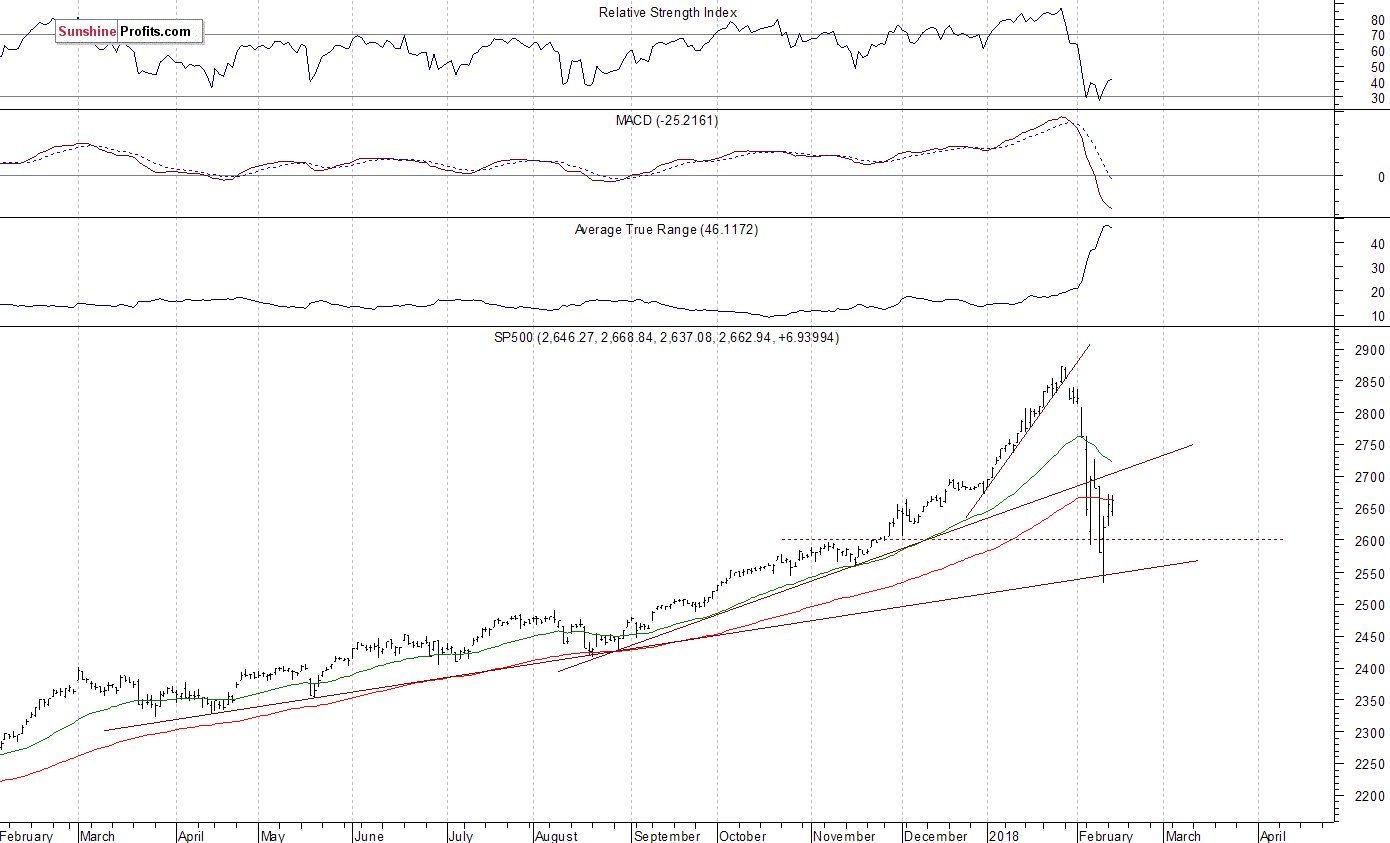
The nearest important level of resistance of the S&P 500 index remains at 2,680-2,700, marked by local highs. The next resistance level is at around 2,730, marked by last week's Wednesday' local high. On the other hand, support level is at 2,640-2,650, marked by previous level of resistance and some local lows. The next support level is at 2,580-2,600. Potential level of support is also at 2,530-2,550, marked by Friday's daily low.
The index reached its record high more than two weeks ago on Friday, January 26. It broke below month-long upward trend line on Tuesday, January 30 following gap-down opening of the trading session, confirming uptrend's reversal. Then the market retraced all of its January rally and continued lower. The index extended its downtrend on Friday, as it fell almost 12% below its late January record high. We can see that stocks are sharply reversing their medium-term upward course following the whole retracement of last month's euphoria rally. The market bounced off its almost year-long medium-term upward trend line on Friday, but it remains below somewhat steeper August-February upward trend line, as the daily chart shows:
New Uptrend Or Just Bounce?
The index futures contracts gain 0.4-0.5% vs. their yesterday's closing prices right now. So, investors' expectations ahead of the opening of today's trading session are positive following yesterday's uncertainty. The European stock market indexes have gained 0.7-0.8% so far. Will the sentiment change before cash market opening at 9:30 a.m.? For now, it looks like the market may slightly extend its short-term uptrend. It will retrace some more of its Wednesday-Friday's sell-off. Investors will wait for series of economic data announcements today: Consumer Price Index, Retail Sales at 8:30 a.m., Business Inventories at 10:00 a.m., Crude Oil Inventories at 10:30 a.m. The market expects that Retail Sales grew 0.2%, and Consumer Prices increased 0.3% in January. Investors will also wait for more quarterly corporate earnings releases.
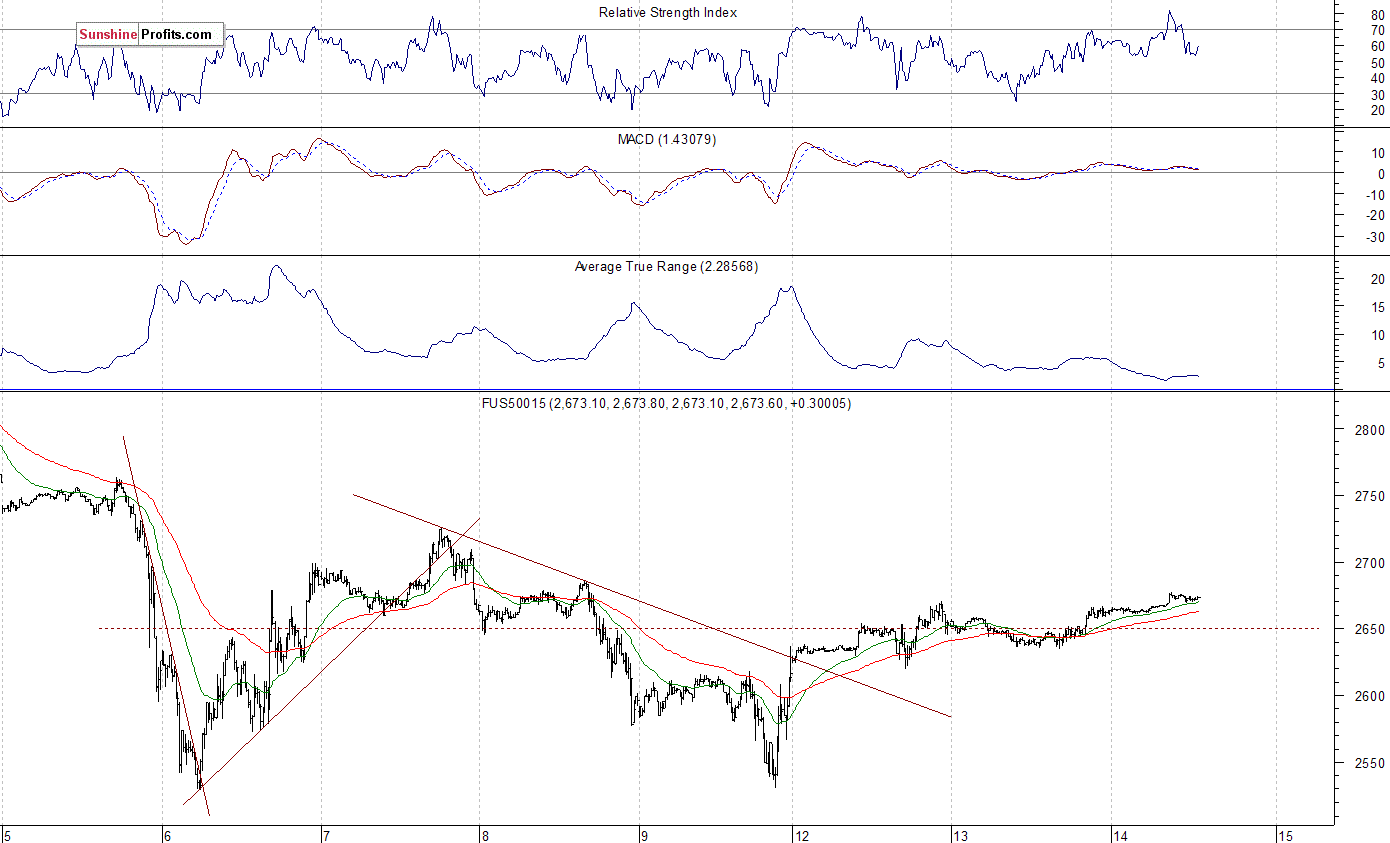
The S&P 500 futures contract trades within an intraday uptrend, as it extends its short-term move up after bouncing off Friday's local low. Investors took some short-term profits off the table yesterday, but the market breaks above its consolidation along the level of 2,650 today. The nearest important level of support is at 2,650-2,660, marked by recent fluctuations. The next support level is at 2,630, marked by local lows. On the other hand, resistance level is at around 2,680-2,700. The futures contract trades slightly above its yesterday's daily high, as we can see on the 15-minute chart:
Nasdaq Also Higher
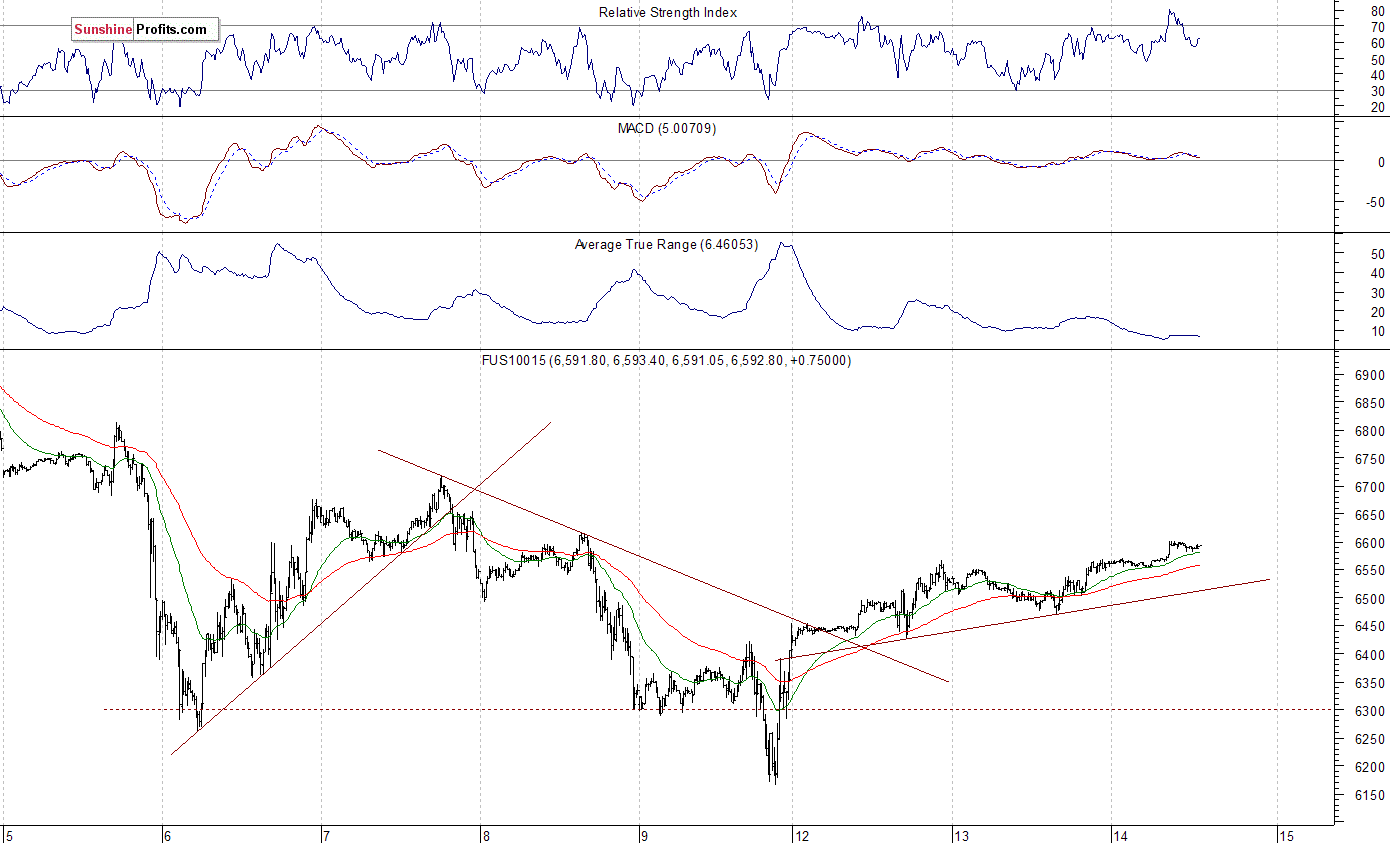
The technology Nasdaq 100 futures contract follows a similar path, as it trades within an intraday uptrend. The market broke above its short-term consolidation along the level of 6,550-6,570. Will it continue higher? The nearest important level of resistance is at around 6,600-6,620. The next resistance level is at 6,650-6,720, marked by previous local highs. On the other hand, support level is at 6,500-6,550. The Nasdaq futures contract trades above its short-term upward trend line, as the 15-minute chart shows:
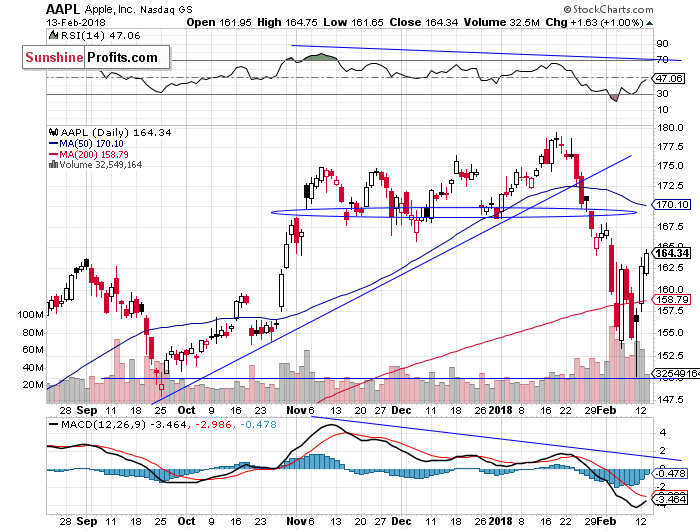
Let's take a look at Apple, Inc. stock (AAPL) daily chart (chart courtesy of http://stockcharts.com). It was one of the recent stock market rout's main drivers. The stock reached new record high a month ago following short-term consolidation along the support level of $175. The market got closer to $180 mark, but it failed to continue higher. Consequently, the stock retraced its January advance and continued lower. It broke its losing streak on Tuesday last week, but failed to reverse the downtrend. It fell close to support level of $150 on Friday. Then, it bounced and closed positive. The stock continued higher yesterday. Is this an upward reversal? For now, it looks like some upward correction. The nearest important level of resistance is at around $165-170, and support level remains at $150-155:
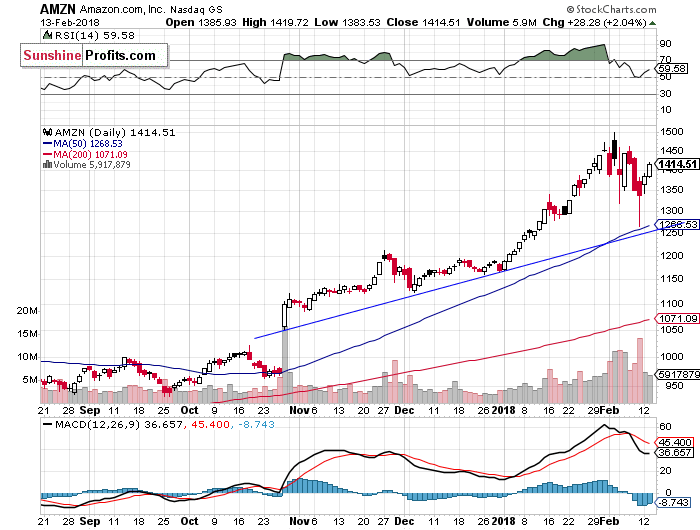
Amazon.com, Inc. stock (AMZN) was relatively strong vs. the broad stock market recently. Despite an overall weakness, it was extending its month-long rally up until Friday over a week ago and its new record high at around $1,500 mark. The stock continues to trade well above its end of year closing price of $1,167.5. AMZN bounced off its upward trend line on Friday, following downward correction below the price of $1300. Will it continue towards new record highs? Depends on what the whole stock market does in the near future, but this stock continues to act pretty bullish:
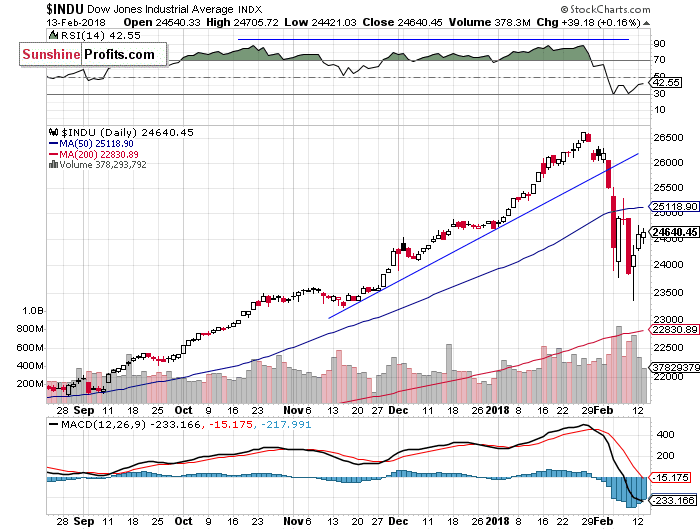
The Dow Jones Industrial Average daily chart shows that blue-chip index broke below its short-term consolidation a week ago on Friday. The price sharply accelerated its downtrend on Monday, as it broke below the level of 25,500 and continued towards 24,000 mark. There were some medium-term negative technical divergences - the most common divergences are between asset’s price and some indicator based on it (for instance the index and RSI based on the index). In this case, the divergence occurs when price forms a higher high and the indicator forms a lower high. It shows us that even though price reaches new highs, the fuel for the uptrend starts running low.
The DJIA broke below its three-month-long upward trend line and retraced most of the November-January rally. Is this a new downtrend or still just correction? Last week's Tuesday's bounce was a first positive signal for the blue-chip market. We saw positive bullish piercing candlestick chart pattern. It is a pattern where the price literally pierces up through the falling market. However, the index struggled at the nearest important resistance level of 25,000, and reversed its short-term move up. Consequently, it fell below 24,000 mark again, and continued below 23,500 on Friday. We can see a positive candlestick chart pattern again. The market formed bullish harami on Friday. It is a pattern in which a large black candlestick is followed by a smaller white candlestick with body located within the body of a preceding day. Since then, it continued higher. However, the blue-chip index remains within its last week's Thursday's bearish trading range:
Concluding, the S&P 500 index extended its short-term fluctuations yesterday, as it gained 0.3%. The broad stock market remained within Monday's daily trading range, with considerably lower volatility. Is this a new uptrend or still just upward correction following last week's move down? The broad stock market was retracing almost 12% off its late January record high on Friday, before an intraday reversal. Was this some final panic selling ahead of major upward reversal? Tuesday-Wednesday's rally was just "dead cat bouncing" upward correction. On Friday, we wrote that the market may find some short-term support at around its medium-term upward trend line, which was at 2,550. It came true, as the index bounced off support along the level of 2,530-2,550. In the near future, we will probably see some more short-term uncertainty. The market extends the rebound from Friday's low, but it is still below its last Wednesday's local high and resistance level of 2,700-2,750.
The broad stock market retraced its whole month-long January rally and continued lower, the lowest since early October. So, medium-term picture is now bearish. Investors took profits off the table following the unprecedented month-long rally, but then they began selling in panic. It was quite similar to 2010 Flash Crash event. Is this just downward correction or the beginning of a new medium-term downtrend? This sell-off set the negative tone for weeks or months to come.
The S&P 500 index traded around 7.5% above its December 29 yearly closing price on Friday January 26. This almost month-long rally seemed unprecedented. The legendary investor John Templeton once said that "bull markets are born on pessimism, grow on skepticism, mature on optimism and die on euphoria”. So, now it looks like it was an euphoria phase of the nine-year-long bull market. Did it die over a week ago? It's hard to say, but new record highs scenario seems very unlikely now.
Currently, we prefer to be out of the market, avoiding low risk/reward ratio medium-term trades. We will let you know when we think it is safe to get back in the market.
To summarize: no medium-term positions are justified from the risk/reward perspective at this moment.
Intraday trade:
No intraday position is justified from the risk/reward perspective today.
No medium-term position is justified from the risk/reward perspective at this moment.
Thank you.
Paul Rejczak
Stock Trading Strategist
Stock Trading Alerts

