

Trading position (short-term, our opinion; levels for S&P 500 continuous futures contract): short positions with an entry at 4,435 price level, with a stop-loss level of 4,550 and 4,200 as a price target.
The S&P 500 index remained above 4,400 level on Friday. Will it get back to its early September record high? Or was it just a short-term upward correction?
The S&P 500 index fell the lowest since July 20 on Monday a week ago, as it reached the local low of 4,305.91. It was 239.9 points or 5.28% below the September 2 record high of 4,545.85. Since Tuesday it has been bouncing and on Thursday it reached a local high of 4,465.40.
The nearest important support level of the broad stock market index is now at 4,400-4,430, marked by last Monday’s daily gap down of 4,402.95-4,427.76. On the other hand, the nearest important resistance level is now at 4,470-4,500. The S&P 500 broke below its over four-month-long upward trend line, as we can see on the daily chart (chart by courtesy of http://stockcharts.com):
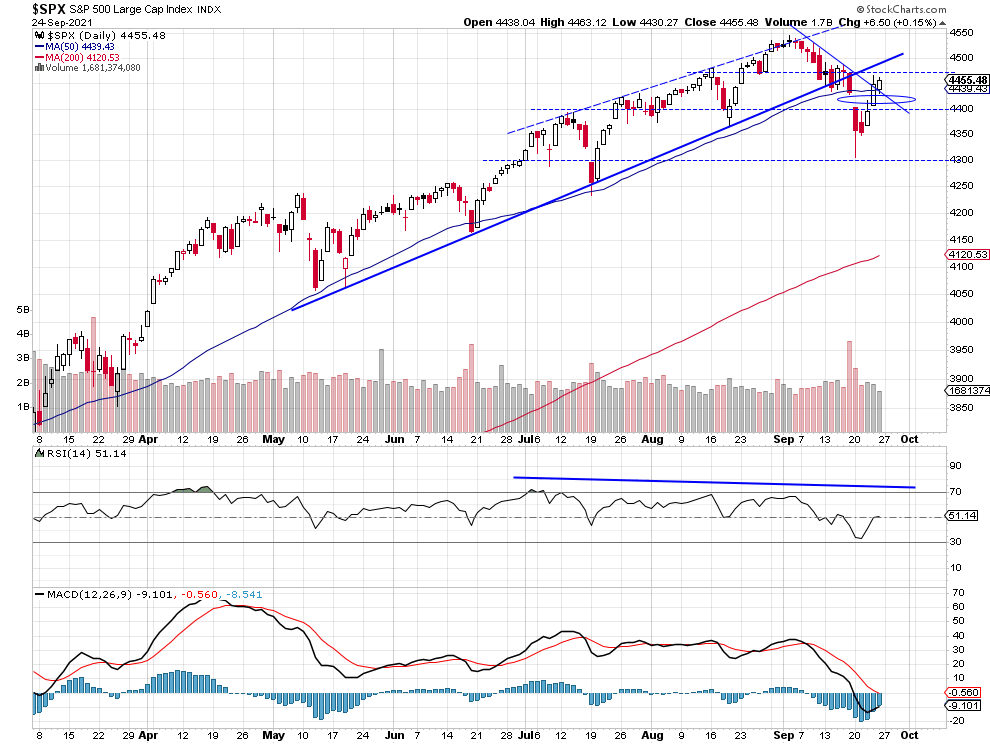
S&P 500 Index Bounced From 4,300 Support Level
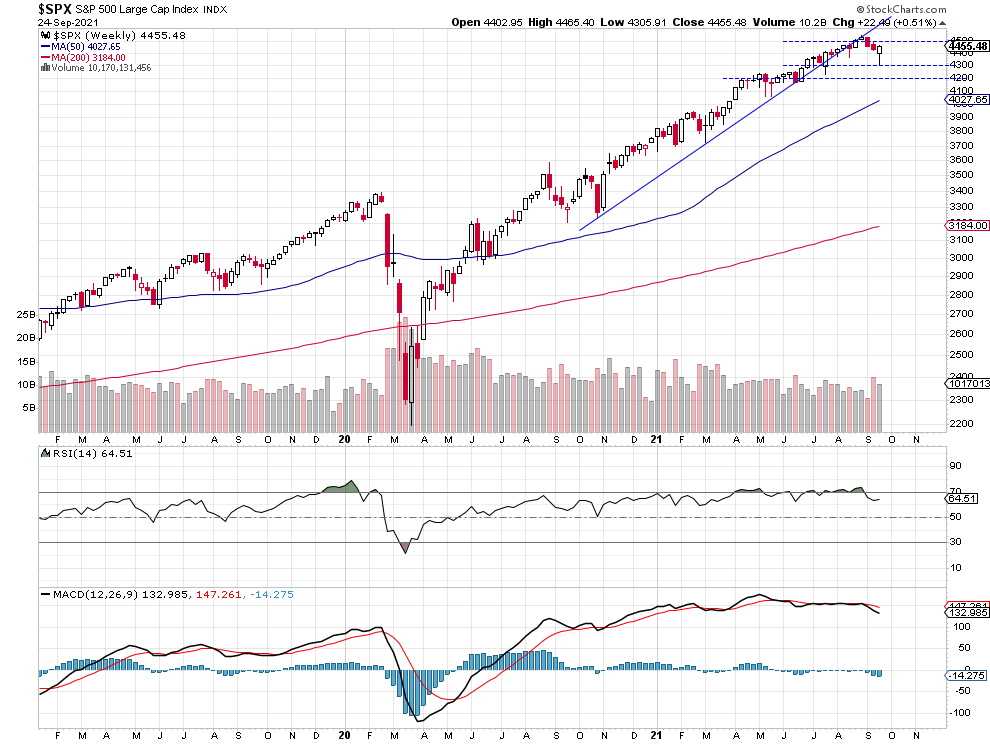
The S&P 500 index broke below its medium-term upward trend line a few weeks ago. On Monday it fell to the 4,300 level. In the following days it has been bouncing from that support level, as we can see on the weekly chart:
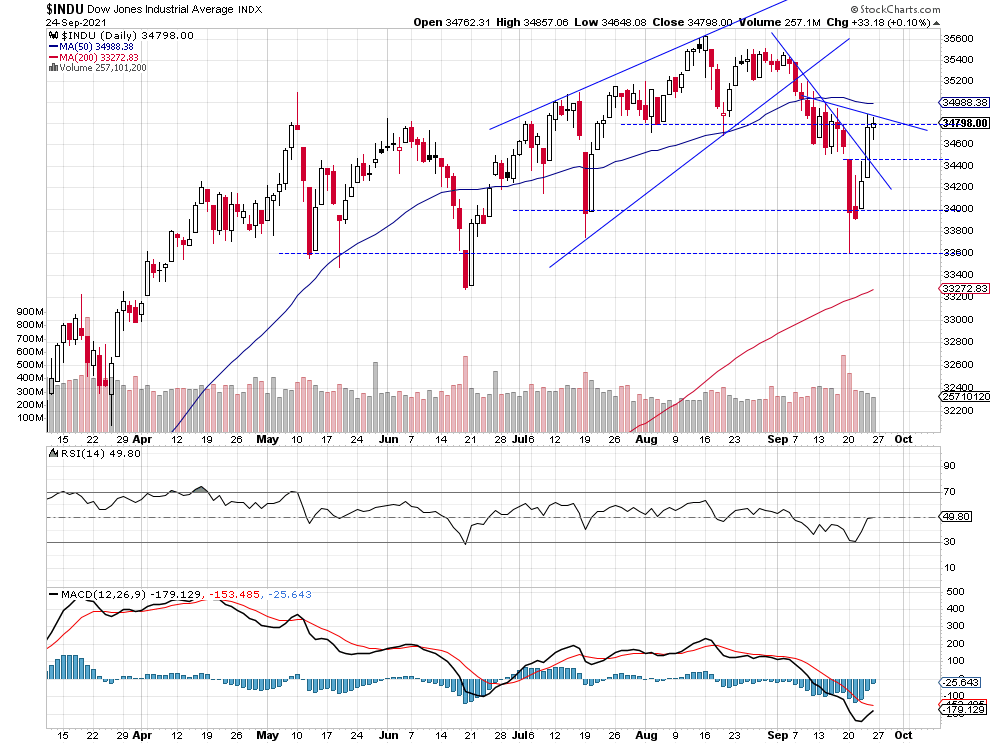
Dow Jones Broke Above Downward Trend Line
Let’s take a look at the Dow Jones Industrial Average chart. In early September the blue-chip index broke below a two-month-long rising wedge downward reversal pattern. Last week it has bounced from the 33,600 price level. On Thursday it broke above the short-term downward trend line. The nearest important resistance level is now at 34,800-35,000 and the support level is at around 34,400, as we can see on the daily chart:
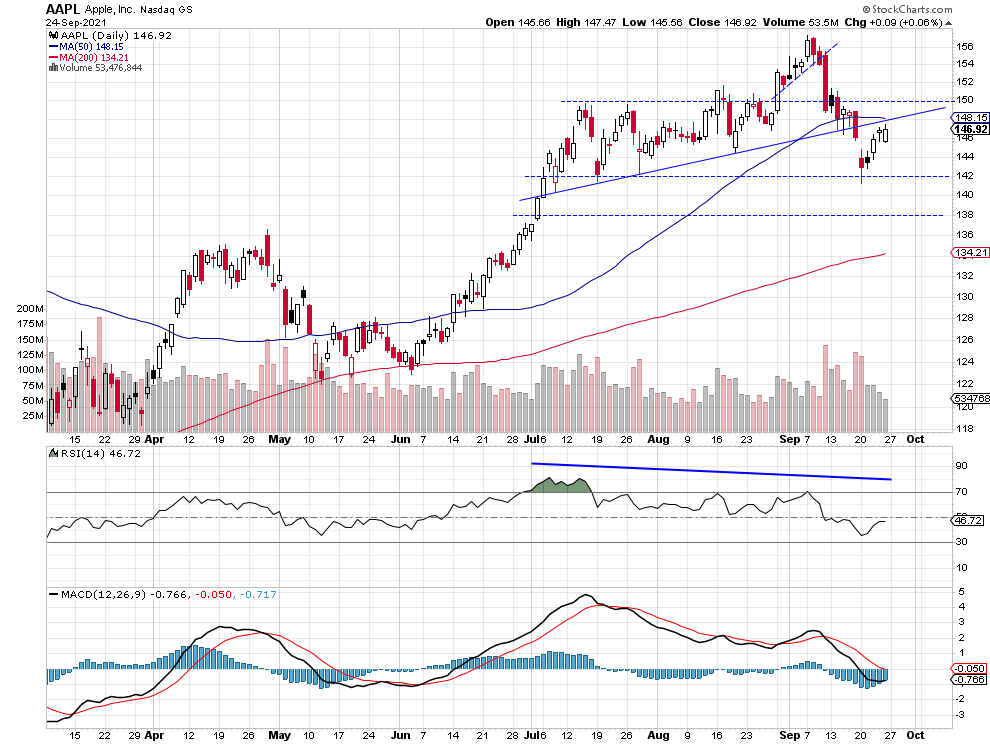
Apple Got Back to Broken Trend Line
Apple stock weighs around 6.3% in the S&P 500 index, so it is important for the whole broad stock market picture. In early September it reached a new record high of $157.26. And since then it has been declining. So it looked like a bull trap trading action. On Monday a week ago the stock sold off to the previous local lows along $142 price level. They act as a support level. And the stock bounced to around $147 and to the broken upward trend line.
Our Short Position
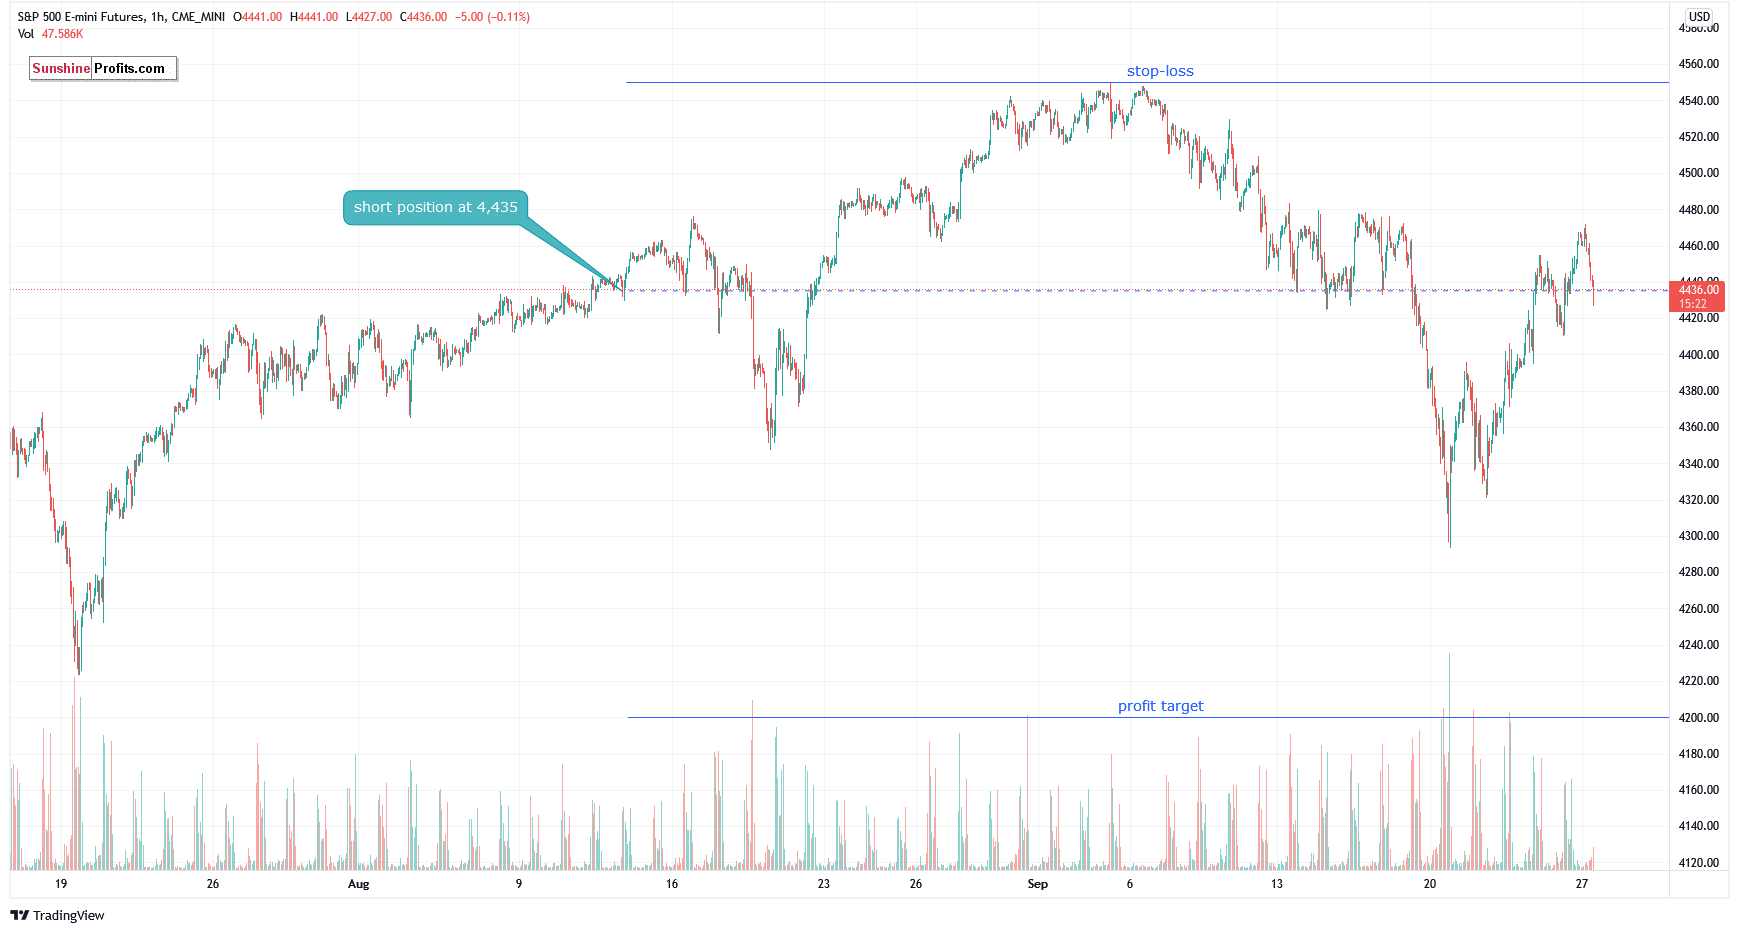
Let’s take a look at the hourly chart of the S&P 500 futures contract. We opened a short position on August 12 at the level of 4,435. We still think that a speculative short position is justified from the risk/reward perspective. (chart by courtesy of http://tradingview.com):
Conclusion
Since last Tuesday we’ve witnessed a short-covering rally fueled by the Wednesday’s FOMC Monetary Policy release. Most likely it’s just an upward correction within a downtrend. The S&P 500 index got back to the mid-September short-term consolidation and it may act as a short-term resistance level.
There have been no confirmed positive signals so far. Therefore, we think that the short position is justified from the risk/reward perspective.
Here’s the breakdown:
- The market accelerated its downtrend a week ago, as the S&P 500 index got close to 4,300 level.
- Our speculative short position is still justified from the risk/reward perspective.
- We are expecting some more downward pressure and a correction to 4,200-4,250 level.
As always, we’ll keep you, our subscribers, well-informed.
Trading position (short-term, our opinion; levels for S&P 500 continuous futures contract): short positions with an entry at 4,435 price level, with a stop-loss level of 4,550 and 4,200 as a price target.
Thank you.
Paul Rejczak,
Stock Trading Strategist
Sunshine Profits: Effective Investments through Diligence and Care

