

Briefly:
Intraday trade: Our Friday's intraday trading outlook was neutral. It proved wrong because the S&P 500 index gained 0.4% following a neutral opening. The index may retrace some of its recent rally today following slightly higher opening of the trading session. There have been no confirmed negative signals so far. However, we can see some short-term overbought conditions. Therefore, intraday short position is favored. Stop-loss is at the level of 2,530 and potential profit target is at 2,505 (S&P 500 index).
Medium-term trade: In our opinion, short position is favored (opened on June 5 at 2,437.83, with stop-loss at 2,530, and profit target at 2,300, S&P 500 index).
Our intraday outlook is bearish today, and our short-term outlook is bearish, as we expect downward correction. Our medium-term outlook remains bearish:
Intraday outlook (next 24 hours): bearish
Short-term outlook (next 1-2 weeks): bearish
Medium-term outlook (next 1-3 months): bearish
The U.S. stock market indexes gained between 0.1% and 0.7% on Friday, extending their short-term uptrend, as investors' sentiment remained bullish following economic data releases, tax cut plan announcement. The S&P 500 index has reached new record high at the level of 2,519.44, around 7 points above its last Wednesday's high. The Dow Jones Industrial Average got closer to the September 21 record high of 22,419.51. The technology Nasdaq Composite gained 0.7%, as it was relatively stronger than the broad stock market. It reached new all-time high at the level of 6,497.98. The nearest important level of resistance of the S&P 500 index is at around 2,520-2,530, marked by new record high, among others. On the other hand, support level is at 2,510, marked by previous level of resistance. The next support level remains at 2,490, marked by the September 12 daily gap up of 2,488.95-2,490.37, among others. The support level is also at 2,465-2,475, marked by the September 11 daily gap up of 2,467.11-2,474.52. The S&P 500 index accelerated its uptrend. We still can see medium-term negative technical divergences, but will they lead to a downward correction?
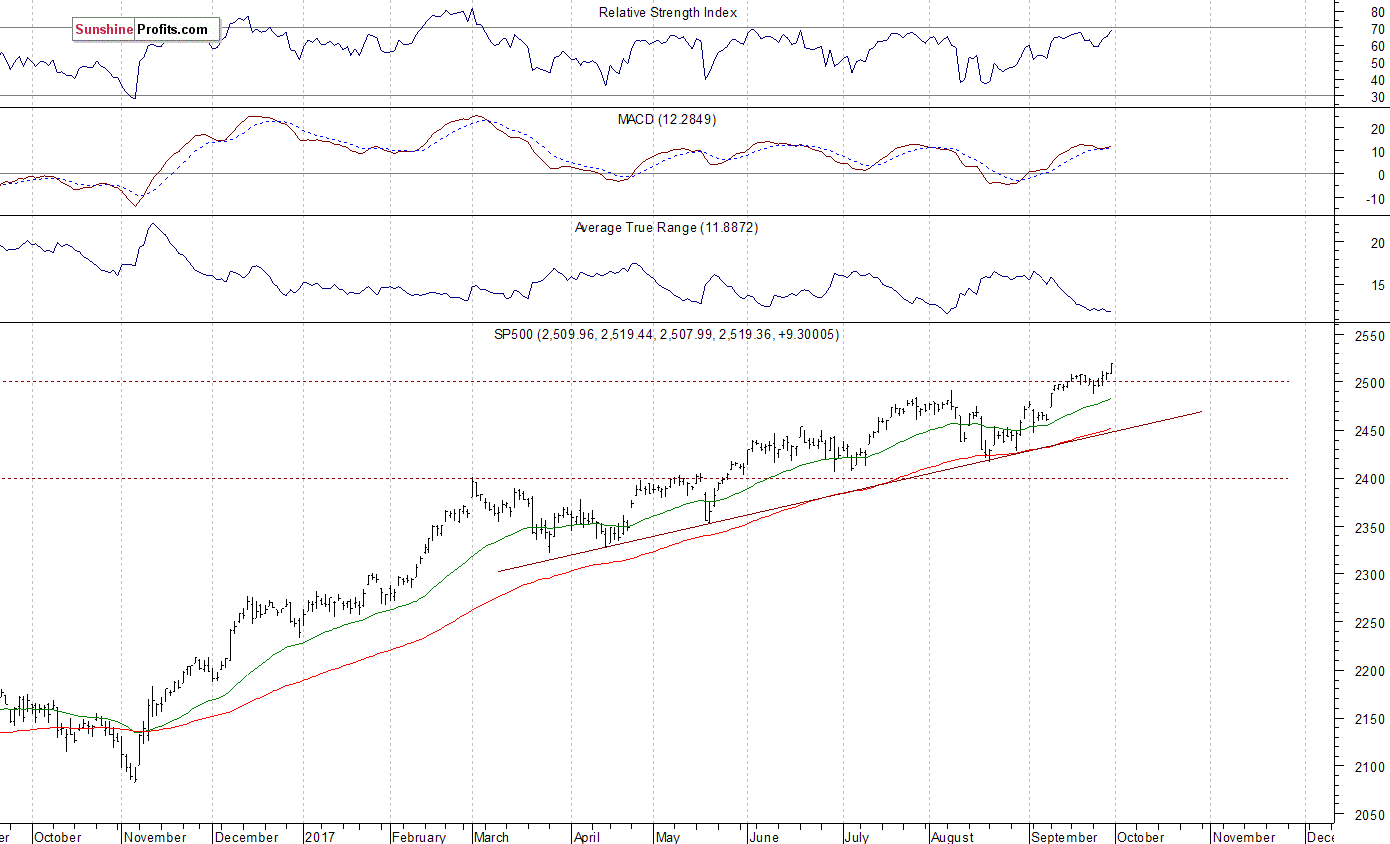
Will Uptrend Accelerate?
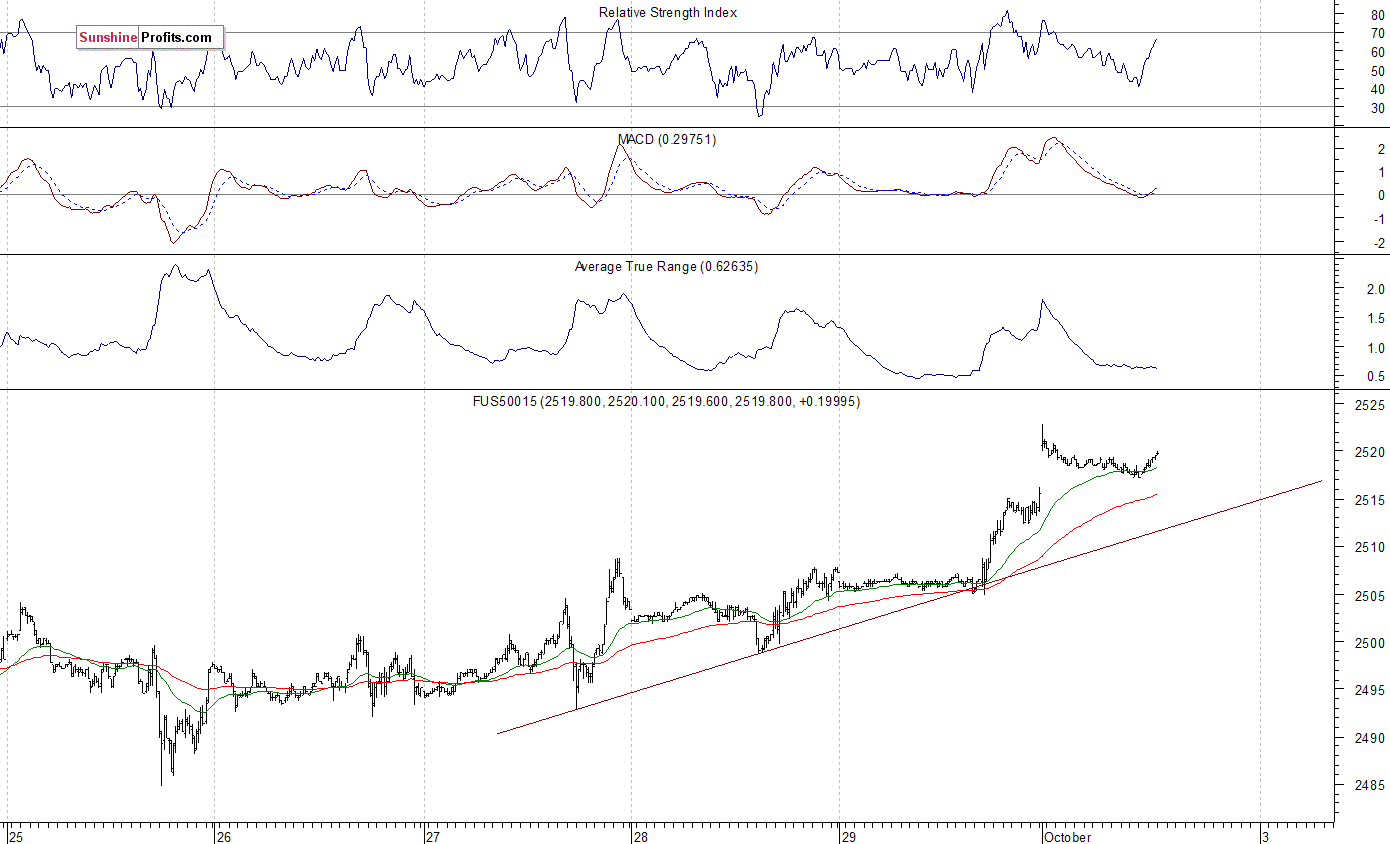
Expectations before the opening of today's trading session are positive, with index futures currently up between 0.2% and 0.3% vs. their Friday's closing prices. The European stock market indexes have gained 0.1-0.5% so far. Investors will now wait for some economic data announcements: ISM Index, Construction Spending at 10:00 a.m. The market expects that the ISM Index was at 57.9 in September. The S&P 500 futures contract trades within an intraday consolidation following overnight move up. The nearest important level of resistance is at around 2,520-2,525, marked by new all-time high. On the other hand, support level is at 2,510-2,515, marked by previous resistance level. The support level is also at around 2,500. The futures contract trades above its short-term upward trend line, as we can see on the 15-minute chart:
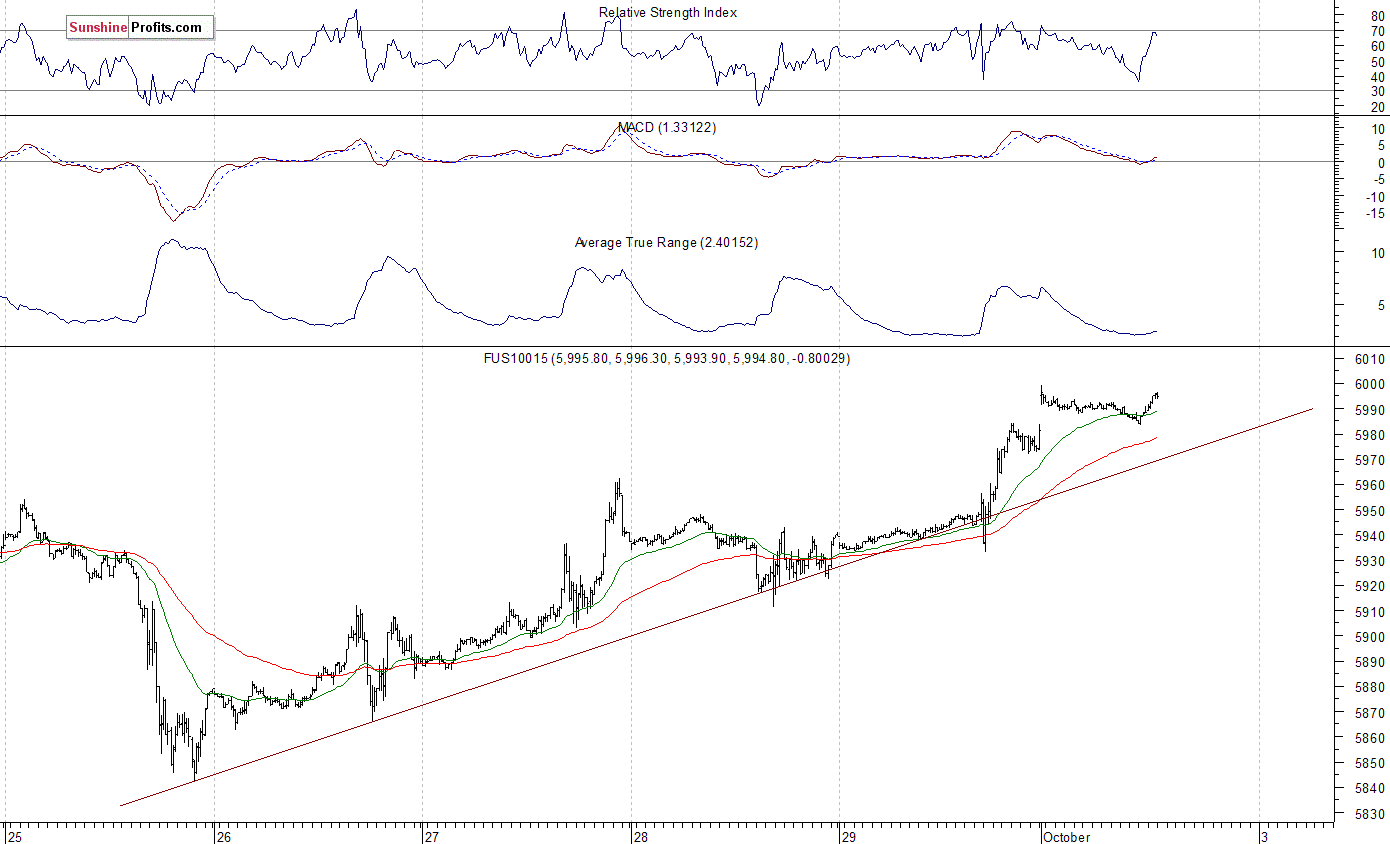
Nasdaq 100 Closer To Record High
The technology Nasdaq 100 futures contract follows a similar path, as it currently trades within an intraday consolidation following overnight move up. The nearest important level of resistance is at around 6,000-6,020, marked by the early September record high. On the other hand, support level is at 5,970, marked by some recent fluctuations. The next level of support remains at 5,930-5,950, marked by previous resistance level. The Nasdaq futures contract trades close to 6,000 mark again, as the 15-minute chart shows:
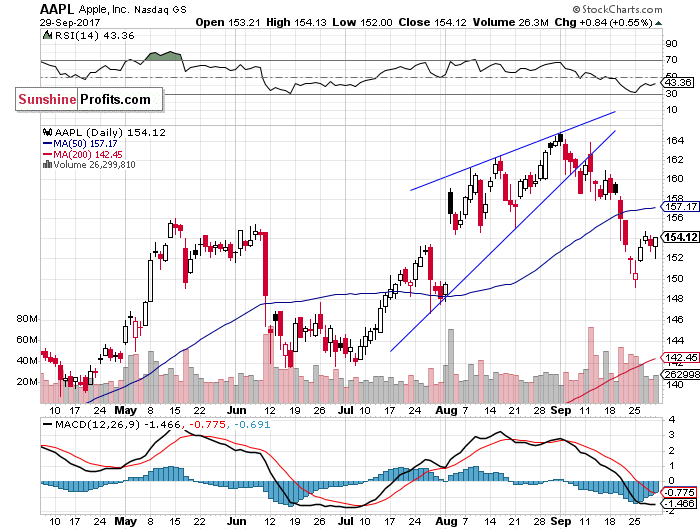
Let's take a look at Apple, Inc. stock (AAPL) daily chart (chart courtesy of http://stockcharts.com). It rebounded following recent decline. However, it is still relatively weaker than the record-breaking broad stock market gauges. The price bounced off support level at around $150 a week ago. Is this a new uptrend? Or just upward correction before another leg lower? There have been no confirmed positive signals so far. The price continues to trade below short-term resistance level of $155, marked by some previous local lows:
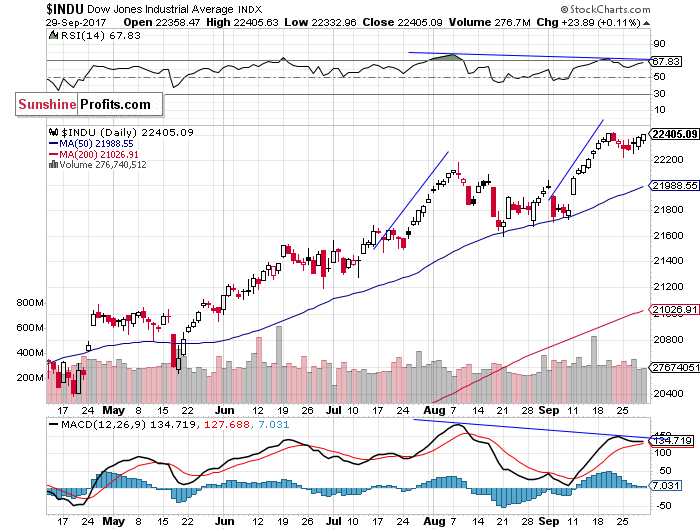
Now, let's take a look at the Dow Jones Industrial Average daily chart (chart courtesy of http://stockcharts.com) again. The blue-chip index continues to fluctuate after its recent advance. It remains close to record high. However, we can see some negative technical divergences. Is this a topping pattern or just pause before another leg higher?
Concluding, the S&P 500 index extended its uptrend on Friday, as it gained 0.4%. The broad stock market has reached new record high. Investors' sentiment remains bullish ahead of quarterly corporate earnings releases. But will uptrend continue even further? We still can see medium-term overbought conditions along with negative technical divergences.
We continue to maintain our medium-term short position (opened at 2,437.83 on June 5 - opening price of the S&P 500 index). We decided to move our stop-loss level up for the first time on Thursday, to the level of 2,530 (from 2,510). This will be the final stop-loss for this trade. Potential profit target remains at 2,300 (S&P 500 index). One can trade S&P 500 index using futures contracts (S&P 500 futures contract - SP, E-mini S&P 500 futures contract - ES) or an ETF like the SPDR S&P 500 ETF - SPY. It is always important to set some exit price level in case some events cause the price to move in the unlikely direction. Having safety measures in place helps limit potential losses while letting the gains grow.
To summarize: medium-term short position in S&P 500 index is justified from the risk/reward perspective with the following entry prices, stop-loss orders and profit target price levels:
Intraday trade:
S&P 500 index - short position: profit target level: 2,505; stop-loss level: 2,530,
S&P 500 futures contract (September) - short position: profit target level: 2,502; stop-loss level: 2,527
SPY ETF (SPDR S&P 500, not leveraged) - short position: profit target level: $250.5; stop-loss level: $253.0
Medium-term trade:
S&P 500 index - short position: profit target level: 2,300; stop-loss level: 2,530
S&P 500 futures contract (December) - short position: profit target level: 2,297; stop-loss level: 2,527
SPY ETF (SPDR S&P 500, not leveraged) - short position: profit target level: $230; stop-loss level: $253
SDS ETF (ProShares UltraShort S&P500, leveraged: -2x) - long position: opening price: $50.24; profit target level: $55.92; stop-loss level: $46.46
Thank you.
Paul Rejczak
Stock Trading Strategist
Stock Trading Alerts

