

Briefly:
Intraday trade: Our Monday's neutral intraday outlook has proved accurate. The S&P 500 index continued to fluctuate within a relatively narrow trading range. The S&P 500 index may continue to fluctuate today. There have been no confirmed positive signals so far. On the other hand, we can see some slight short-term oversold conditions. Therefore, we prefer to be out of the market today, avoiding low risk/reward ratio trades.
Medium-term trade: In our opinion, short position is favored (opened on June 5 at 2,437.83, with stop-loss at 2,510, and profit target at 2,300, S&P 500 index).
Our intraday outlook is neutral, and our short-term outlook is bearish, as we expect downward correction. Our medium-term outlook is bearish:
Intraday outlook (next 24 hours): neutral
Short-term outlook (next 1-2 weeks): bearish
Medium-term outlook (next 1-3 months): bearish
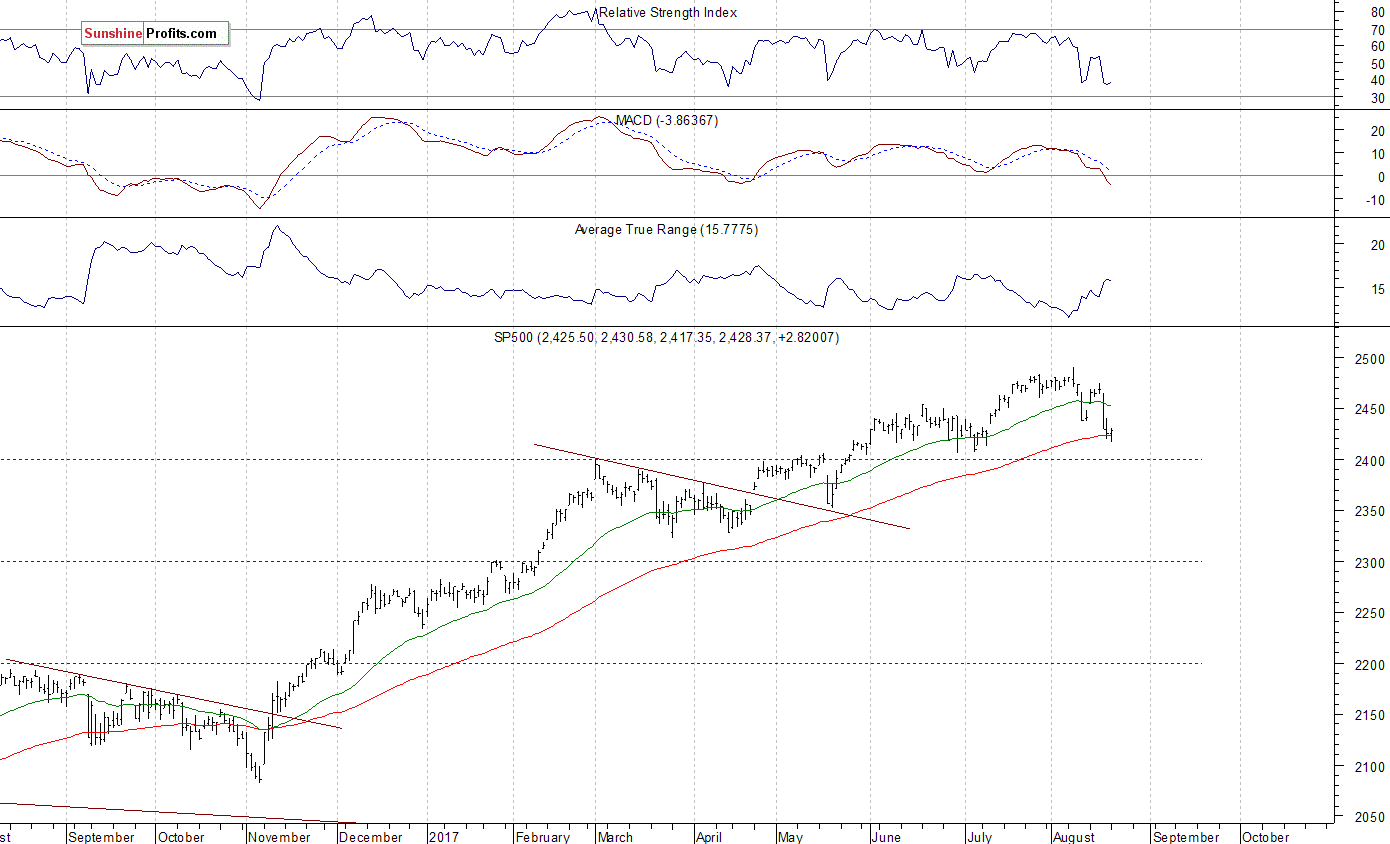
The main U.S. stock market indexes were mixed between -0.1% and +0.1% on Monday, as investors continued to hesitate following Thursday's move down. The S&P 500 index trades around 2.6% below the August 8 all-time high of 2,490.87. Will the downtrend continue? Or is this just quick downward correction before another leg up? The Dow Jones Industrial Average traded along the level of 21,700, and the technology Nasdaq Composite remained close to 6,200 mark, following late July rebound off new record high level at 6,460.8. The nearest important level of resistance of the S&P 500 index is at around 2,435-2,440, marked by recent local lows. The next resistance level is at 2,450, marked by previous level of support. The resistance level is also at 2,465-2,475, marked by previous support level and local highs. On the other hand, support level is at around 2,400-2,420, marked by some previous local lows, among others. The market extended its downward correction following April - August uptrend yesterday, before reversing slightly higher. Will short-term downtrend continue? We still can see negative technical divergences:
Upward Reversal?
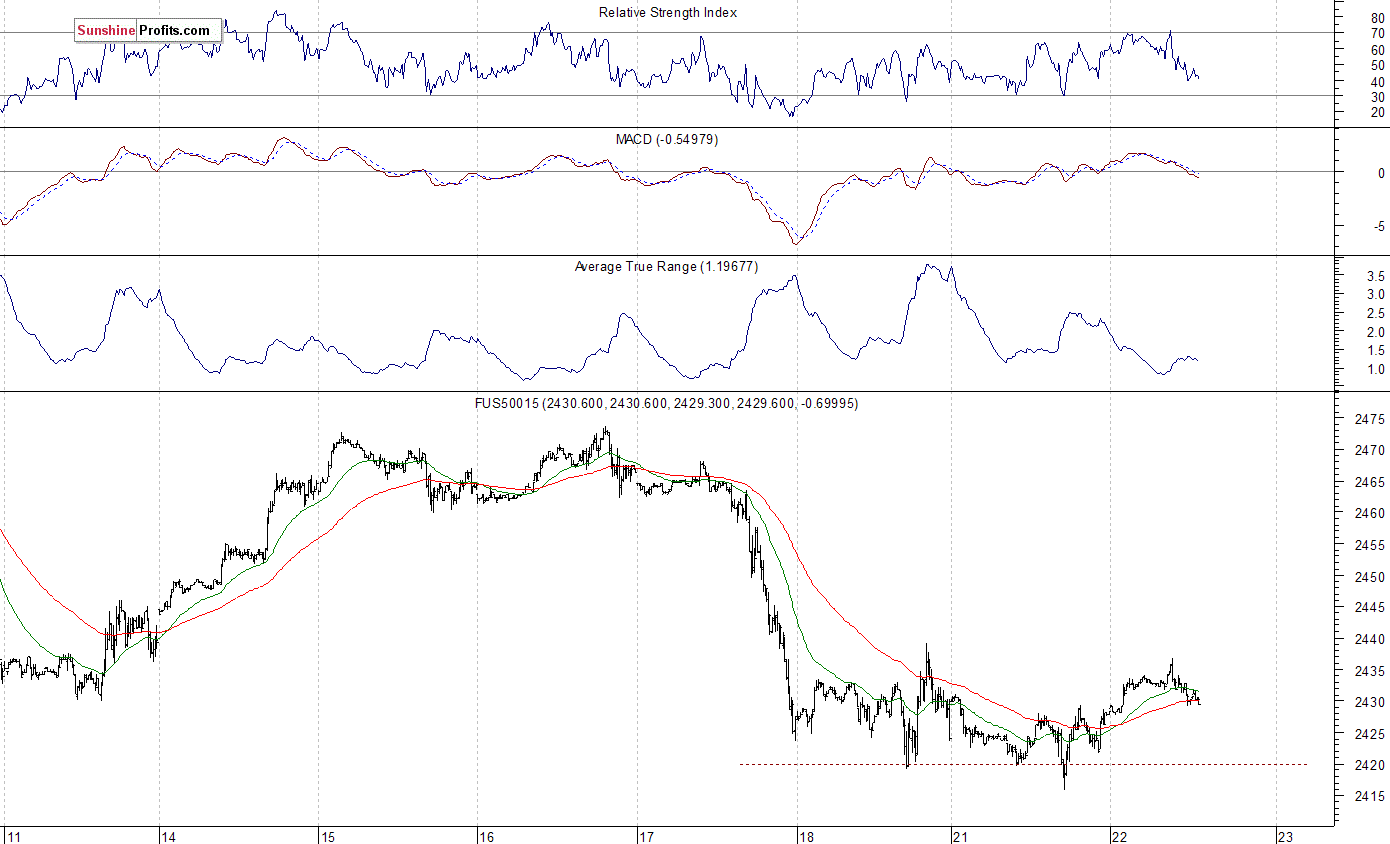
Expectations before the opening of today's trading session are positive, with index futures currently up between +0.1% and +0.3% vs. yesterday's closing prices. The European stock market indexes have gained 0.4-0.7% so far. Investors will now wait for the Richmond Manufacturing Index release at 10:00 a.m. The market expects that it was at 11 in August. The S&P 500 futures contract trades within an intraday consolidation, following an overnight move up. The nearest important level of resistance is at around 2,435-2,440, marked by local highs. The next resistance level remains at 2,450, among others. On the other hand, support level is at 2,415-2,420, marked by recent local lows. Is this a bottoming pattern before upward reversal? The futures contract trades within a short-term consolidation following last Thursday's sell-off, as we can see on the 15-minute chart:
Nasdaq Still Weaker
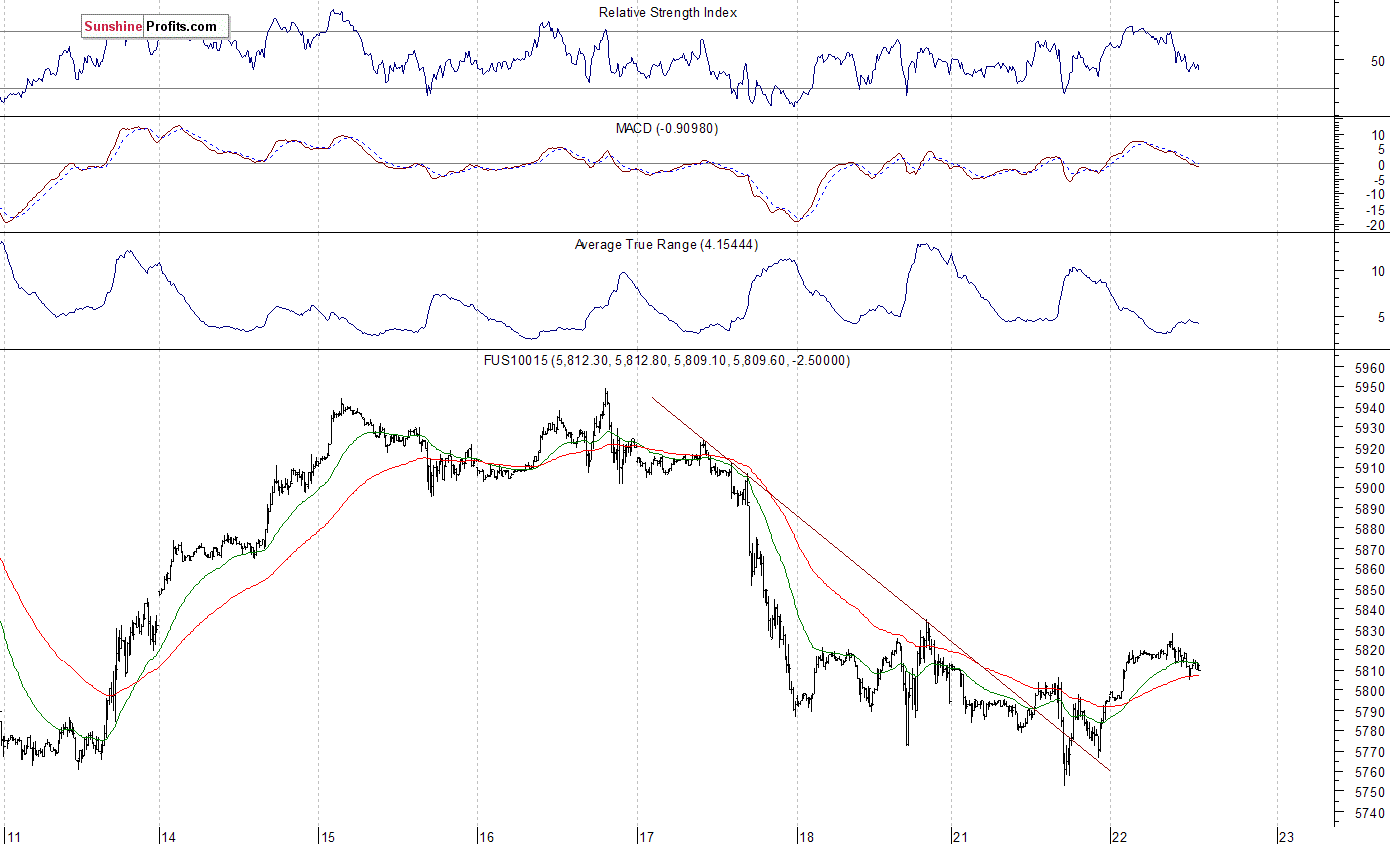
The technology Nasdaq 100 futures contract follows a similar path, as it trades within an intraday consolidation after an overnight rebound off support level. The nearest important level of resistance is at around 5,830, marked by some local highs. On the other hand support level remains at 5,750-5,770, marked by recent local lows. For now, it looks like some relatively flat correction within a short-term downtrend. The Nasdaq futures trades within a consolidation after last week's move down, as the 15-minute chart shows:
Concluding, the S&P 500 index extended its short-term consolidation yesterday, as the broad stock market continued to fluctuate following Thursday's move down. Is this just a flat correction before another leg down or some bottoming pattern? There have been no confirmed positive signals so far. We still can see medium-term overbought conditions along with negative technical divergences.
Intraday trade:
No intraday position is justified from the risk/reward perspective today.
Medium-term trade:
S&P 500 index - short position: profit target level: 2,300; stop-loss level: 2,510
S&P 500 futures contract (September) - short position: profit target level: 2,297; stop-loss level: 2,507
SPY ETF (SPDR S&P 500, not leveraged) - short position: profit target level: $230; stop-loss level: $251
SDS ETF (ProShares UltraShort S&P500, leveraged: -2x) - long position: opening price: $12.56; profit target level: $13.98; stop-loss level: $11.82
Paul Rejczak
Stock Trading Strategist
Stock Trading Alerts

