
Briefly: In our opinion, no speculative positions are justified.
Our intraday outlook is neutral, and our short-term outlook is neutral. Our medium-term outlook remains bearish, as the S&P 500 index extends its lower highs, lower lows sequence. We decided to change our long-term outlook to neutral recently, following a move down below medium-term lows:
Intraday outlook (next 24 hours): neutral
Short-term outlook (next 1-2 weeks): neutral
Medium-term outlook (next 1-3 months): bearish
Long-term outlook (next year): neutral
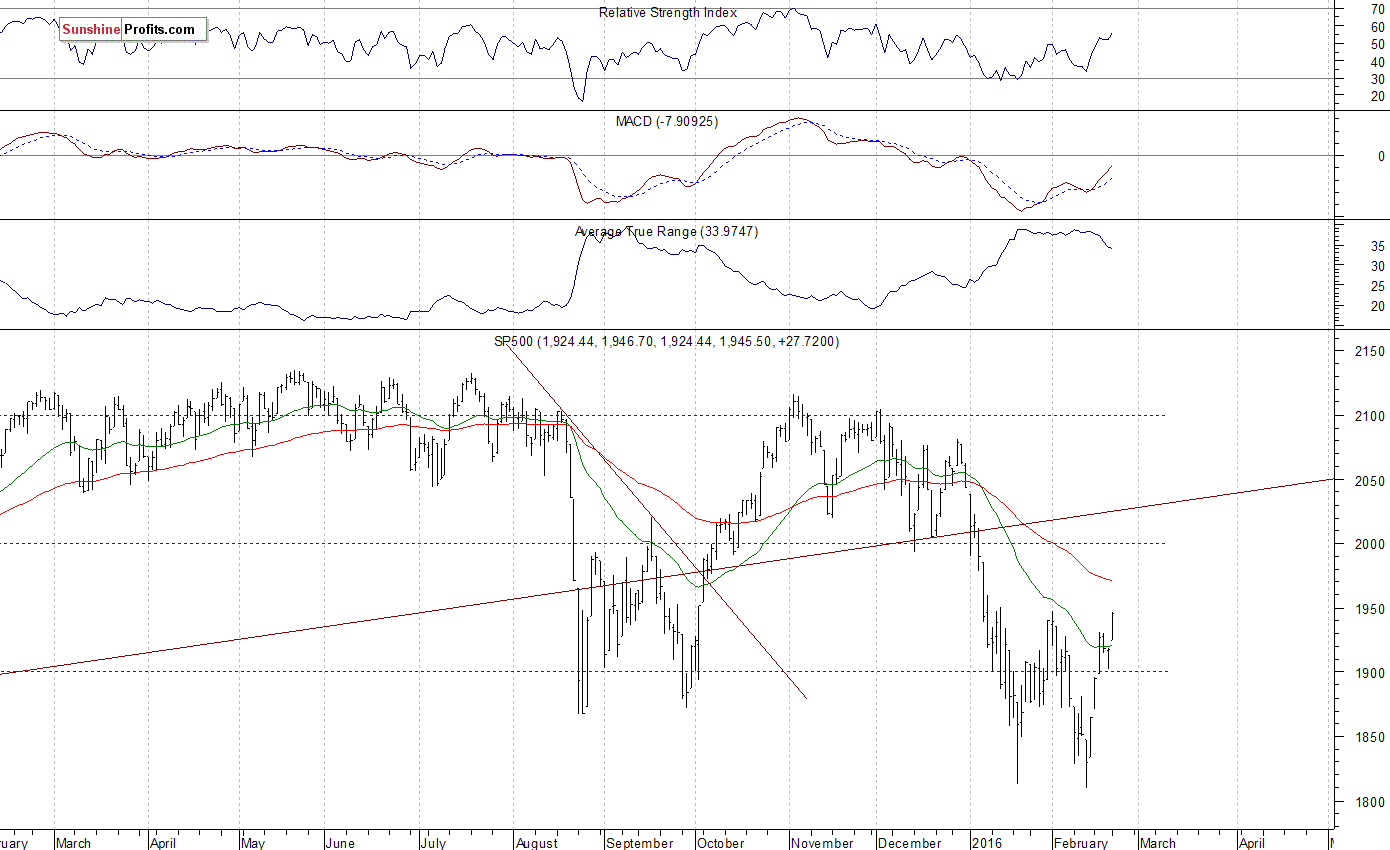
The U.S. stock market indexes lost 1.1%-1.6% on Tuesday, retracing some of their recent move up, as investors took short-term profits off the table, among others. The S&P 500 index bounced off resistance level at around 1,950, marked by its early February local high of 1,947.20. The next important level of resistance is at 1,980-2,000, marked by previous support level. On the other hand, support level is at around 1,920, and the next support level is at around 1,900, marked by last week's Wednesday's daily gap up of 1,895.77-1,898.80. For now, it looks like a consolidation following first half of January sell-off. Will it continue downwards? Or is the bullish downtrend's reversal scenario currently in play? Last year's August - September lows continue to act as medium-term support level, as we can see on the daily chart:
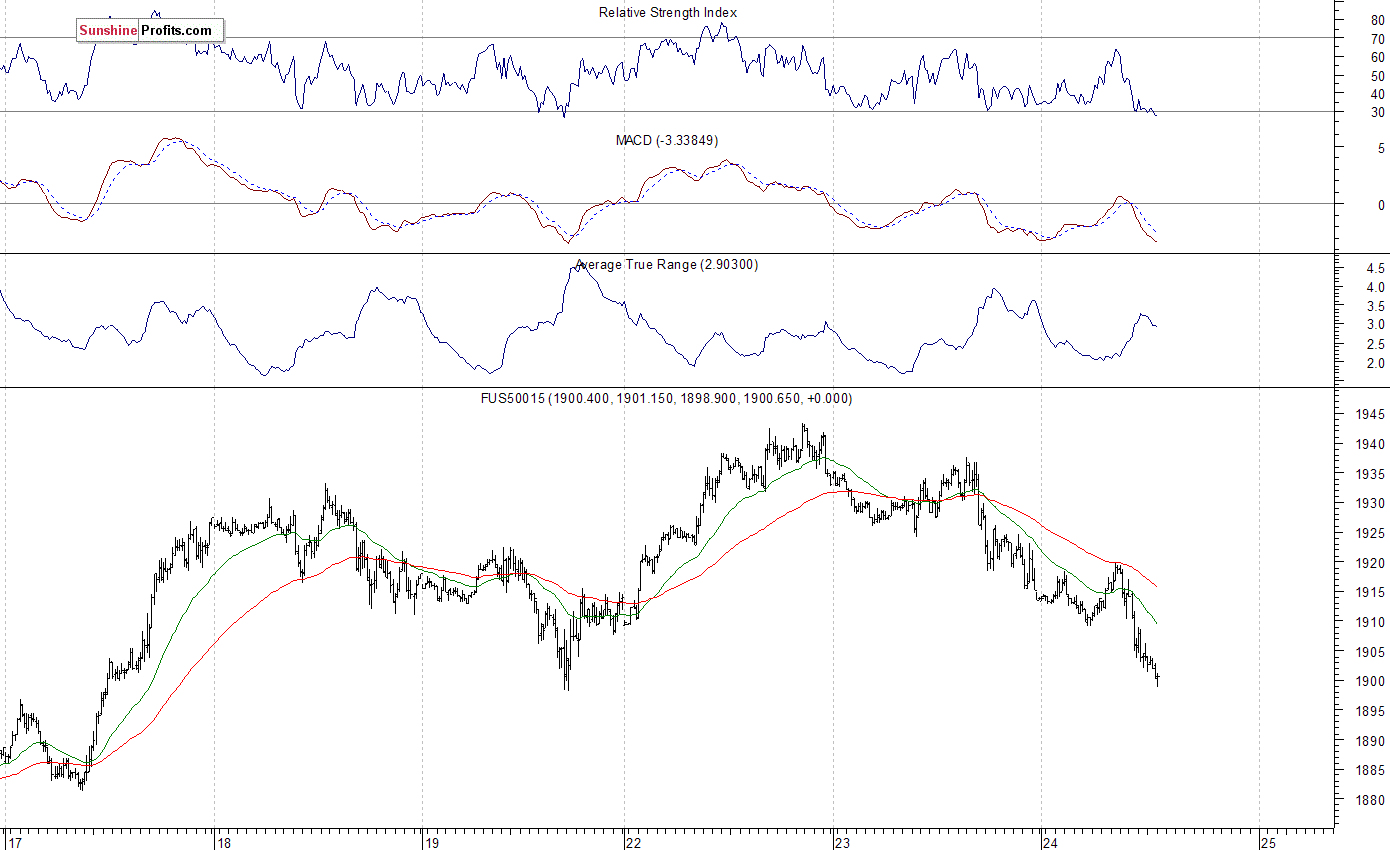
Expectations before the opening of today's trading session are negative, with index futures currently down 0.9-1.2%. The main European stock market indexes have lost 1.6-2.4% so far. Investors will now wait for some economic data announcements: New Home Sales at 10:00 a.m., Crude Inventories at 10:30 a.m. The S&P 500 future contract trades within an intraday downtrend, as it retraces some of its recent advance. The nearest important level of resistance is at around 1,930-1,950, marked by short-term local highs. On the other hand, support level is at 1,890-1,900, among others. There have been no confirmed negative signals so far. The market trades within a short-term consolidation following recent move up. Is this a topping pattern before uptrend's reversal or just flat correction before another leg up?
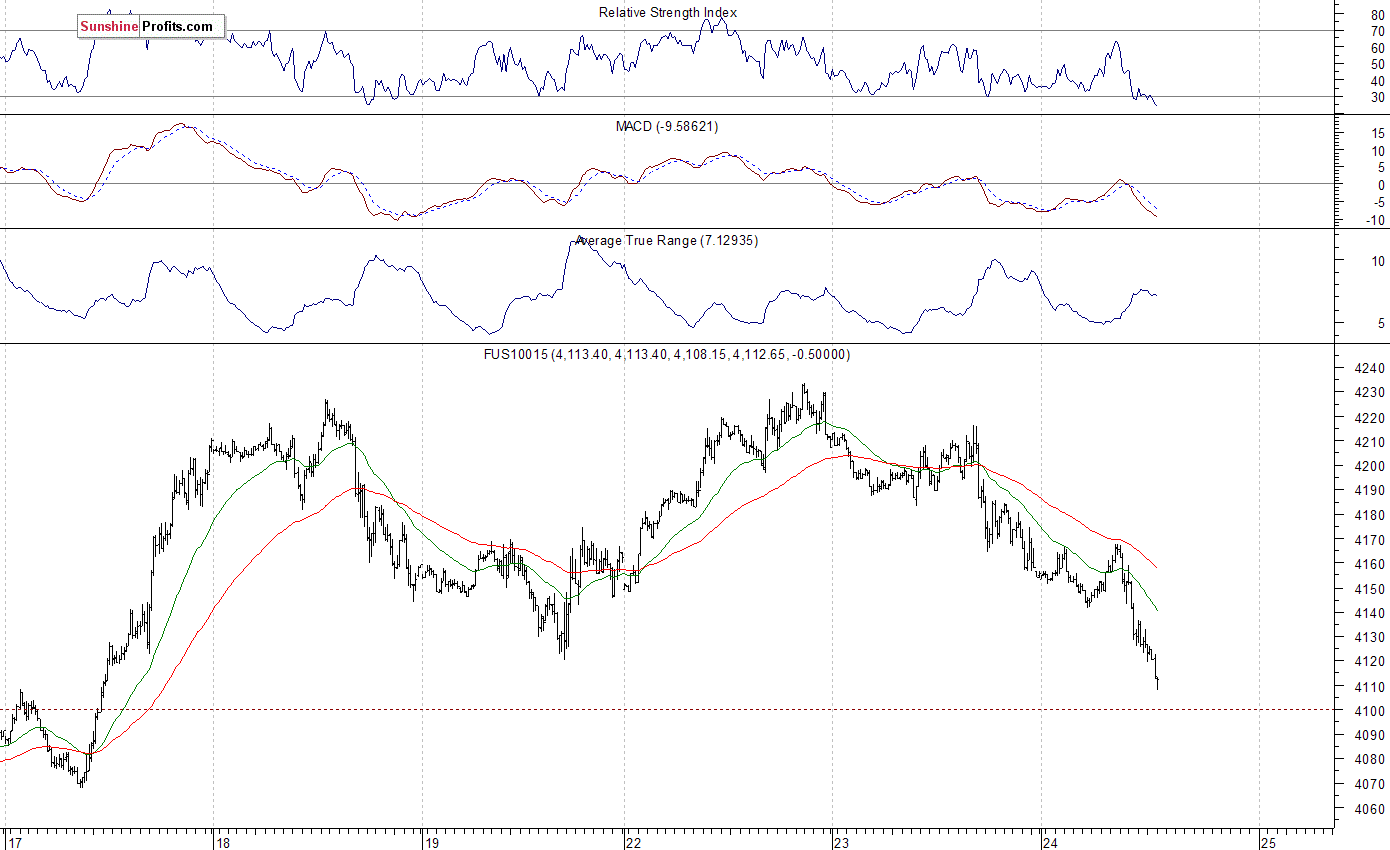
The technology Nasdaq 100 futures contract follows a similar path, as it trades within an intraday downtrend. For now, it looks like a downward correction following recent advance. The nearest important level of resistance remains at around 4,150-4,170, marked by short-term local highs. On the other hand, potential support level is at around 4,080-4,100, marked by previous consolidation, as we can see on the 15-minute chart:
Concluding, the broad stock market extended its short-term fluctuations on Tuesday, as the S&P 500 index remained below its early February local high of 1,947.20. The index extends its consolidation along last year's August - September local lows, as they act as medium-term level of support. There have been no confirmed short-term negative signals so far. However, we can see some short-term overbought conditions. Our speculative long position has been closed at the opening of last week's Thursday's cash market trading session (1,925, Thursday's average opening price of the S&P 500 index). Overall, we gained 90 index points on that trade. Currently, we prefer to be out of the market, avoiding low risk/reward ratio trades. We will let you know when we think it is safe to get back in the market.
Thank you.
Paul Rejczak
Stock Trading Strategist
Stock Trading Alerts

