
Briefly: In our opinion, speculative short positions are favored (with stop-loss at 2,140, and profit target at 2,000, S&P 500 index).
Our intraday outlook is bearish, and our short-term outlook is bearish. Our medium-term outlook remains bearish, as the S&P 500 index extends its lower highs, lower lows sequence:
Intraday outlook (next 24 hours): bearish
Short-term outlook (next 1-2 weeks): bearish
Medium-term outlook (next 1-3 months): bearish
Long-term outlook (next year): neutral
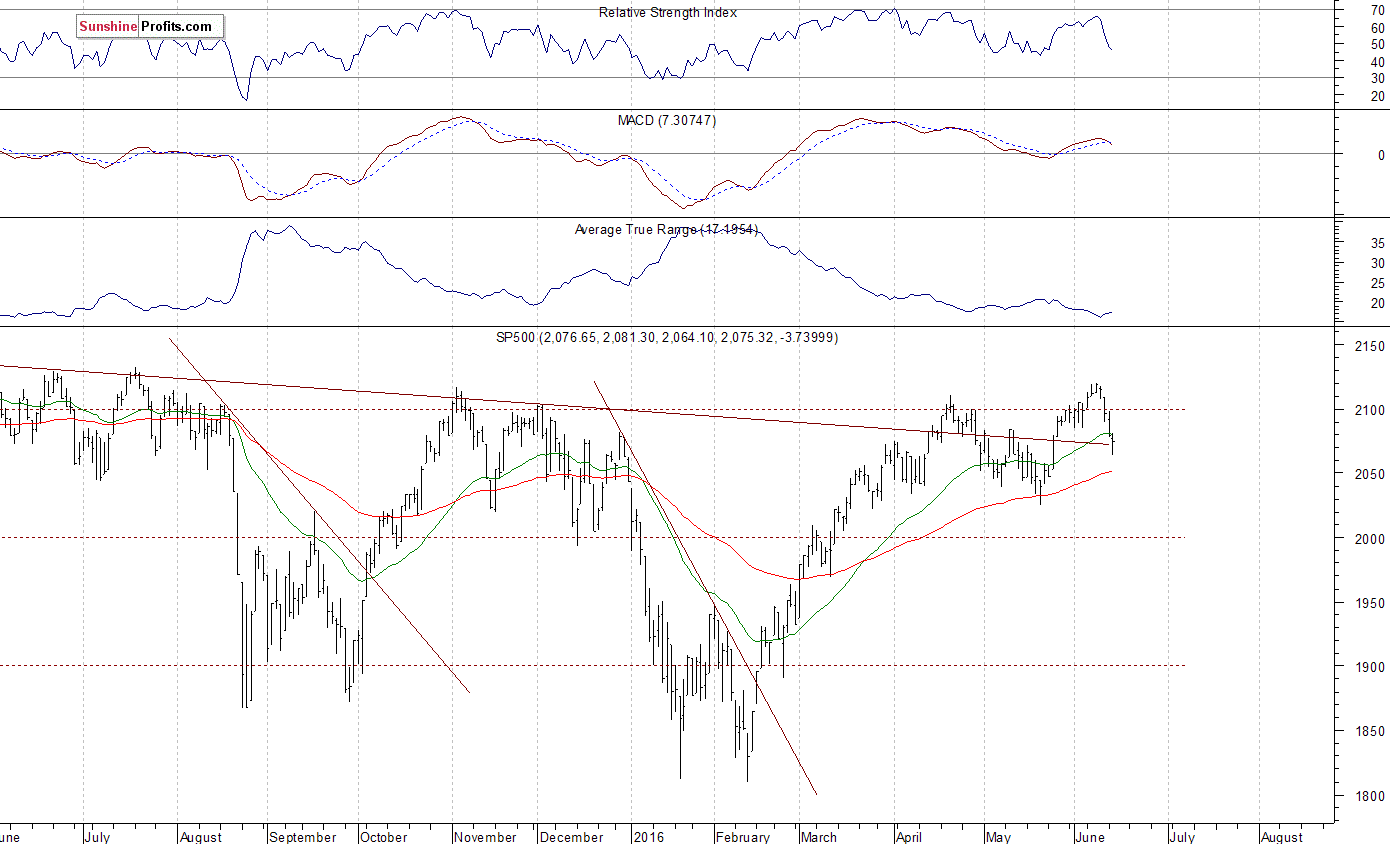
The main U.S. stock market indexes were mixed between -0.3% and +0.1% on Tuesday, as investors hesitated following recent decline. The S&P 500 index extended its short-term downtrend, as it got closer to May consolidation. The nearest important level of support is at around 2,070, and the next support level is at 2,050, marked by some previous local highs. On the other hand, the nearest important level of resistance is at around 2,085, marked by previous support level. The next resistance level remains at 2,100 mark. Last year's highs along the level of 2,100 continue to act as medium-term resistance level. Will the market break above these medium-term highs and continue its seven-year long bull market? Or will it reverse its over three-month long uptrend off medium-term support level at around 1,800?
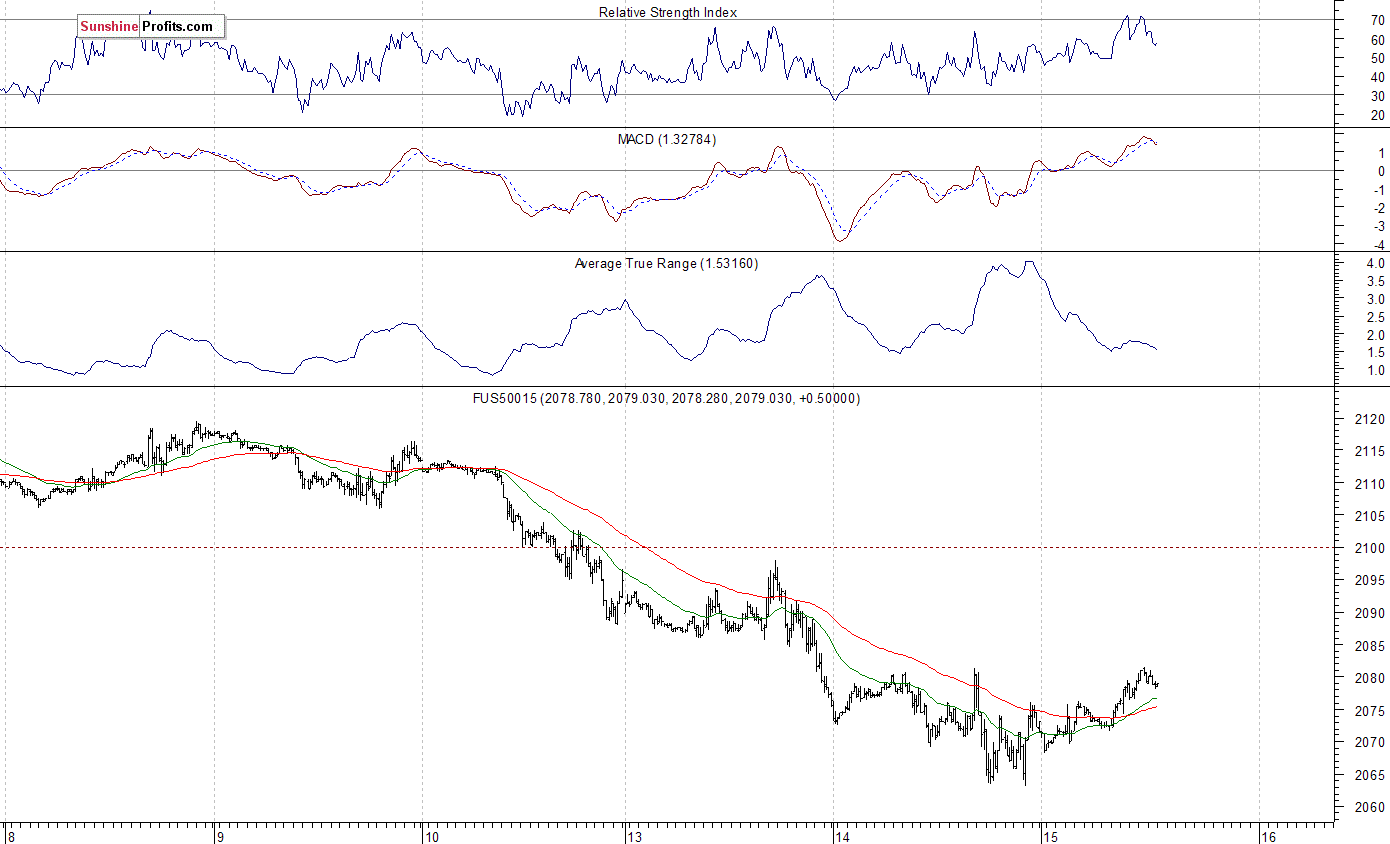
Expectations before the opening of today's trading session are positive, with index futures currently up 0.2-0.3%. The European stock market indexes have gained 0.9-1.3% so far. Investors will now wait for series of economic data announcements: Producer Price Index, Empire Manufacturing at 8:30 a.m., Industrial Production, Capacity Utilization at 9:15 a.m., Crude Inventories at 10:30 a.m., and finally - the FOMC Rate Decision release at 2:00 p.m. The S&P 500 futures contract trades within an intraday uptrend, as it retraces some of its recent move down. The nearest important level of resistance is at around 2,080-2,085, marked by short-term local highs. On the other hand, support level is at 2,060-2,065, marked by yesterday's local lows. For now, it looks like a relatively flat correction following a downtrend:
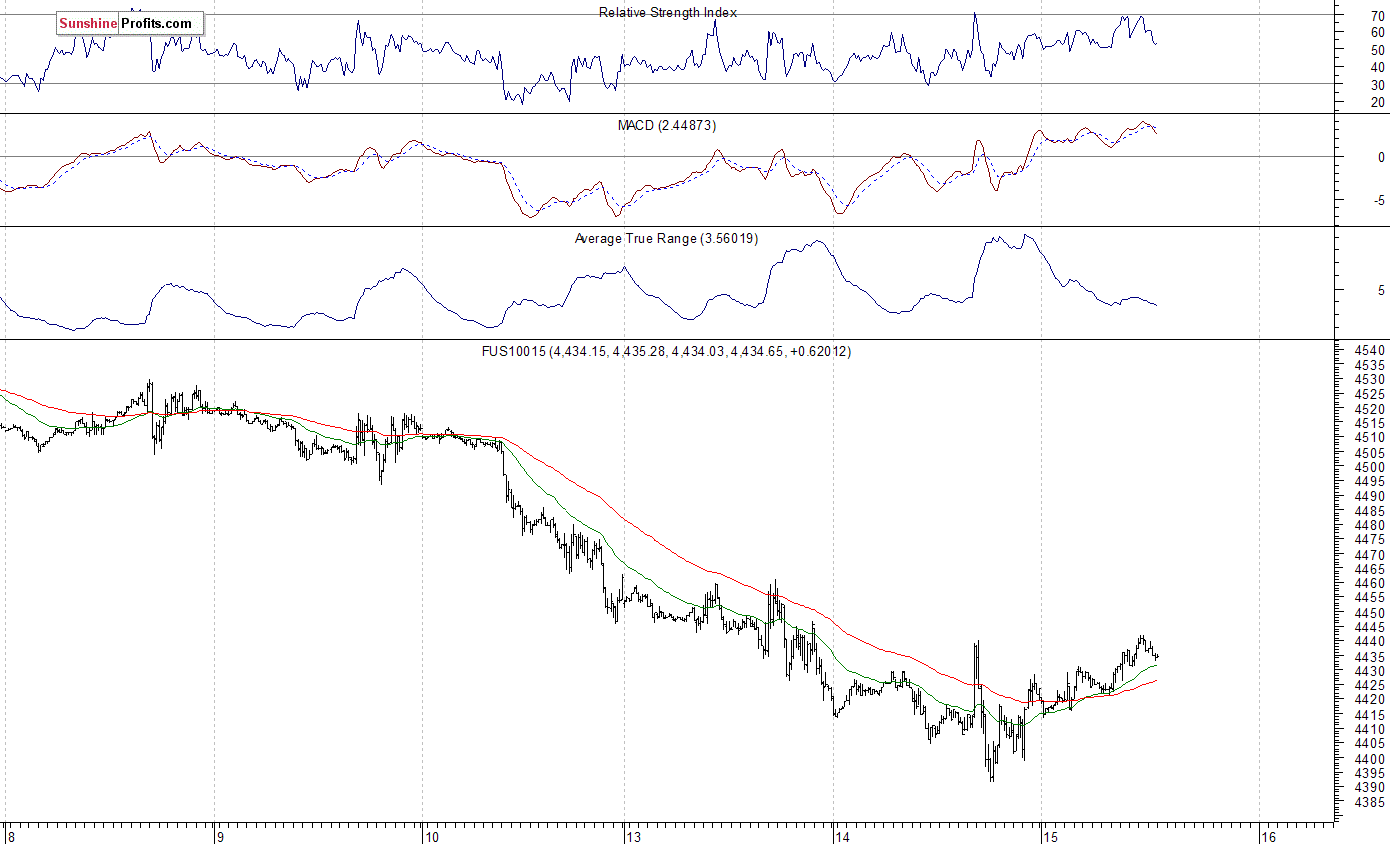
The technology Nasdaq 100 futures contract retraced some of its recent move down, as it bounced off support level at around 4,400. The nearest important level of resistance is at around 4,440-4,450, marked by some short-term local highs. Is this a downtrend reversal or just an upward correction before another leg lower?
Concluding, the broad stock market extended its short-term downtrend on Tuesday, as the S&P 500 index got close to the level of 2,065, before bouncing off slightly. We continue to maintain our speculative short position (opened on June 1 at 2,093.94 - S&P 500 index). Stop-loss level is at 2,140 and potential profit target is at 2,000 (S&P 500 index). You can trade S&P 500 index using futures contracts (S&P 500 futures contract - SP, E-mini S&P 500 futures contract - ES) or an ETF like the SPDR S&P 500 ETF - SPY. It is always important to set some exit price level in case some events cause the price to move in the unlikely direction. Having safety measures in place helps limit potential losses while letting the gains grow.
Thank you.
Paul Rejczak
Stock Trading Strategist
Stock Trading Alerts

