
Briefly: In our opinion, no speculative positions are justified.
Our intraday outlook is neutral, and our short-term outlook is neutral. Our medium-term outlook remains bearish, as the S&P 500 index extends its lower highs, lower lows sequence. We decided to change our long-term outlook to neutral recently, following a move down below medium-term lows:
Intraday outlook (next 24 hours): neutral
Short-term outlook (next 1-2 weeks): neutral
Medium-term outlook (next 1-3 months): bearish
Long-term outlook (next year): neutral
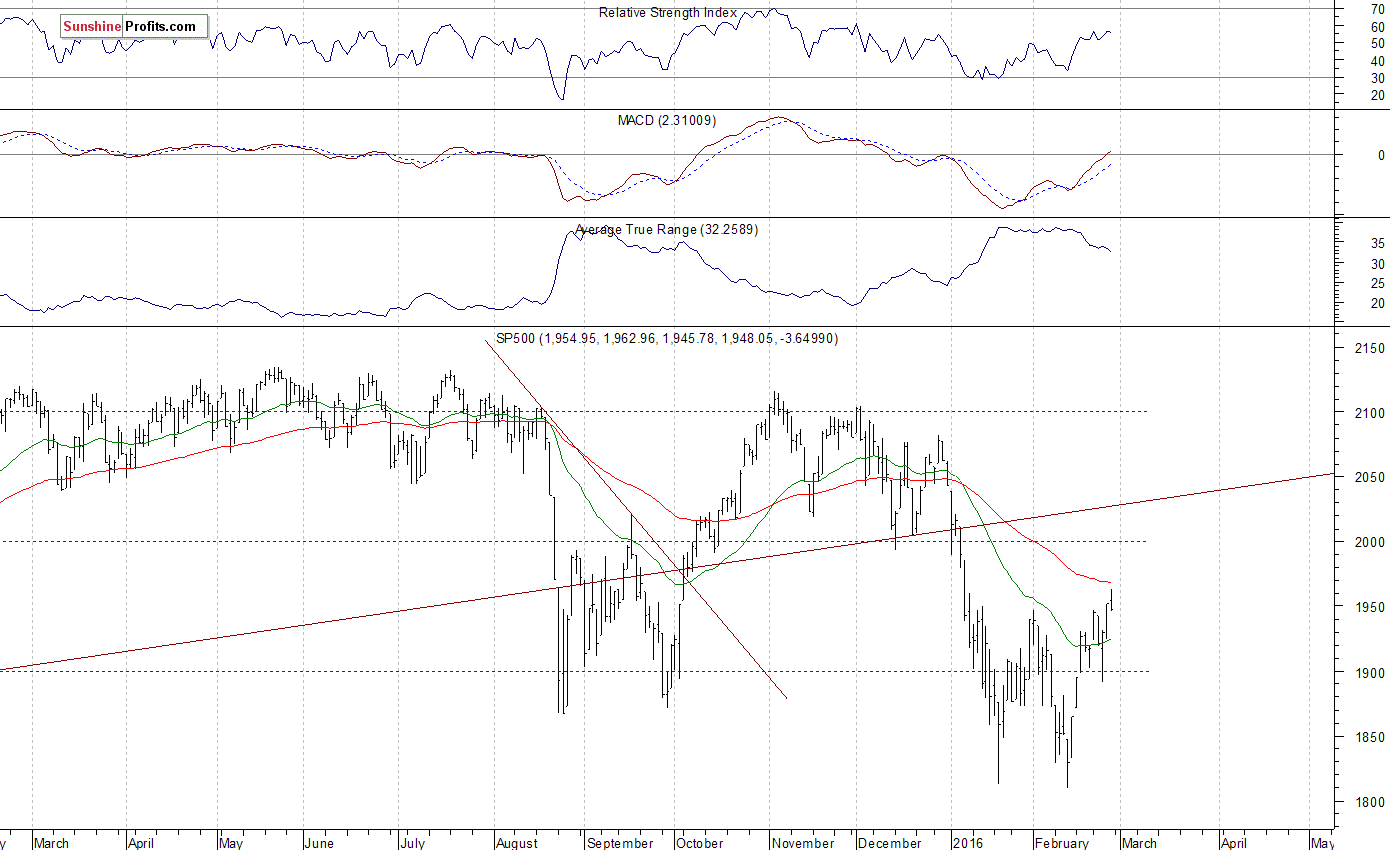
The U.S. stock market indexes lost 0.1-0.3% on Friday, extending their short-term uncertainty, as investors reacted to economic data releases, oil prices fluctuations. However, the S&P 500 index continued its recent move up, as it broke above the early February local high of 1,947.20. The nearest important level of resistance remains at around 1,950-1,960, and the next resistance level is at 1,980-2,000, marked by previous consolidation, among others. On the other hand, support level is at 1,900-1,920, marked by recent consolidation. There have been no confirmed negative signals so far. For now, it looks like an upward correction following January sell-off. Last year's August - September lows continue to act as medium-term support level, as we can see on the daily chart:
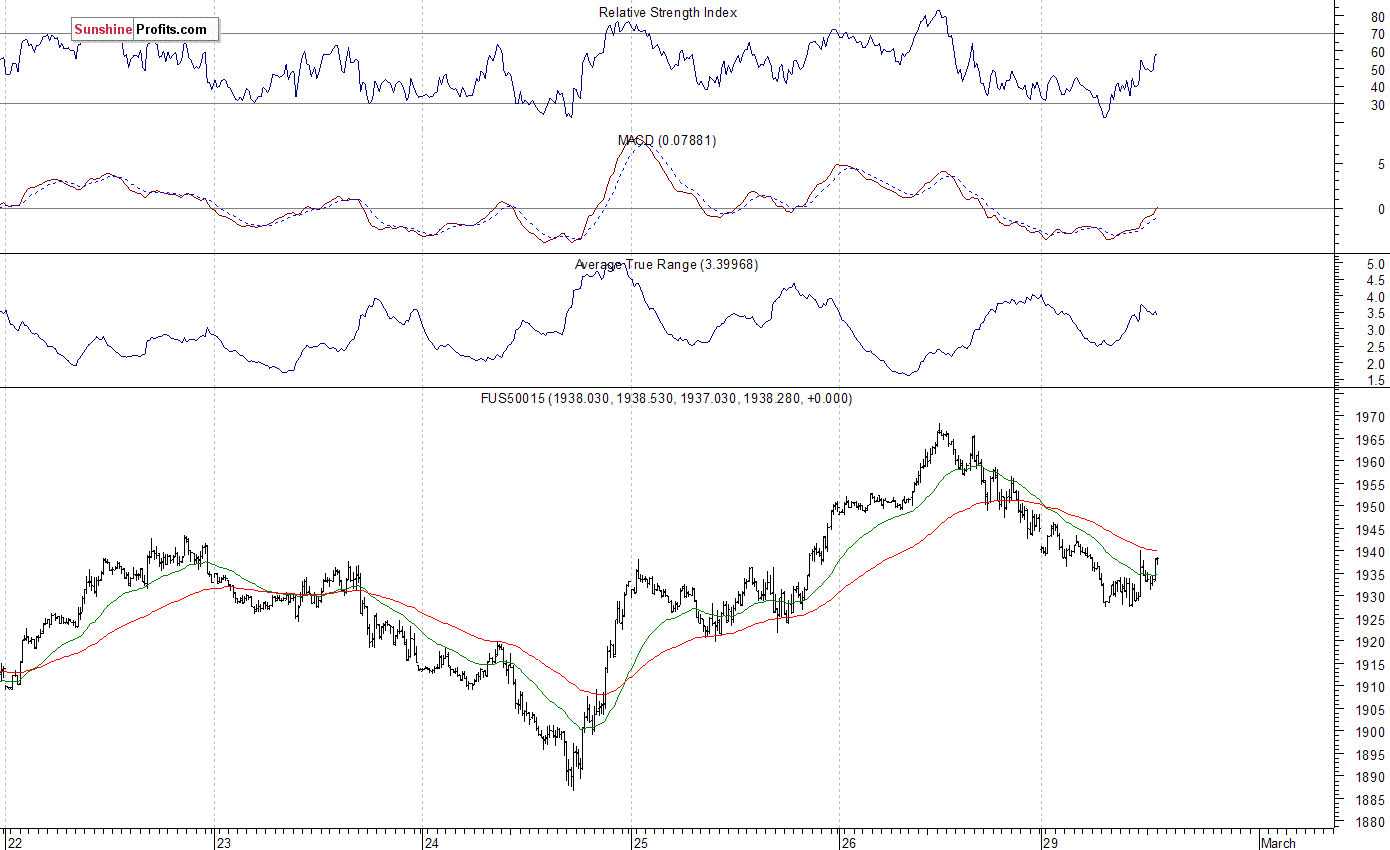
Expectations before the opening of today's trading session are negative, with index futures currently down 0.2-0.3%. The main European stock market indexes have lost 0.4-1.1% so far. Investors will now wait for some economic data releases: Chicago PMI at 9:45 a.m., Pending Home Sales at 10:00 a.m. The S&P 500 futures contract trades within an intraday downtrend, following its Friday's decline. However, there have been no confirmed short-term negative signals so far. The nearest important level of resistance is at around 1,950-1,970, marked by Friday's local high, among others. On the other hand, potential support level is at 1,900-1,920, as the 15-minute chart shows:
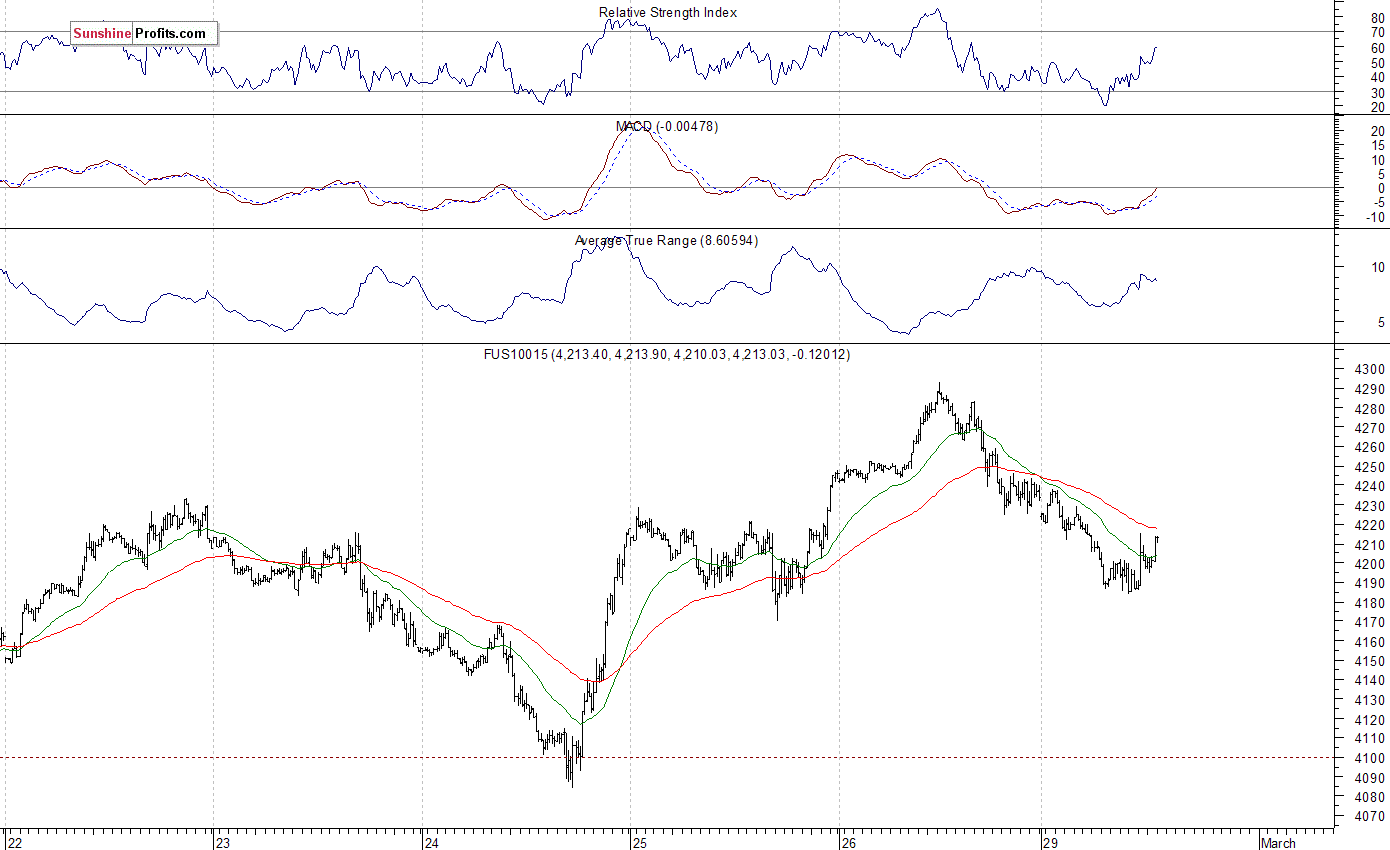
The technology Nasdaq 100 futures contract follows a similar path, as it currently trades along the level of 4,200. The nearest important level of resistance is at 4,250-4,300. On the other hand, support level is at 4,170-4,200. Is this a consolidation within short-term uptrend or some topping pattern following recent move up?
Concluding, the broad stock market extended its short-term uptrend on Friday, before closing slightly lower, as investors took profits off the table. Is this just a correction following recent move up or some topping action before uptrend's reversal? There have been no confirmed short-term negative signals so far. The index continues to trade along last year's August - September local lows, as they act as medium-term level of support. We prefer to be out of the market, avoiding low risk/reward ratio trades. We will let you know when we think it is safe to get back in the market.
Thank you.
Paul Rejczak
Stock Trading Strategist
Stock Trading Alerts

