

Briefly: In our opinion, no speculative positions are justified.
Our intraday outlook is neutral, and our short-term outlook is neutral. Our medium-term outlook remains bearish, as the S&P 500 index extends its lower highs, lower lows sequence:
Intraday outlook (next 24 hours): neutral
Short-term outlook (next 1-2 weeks): neutral
Medium-term outlook (next 1-3 months): bearish
Long-term outlook (next year): neutral
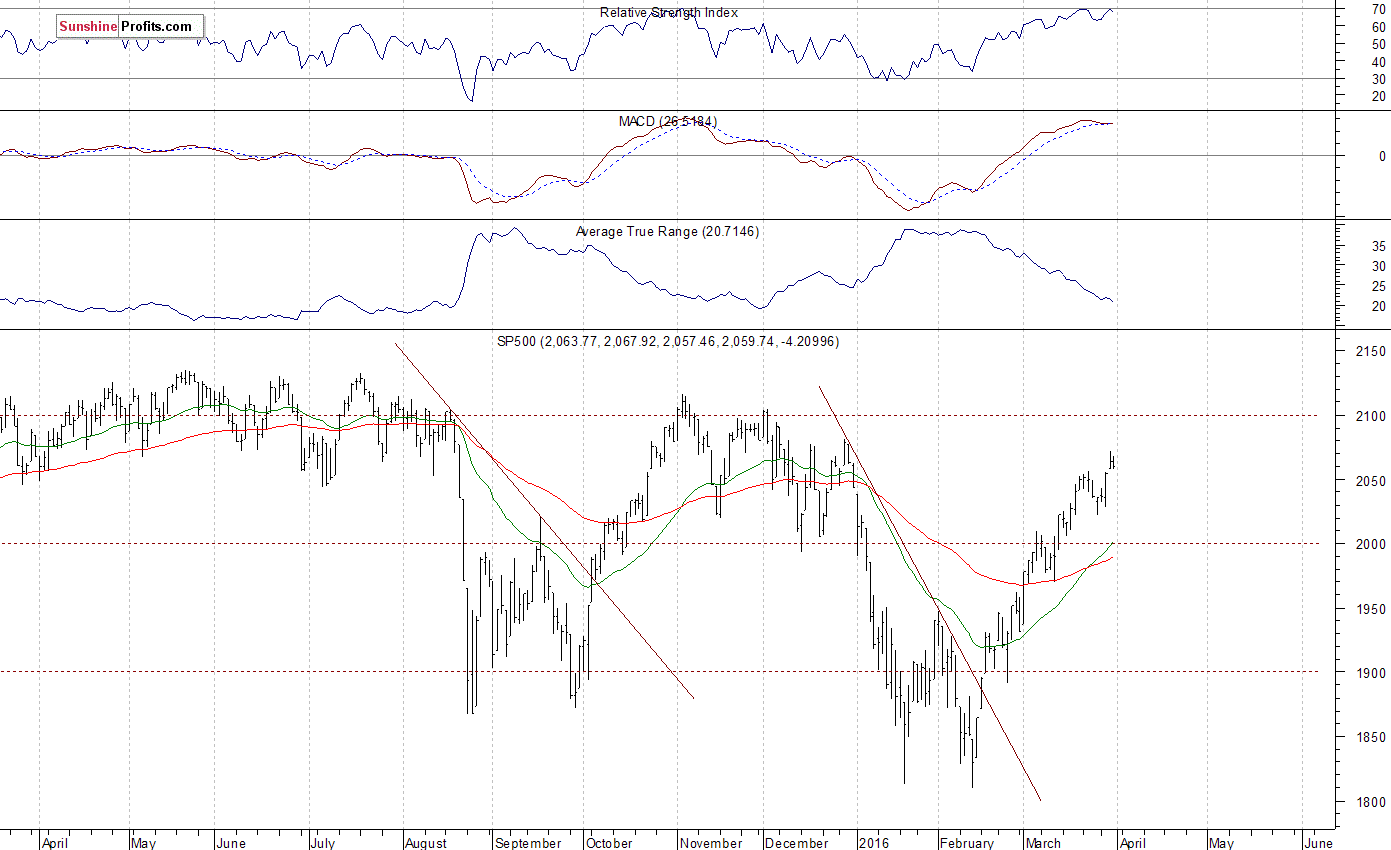
The U.S. stock market indexes lost 0.2% on Thursday, retracing some of their Wednesday's advance, as investors took short-term profits off the table. The S&P 500 index extended its short-term uptrend on Wednesday, following Tuesday's Janet Yellen's speech, economic data releases. It remains above its last week's high of 2,056.60. The nearest important level of resistance is at around 2,070-2,080, marked by the late December local high of 2,081.56. The next resistance level is at 2,100-2,120, marked by previous medium-term highs. On the other hand, support level is at 2,055-2,060, marked by Wednesday's daily gap up of 2,055.91-2,058.27. The next support level remains at 2,000, marked by previous level of resistance. There have been no confirmed negative signals so far. However, we can see some technical overbought conditions. The index continues to trade within a slightly descending medium-term trading channel, as the daily chart shows:
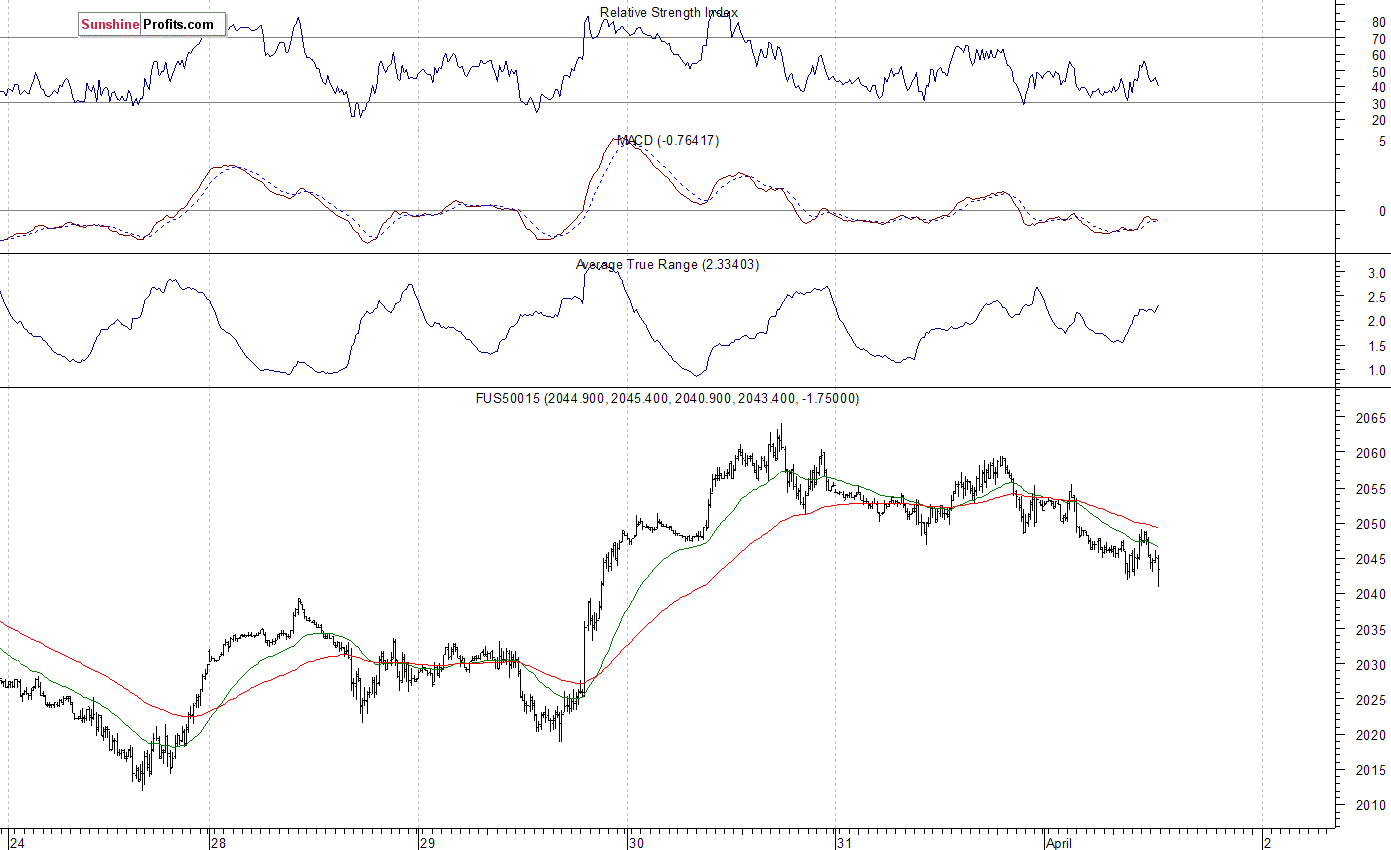
Expectations before the opening of today's trading session are negative, with index futures currently down 0.4-0.5%. The main European stock market indexes have lost 1.4-2.1% so far. Investors will now wait for series of important economic data announcements: Nonfarm Payrolls, Unemployment Rate at 8:30 a.m., Construction Spending, ISM Index, Michigan Sentiment at 10:00 a.m. The S&P 500 futures contract trades within an intraday downtrend, as it retraces some more of its recent move up. The nearest important level of resistance is at around 2,050-2,060. On the other hand, support level is at 2,030-2,040, and the next important level of support remains at 2,000-2,010. Will the short-term uptrend continue? Or is this a topping pattern before a downward correction?
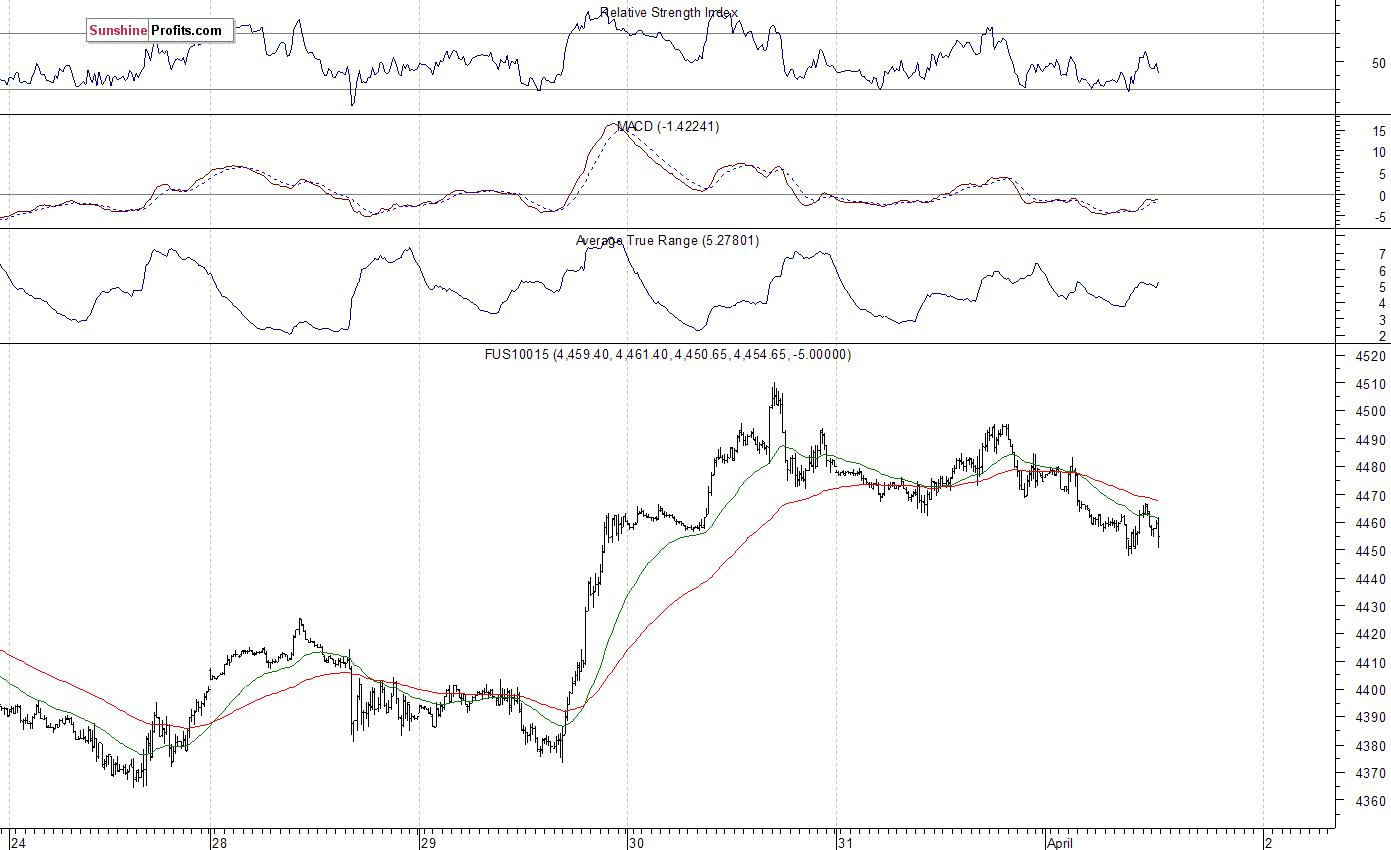
The technology Nasdaq 100 futures contract follows a similar path, as it currently trades close to the level of 4,450, after bouncing off resistance level at 4,500. The nearest important level of support is at around 4,450. The next important level of support is at 4,420-4,440, marked by previous consolidation, as we can see on the 15-minute chart:
Concluding, the broad stock market remained within a relatively narrow trading range on Thursday, as investors awaited today's important economic data releases. The S&P 500 index is getting closer to its last year's medium-term highs. Will it break above the crucial long-term resistance level of 2,100-2,150 this time? Or is this just an upward move within a slightly descending medium-term trading channel? We can see some short-term technical overbought conditions. However, there have been no confirmed negative signals. We still prefer to be out of the market, avoiding low risk/reward ratio trades. We will let you know when we think it is safe to get back in the market.
Thank you.
Paul Rejczak
Stock Trading Strategist
Stock Trading Alerts

