
Briefly: In our opinion, speculative short positions are favored (with stop-loss at 2,050, and profit target at 1,900, S&P 500 index).
Our intraday outlook is bearish, and our short-term outlook is bearish, as we expect a downward correction or short-term uptrend's reversal at some point. Our medium-term outlook remains bearish, as the S&P 500 index extends its lower highs, lower lows sequence. We decided to change our long-term outlook to neutral recently, following a move down below medium-term lows:
Intraday outlook (next 24 hours): bearish
Short-term outlook (next 1-2 weeks): bearish
Medium-term outlook (next 1-3 months): bearish
Long-term outlook (next year): neutral
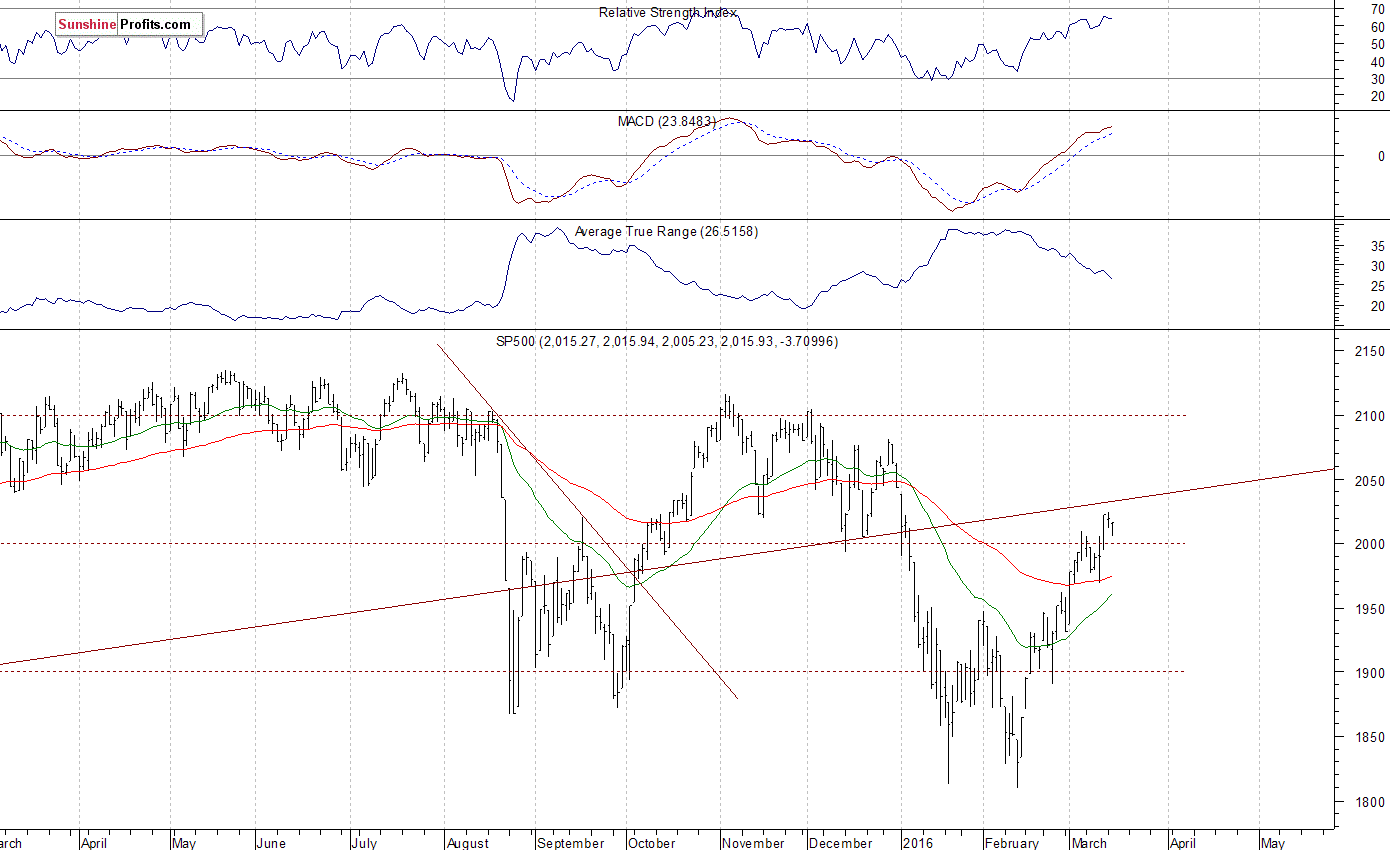
The U.S. stock market indexes were virtually flat on Tuesday, as investors hesitated following recent advance. The S&P 500 index continues to trade above the level of 2,000. The nearest important level of resistance is at around 2,025, marked by Monday's daily high, and the next resistance level is at 2,040, marked by the early January daily gap down of 2,038.20-2,043.62. On the other hand, support level remains at 2,000 mark, and the next support level is at 1,960-1,980, marked by previous level of resistance. There have been no confirmed negative signals so far. However, we can see some technical overbought conditions. Is this a new uptrend leading to last year's all-time high or just an upward correction following January sell-off? The S&P 500 trades within a short-term consolidation, as we can see on the daily chart:
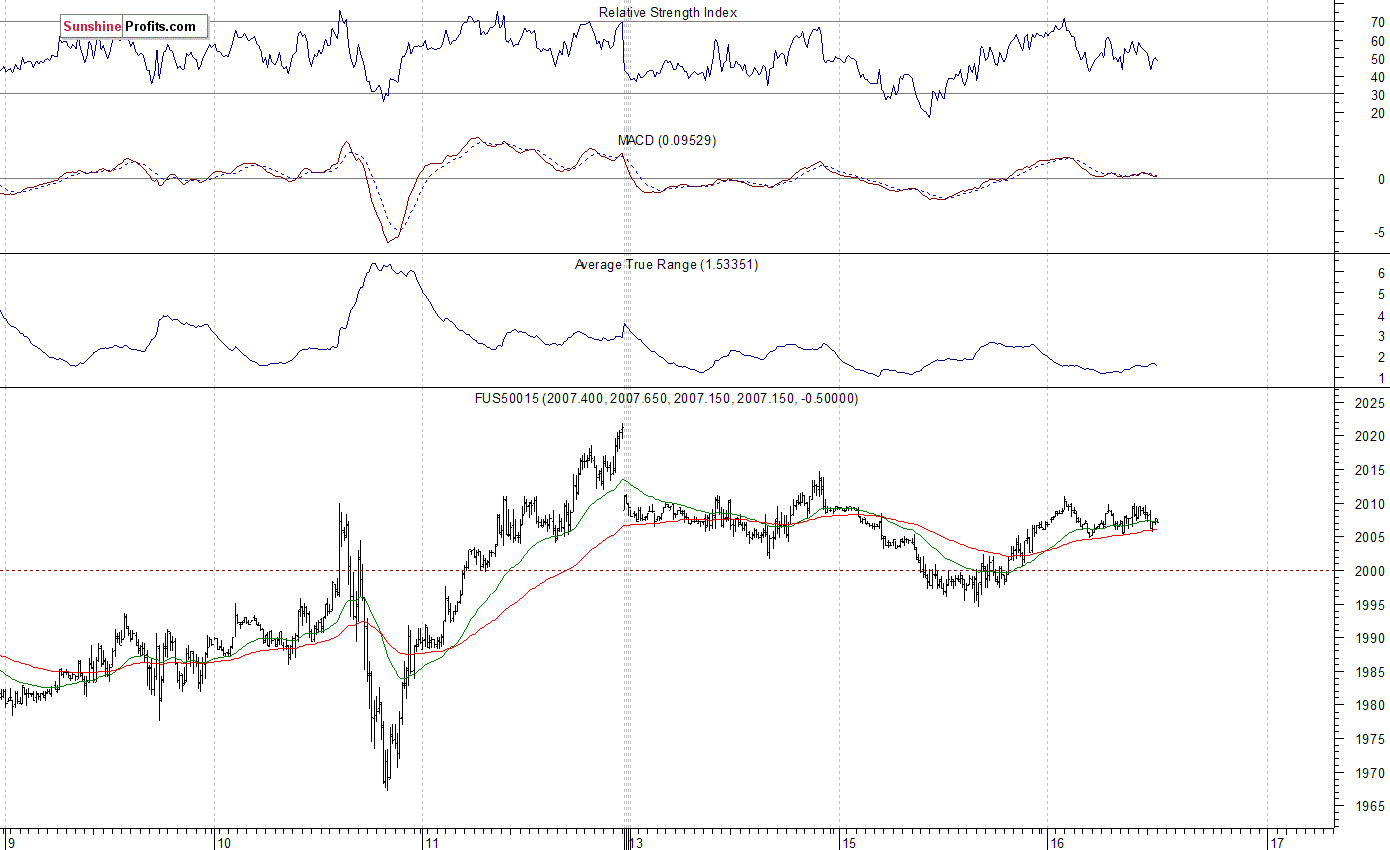
Expectations before the opening of today's trading session are virtually flat. The European stock market indexes have been mixed so far. Investors will now wait for series of economic data announcements: Consumer Price Index, Housing Starts, Building Permits at 8:30 a.m., Industrial Production, Capacity Utilization at 9:15 a.m., Crude Inventories at 10:30 a.m., and finally: the FOMC's Rate Decision release at 2:00 p.m. The S&P 500 futures contract trades within an intraday consolidation, after yesterday's rebound off 1,995-2,000 support level. The nearest important level of resistance is at around 2,015-2,020, marked by local highs. There have been no confirmed negative signals so far. But will the short-term uptrend continue?
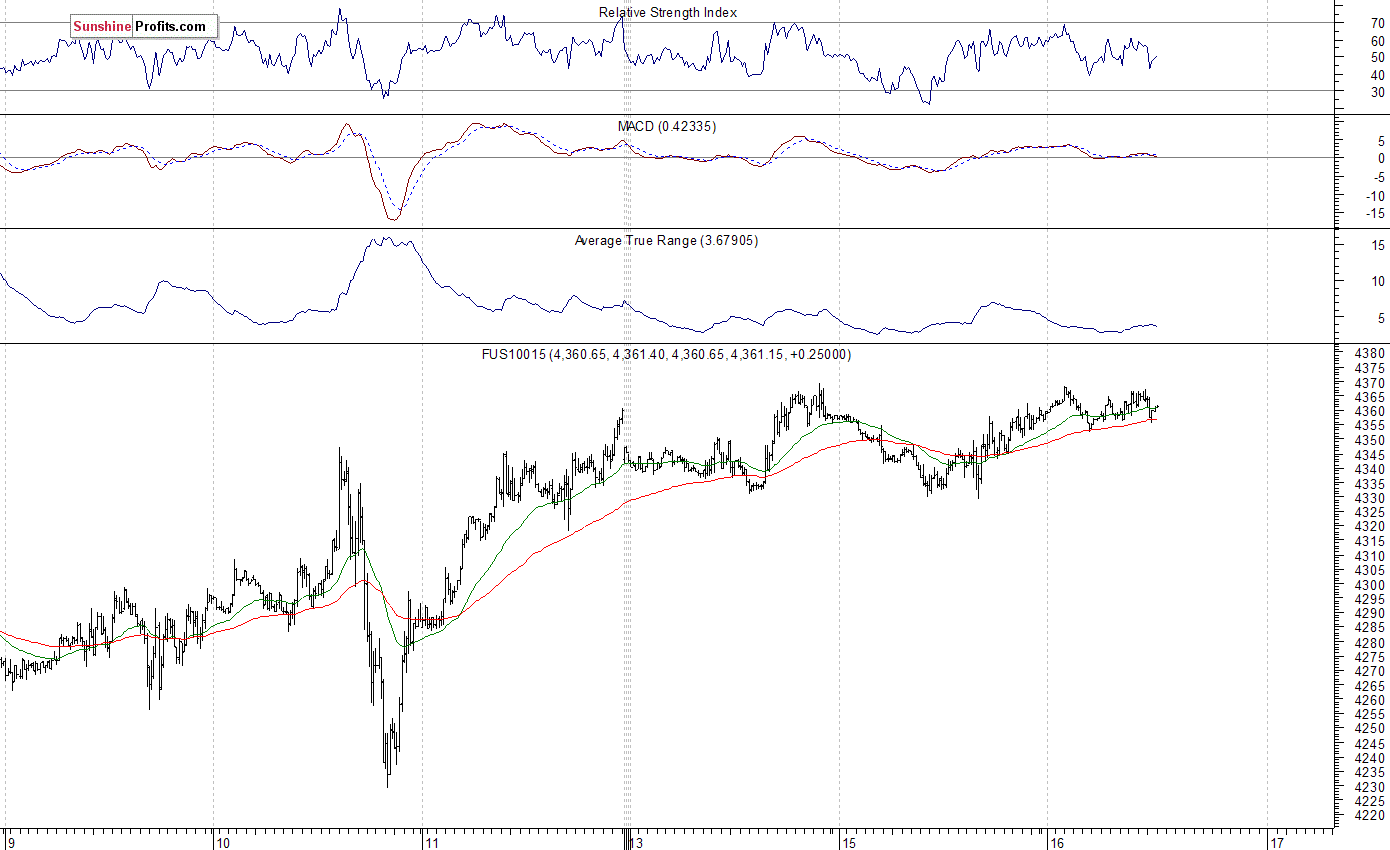
The technology Nasdaq 100 futures contract follows a similar path, as it trades within an intraday consolidation. The nearest important level of resistance is at around 4,370, marked by recent local highs. On the other hand, support level remains at 4,330-4,350. For now, it looks like a flat correction following recent advance:
Concluding, the broad stock market remains within a short-term consolidation, as the S&P 500 index continues to fluctuate above the level of 2,000. Will it break above its Monday's local high of 2,024.57? There have been no confirmed short-term negative signals so far. However, we continue to maintain our speculative short position (opened on March 7th at 1,995, S&P 500 index). We expect a downward correction or uptrend reversal at some point. Stop-loss level is at 2,050, marked by the above-mentioned daily gap down resistance level, and potential profit target is at 1,900 (S&P 500 index). You can trade S&P 500 index using futures contracts (S&P 500 futures contract - SP, E-mini S&P 500 futures contract - ES) or an ETF like the SPDR S&P 500 ETF - SPY. It is always important to set some exit price level in case some events cause the price to move in the unlikely direction. Having safety measures in place helps limit potential losses while letting the gains grow.
Thank you.
Paul Rejczak
Stock Trading Strategist
Stock Trading Alerts

