
Briefly: In our opinion, speculative short positions are favored (with stop-loss at 2,210, and profit target at 2,050, S&P 500 index).
Our intraday outlook is bearish, and our short-term outlook is bearish. Our medium-term outlook is neutral, following S&P 500 index breakout above last year's all-time high:
Intraday outlook (next 24 hours): bearish
Short-term outlook (next 1-2 weeks): bearish
Medium-term outlook (next 1-3 months): neutral
Long-term outlook (next year): neutral
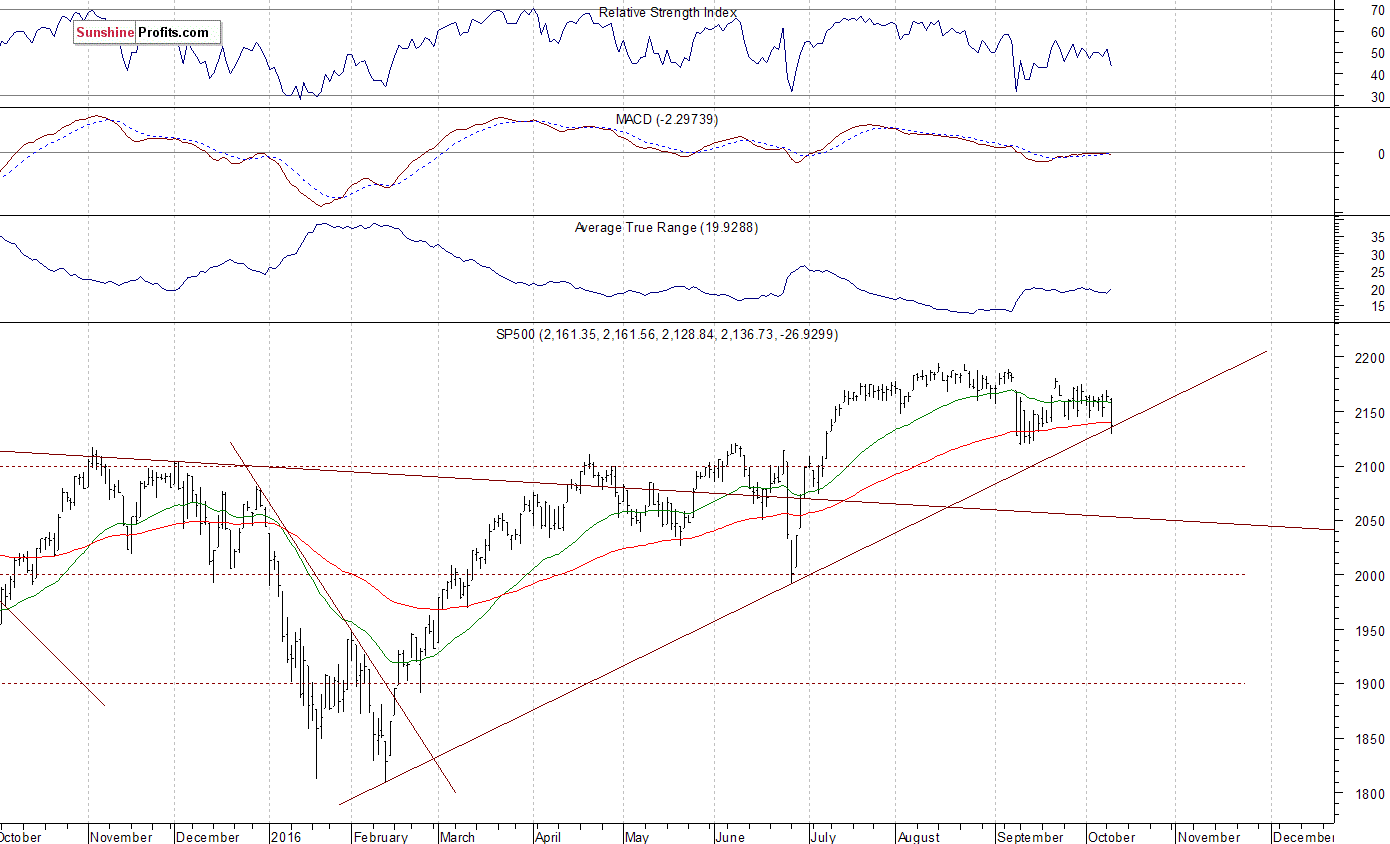
The U.S. stock market indexes lost between 1.1% and 1.5% on Tuesday, breaking below their few-week-long consolidation, as investors' sentiment worsened following Monday's move up. The S&P 500 index is the lowest since half of September. Is this a new downtrend or just more medium-term consolidation following June - July rally? The nearest important level of resistance is at around 2,140-2,150, marked by previous support level. The next resistance level is at 2,170, among others. On the other hand, support level is at around 2,120, marked by September local low, as the daily chart shows:
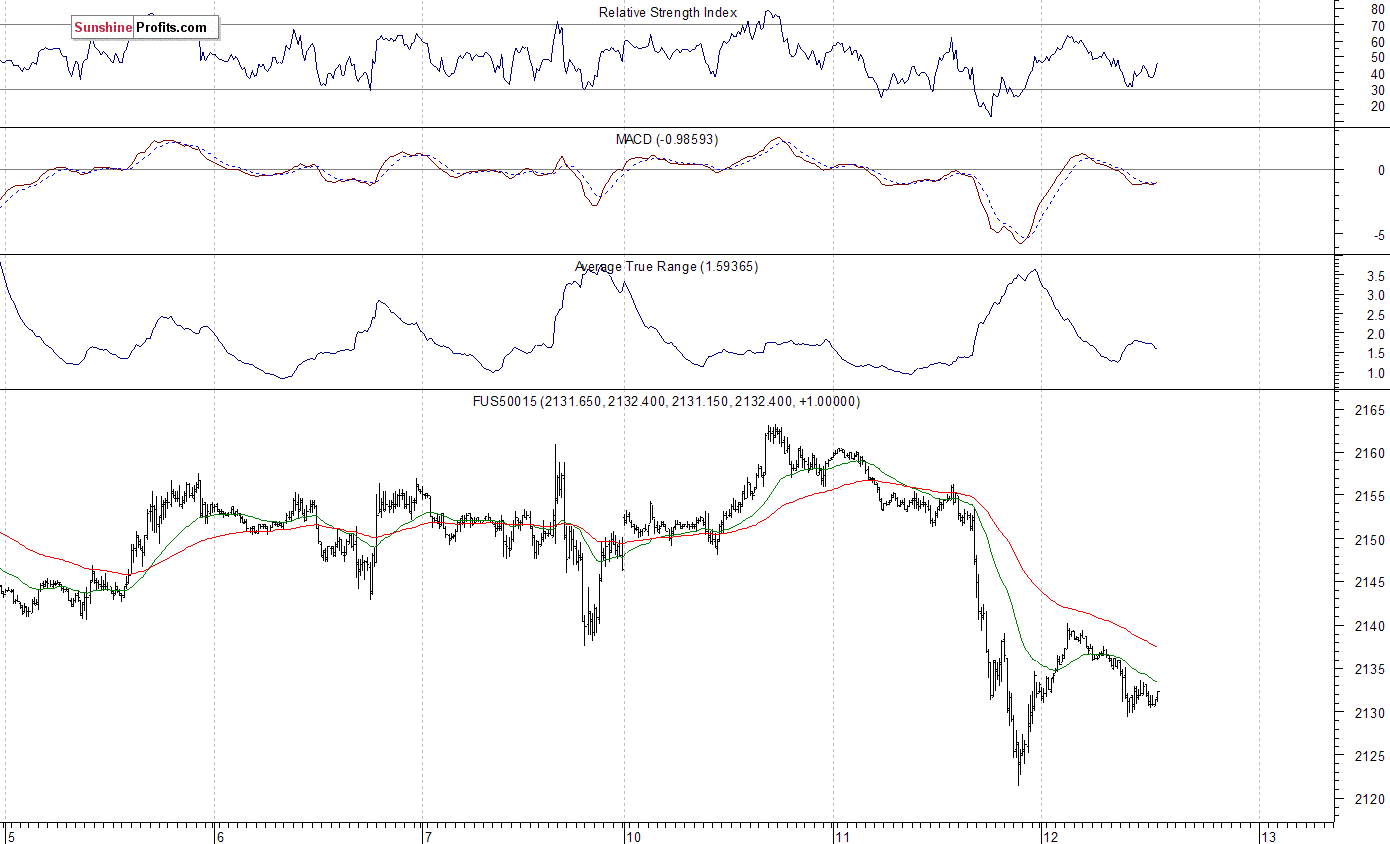
Expectations before the opening of today's trading session are slightly negative, with index futures currently down 0.1-0.2%. The European stock market indexes have lost 0.1-0.3% so far. Investors will now wait for some economic data announcements: JOLTS - Job Openings at 10:00 a.m., Crude Inventories number at 10:30 a.m., FOMC Minutes at 2:00 p.m. The S&P 500 futures contract trades within an intraday consolidation, as it fluctuates following yesterday's decline. The nearest important resistance level is at around 2,140, marked by an intraday local high. On the other hand, support level is at 2,120. There have been no confirmed short-term positive signals so far.
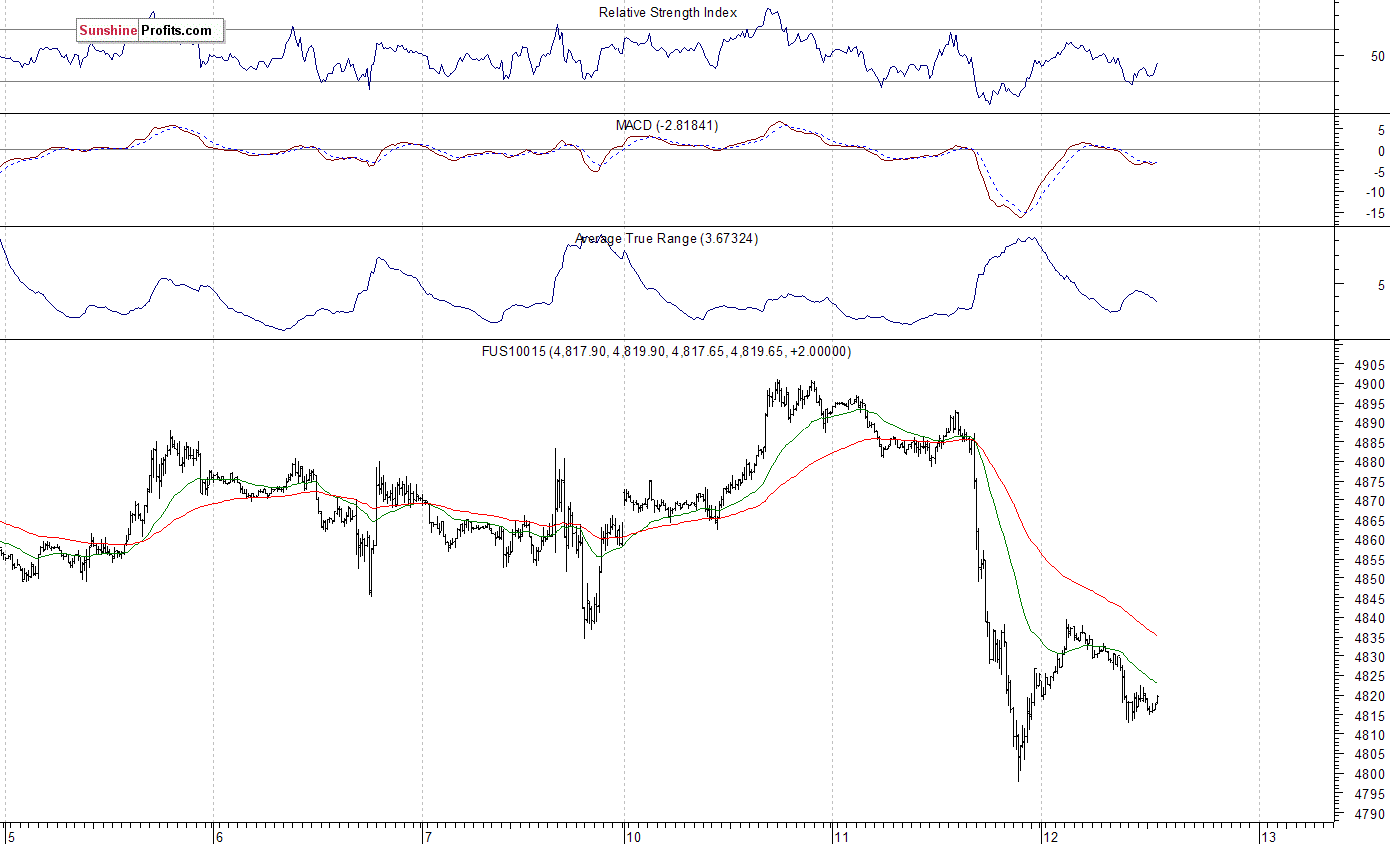
The technology Nasdaq 100 futures contract trades within an intraday consolidation, following yesterday's move down. The nearest important support level is at around 4,800. On the other hand, resistance level is at 4,840-4,850, marked by previous support level, as we can see on the 15-minute chart:
Concluding, the broad stock market sold off yesterday, as the S&P 500 index got closer to its mid-September local lows at around 2,120. Will it continue its short-term downtrend? Or is this just medium-term consolidation? We continue to maintain our speculative short position (opened on July 18th at 2,162, S&P 500 index). Stop-loss level is at 2,210 and potential profit target is at 2,050 (S&P 500 index). You can trade S&P 500 index using futures contracts (S&P 500 futures contract - SP, E-mini S&P 500 futures contract - ES) or an ETF like the SPDR S&P 500 ETF - SPY. It is always important to set some exit price level in case some events cause the price to move in the unlikely direction. Having safety measures in place helps limit potential losses while letting the gains grow.
Thank you.
Paul Rejczak
Stock Trading Strategist
Stock Trading Alerts

