

Briefly: In our opinion, no speculative positions are justified.
Our intraday outlook is neutral, and our short-term outlook is neutral. Our medium-term outlook remains bearish, as the S&P 500 index extends its lower highs, lower lows sequence:
Intraday outlook (next 24 hours): neutral
Short-term outlook (next 1-2 weeks): neutral
Medium-term outlook (next 1-3 months): bearish
Long-term outlook (next year): neutral
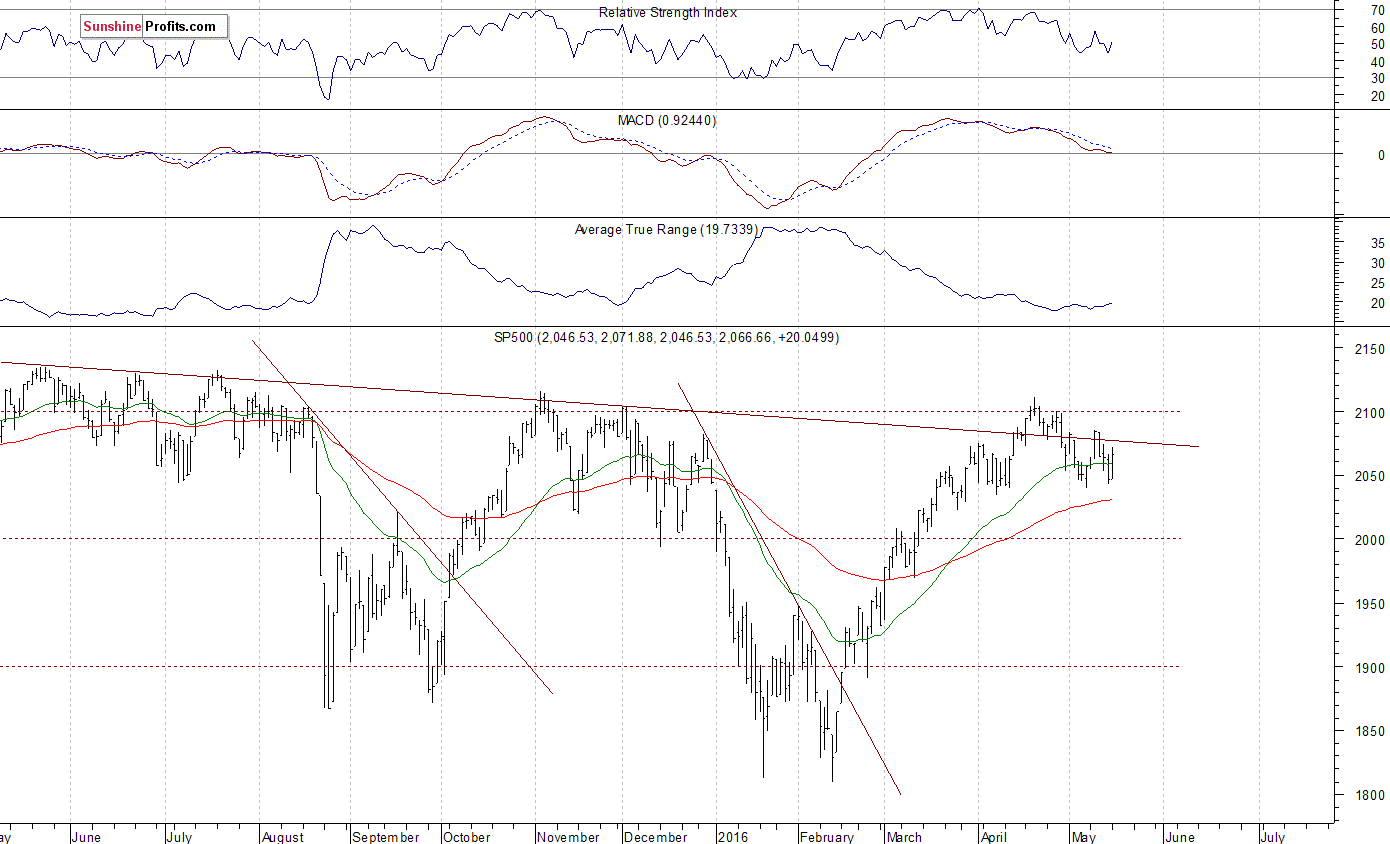
The U.S. stock market indexes gained between 1.0% and 1.3% on Monday, retracing their last week's decline, as investors' sentiment continued to fluctuate following economic data releases, among others. The S&P 500 index extends its fluctuations along the level of 2,050. It is the nearest important support level. The next support level is at 2,000-2,020. On the other hand, resistance level is at 2,070-2,085, marked by last week's local highs. The next important level of resistance remains at 2,100-2,110, marked by late April highs. Last year's highs along the level of 2,100 continue to act as a medium-term resistance level. Will the market break above these medium-term highs and continue its seven-year long bull market?
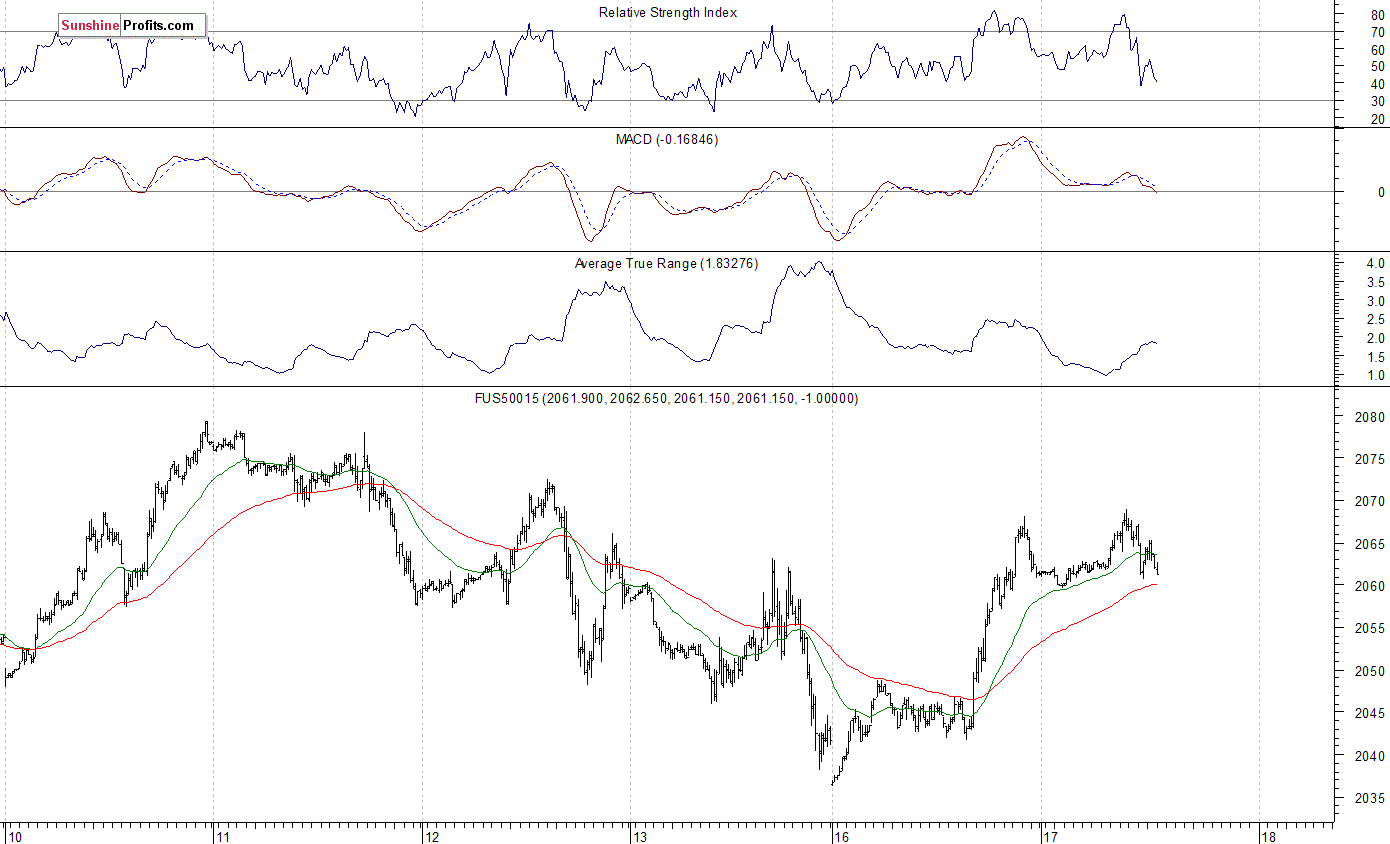
Expectations before the opening of today's trading session are virtually flat. The main European stock market indexes have gained 0.1-0.5% so far. Investors will now wait for some economic data announcements: Consumer Price Index, along with Housing Starts, Building Permits at 8:30 a.m., Industrial Production, Capacity Utilization at 9:15 a.m. The S&P 500 futures contract trades within an intraday consolidation, as it bounces off short-term resistance level at around 2,070. The nearest important level of support is at 2,045-2,050, marked by previous consolidation, among others. The market extends its short-term fluctuations. Will it break above its recent high?
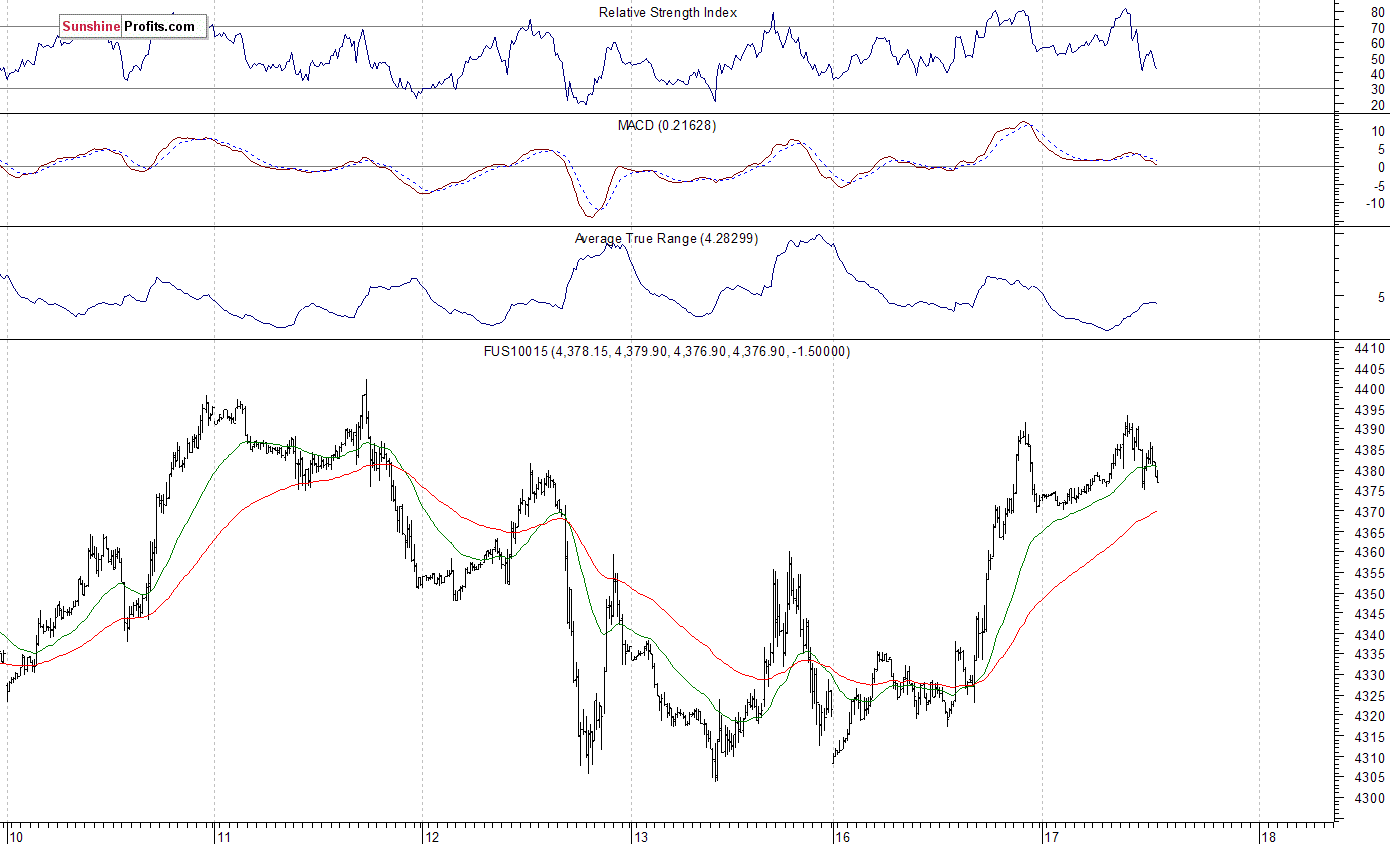
The technology Nasdaq 100 futures contract follows a similar path, as it fluctuates after its yesterday's advance. The nearest important level of resistance is at around 4,390-4,400. On the other hand, support level remains at 4,300-4,350. For now, it looks like a short-term consolidation, as the market trades just below its last week's high:
Concluding, the broad stock market bounced off its support level yesterday, as investors' sentiment improved once again. Will it break above the recent consolidation? The index remains relatively close to last year's medium-term highs along the level of 2,100 and continues to trade above its late March - early April lows. It still looks like a correction within a medium-term uptrend, so we prefer to be out of the market, avoiding low risk/reward ratio trades. We will let you know when we think it is safe to get back in the market.
Thank you.
Paul Rejczak
Stock Trading Strategist
Stock Trading Alerts

